

Abstract
Pterosaurs were a successful group of Mesozoic flying reptiles. They were the first vertebrate group to achieve powered flight and varied enormously in morphology and ecology, occupying a variety of niches and developing specialized feeding strategies. Ecomorphological principles suggest this variation should be reflected by great morphological diversity in the lower jaw, given that the mandible served as the primary apparatus for prey acquisition. Here we present the first study of mandibular shape disparity in pterosaurs and aim to characterize major aspects of variation. We use a combination of geometric morphometric approaches, incorporating both outline analysis using elliptical Fourier analysis and semi-landmark approaches. Our results show that morphological convergence is prevalent and many pterosaurs, belonging to diverse dietary groups and subclades, overlap in morphospace and possessed relatively simple ‘rod-shaped’ jaws. There is no clear trend of size distributions in pterosaur mandibular morphospace, and larger forms are widely distributed. Additionally, there is limited functional signal within pterosaur lower jaw morphospace. Instead, the development of a large anterior ventral crest represents the major component of disparity. This suggests that a socio-sexual trait was a key driver for innovation in pterosaur lower jaw shape.
Keywords: pterosauria, geometric morphometrics, disparity, morphospace
1. Introduction
Pterosaurs were the first vertebrate group to achieve powered flight and include the largest animals to ever fly, making them an extremely important fossil group to understand [1,2]. During their long evolutionary history, ranging from the Late Triassic (ca 210 Ma) to the end of the Cretaceous (66 Ma), pterosaurs filled many ecological niches [3,4]. These included arboreal [5], coastal [6] and terrestrial forms [7,8], with a great variety of diets, such as insectivory, piscivory, carnivory, hypothesized frugivory and even feeding on small marine organisms through filter feeding [8–11]. This ecological variation is reflected by incredible morphological diversity, including many anatomical specializations in feeding-related morphology of the skull, mandible and dentition [12] (figure 1).
Figure 1.

Morphological variation in pterosaur lower jaws. The illustrated taxa are (a) Raeticodactylus, (b) Rhamphorhynchus, (c) Pterodaustro, (d) Cycnorhamphus, (e) Tapejara, (f) Anhanguera, (g) Dsungaripterus and (h) Quetzalcoatlus. The selected jaws are illustrated to highlight shape disparity in the lateral profile and are not plotted to scale. Jaws (b), (c) and (e–h) are based on illustrations by Jaime Headden.
Mandibular morphology is expected to have a strong dietary and ecological signal, with feeding mode predicted to be a strong determinant for variation [13–18]. In pterosaurs, the mandible served as the primary apparatus for food acquisition and processing, whereas the skull also accommodated the brain, sensory systems and, in some cases, extremely extravagant cranial crests [19]. Recently, Zhou et al. [20] investigated ecomorphological innovations during pterosaur evolutionary history. They suggest that early pterosaurs were either insectivores or piscivores, while other feeding habits arose during the Cretaceous. Zhou et al. [20] also suggest that different feeding habits can be distinguished in empirical morphospaces derived from discrete descriptive characters. Some dsungaripterids had very distinct lower jaws with durophagous posterior dentition, and the lower jaw of the genus Dsungaripterus had a distinctly upturned anterior tip. Ornithocheirids and anhanguerids had forward-facing teeth anteriorly and long, slender lower jaws, probably aiding the capture of fish [21]. Large-bodied derived azhdarchids, such as Quetzalcoatlus, had slender lower jaws and may have been carnivorous, preying on small vertebrates such as juvenile dinosaurs [8]. Pterodaustro exhibited a geometrically bizarre mandibular morphology with a curving ‘scoop-shape’, densely packed with needle-like teeth, proposedly used for filter feeding [22]. The mandible of Cycnorhamphus was also unconventional, with pronounced curvature in the anterior symphyseal region and peg-like teeth restricted to the tip [23] (figure 1).
Pterosaur jaw shape disparity has never been considered in a macroevolutionary context. It is not known whether morphological divergence is the overriding trend, or if convergence is prevalent, particularly for taxa with similar dental morphologies, or sizes—owing to aerodynamic constraints or possibly phylogenetic signal.
The relationship between aerodynamics, pterosaur anatomy and skeletal specialization has been the subject of much research [24–27], with emphasis placed on the importance of large body size and an aerial lifestyle [28–30]. The diversification of pterosaurs gave rise to an exceptional range of body sizes, with wingspans ranging from 1 to 10 m [31]. Size is often an important component for determining variation in other traits, and the relationship between size and shape (allometry) is well documented [32–34]. Mandible size may have been an important factor for shape innovation in pterosaurs, potentially acting as both a constraint, on less aerodynamically efficient forms, and/or a catalyst for variation, by expanding the range of prey sizes that could be consumed.
Morphological diversity (disparity) can be quantified and visualized in several ways, including geometric morphometric landmarks and outlines (e.g. [34–36]), functionally relevant measurements and ratios [37,38] and discrete descriptive characters [20,39,40]. Previous pterosaur disparity studies have been conducted, which assessed disparity of the skull with geometric landmarks [41], skeletal disparity based on discrete characters [2] and ecomorphological variation using continuous and discrete cranial characters [20], but mandible shape has never been considered. Mandibular disparity has been the focus of studies exploring ecomorphological and functional variation in a macroevolutionary context in other groups, including arthrodires [13,42], early tetrapods [43], mammals [17], crurotarsans [35] and dinosaurs [18].
Here we examine mandibular disparity in pterosaurs using two morphometric approaches: outline analysis based on elliptical Fourier analysis (EFA) and semi-landmark (SLM) analysis. Our aim is to explore shape variation and produce empirical morphospaces, characterizing major aspects of morphological variation in the pterosaur lower jaw. We examine the distribution of pterosaur subgroups in morphospace to test the prevalence of morphological divergence and convergence, and investigate potential constraints, such as jaw size and feeding guild (guided by dental morphology). We test whether morphological disparity in the lower jaw is evenly distributed throughout the clade, or whether particular dietary guilds and subclades show higher disparity. Using two complementary methodological techniques, we also provide a comparative assessment of whether different morphometric protocols converge on a common signal.
2. Methods
2.1. Taxon sampling
A sample of 46 pterosaur lower jaws was used to investigate morphological disparity in the clade (electronic supplementary material). Complete laterally preserved mandibles are relatively rare in the pterosaur fossil record, but there is a sufficient enough number to sample representatives of all major subclades, time intervals and ecologies, except for the enigmatic anurognathids. Our sample size and scope are comparable with previous disparity studies (e.g. [41]). Individual specimens were used to represent each taxon, and lateral jaw images were sourced during collection visits and from figures and reconstructions in the literature (see electronic supplementary material). For comparative purposes, the specimens were grouped into taxonomic subgroups and dental guilds (electronic supplementary material). Taxonomic group selection and membership was guided by the large-scale phylogenetic analyses of Andres & Myers [44] and Andres et al. [45]. Dental guild selection and membership were decided through comparative assessment, based on eight guilds (see electronic supplementary material). These comparisons were used to investigate if similar dental guilds were associated with lower jaw shape, with the null expectation that taxa with similar teeth would have similar feeding habits, and therefore also similar lower jaw shapes.
2.2. Morphometric analyses
This study focuses on the quantification and visualization of overall geometric variation in the lateral profile of the pterosaur lower jaw (figures 1 and 2). In pterosaur jaws, due to both biological and taphonomic reasons, there are few clearly identifiable homologous points which would serve as robust anatomical loci in standard landmark-based geometric morphometrics [46]. We therefore use two methodological approaches specifically designed to capture geometric shape variation where there is a lack of fixed homologous points: two-dimensional outline analysis based on EFA and SLM analysis.
Figure 2.

Landmark and outline protocols for the geometric morphometric analyses. (a) Mandible of Pteranodon AMNH FARB 7515 in lateral view. (b) Schematic illustrating the positions of landmarks (red) and SLM curves (grey). (c) Schematic illustrating the shape represented by a closed outline. Scale bar, 10 cm.
For the EFA, the 46 lower jaws were converted into digitized outlines forming closed curves (figure 2c). To remove the noise effects of size, position and rotation, the jaw outlines were manually centred, scaled and aligned along the x-axis. The outlines were then defined by a standard number of x- and y-coordinate points (500) and a consistent starting position for the first coordinate was designated (southwards of the centroid) [47]. In EFA, a set of harmonics (sine and cosine functions) are generated through Fourier decomposition, aiming to imitate the target shapes. Each harmonic yields four Fourier coefficients describing the shapes (sine and cosine amplitudes for both x- and y-projections). Here, 11 harmonics were retained for each jaw (44 Fourier coefficients), encapsulating 99% of the cumulative power. These coefficients were then subjected to principal components analysis (PCA) to ordinate the sampled jaws and explore major aspects of the geometric variation. The outline analyses were performed in the R package Momocs [47].
For the SLM analysis, we used a combined landmark/SLMs approach (figure 2b). Only three homologous landmarks could be consistently identified: (i) the most anterior point of the dorsal surface of the lower jaw, (ii) the point at which the lower jaw articulates with the cranium and (iii) the most posterior point of the lower jaw at the end of the retroarticular process (figure 2b). To capture the entire shape of the mandible, 40 SLMs were positioned on three curves: 15 points between landmarks 1 and 2 (dorsal surface of the mandible), five points between landmarks 2 and 3, and 20 points between landmarks 3 and 1 (ventral surface of the mandible). The fixed and SLMs were applied digitally to all specimens using tpsDig [48]. To remove the noise effects of size, position and rotation, all 43 landmarks were aligned using a generalized Procrustes analysis (GPA) [46]. During the GPA, the SLMs were allowed to iteratively slide to minimize Procrustes distances between each specimen and the average shape [49]. The resulting set of aligned landmark coordinates were then subjected to PCA, to examine key components of shape variation. GPA and PCA were conducted in PAST [50] and the R package geomorph [51].
We assess similarity in how the morphometric techniques quantify shape variation using correlations of pairwise distances. Mantel tests were performed on Euclidean distance matrices derived from the 44 Fourier coefficients (EFA) and the Procrustes-aligned landmark coordinates (SLM). Strong correlation between the distance matrices would imply that both techniques capture similar morphological differences. Calculations were performed in the R package ade4 [52] and vegan [53].
2.3. Morphospace occupation
Statistical tests were used to identify significant differences in morphospace occupation between the taxonomic groups and dental guilds. We use a series of non-parametric multivariate analysis of variance (NPMANOVA) tests. These permutation tests were performed on principal component (PC) scores from axes incorporating 95% of overall variation. Statistically significant differences, and therefore contrasting morphospace occupation, are denoted by p < 0.05 after Bonferroni's corrections for multiple comparisons. NPMANOVA tests were performed in PAST [50].
To explore phylogenetic branching patterns within the morphospaces, a pterosaur phylogeny was superimposed. We used the large-scale phylogeny from Andres et al. [45] because it is more recent than the alternative commonly used phylogenies of Unwin [54] and Kellner and co-workers [55], and it has been used in other macroevolutionary studies (e.g. [31]). This tree also maximized taxonomic coverage; however, the following taxa had to be added informally based on placements described in the literature: Barbosania gracilirostris, Bergamodactylus wildi, Caiuajara dobruskii, Hamipterus tianshanensis, Ikrandraco avatar and Jianchangnathus robustus. The ‘Painten pro-pterodactyloid’ of Tischlinger & Frey [56] was excluded from the phylomorphospaces because its phylogenetic position is uncertain. The tree was time-calibrated with the midpoint of each taxon's stratigraphic range, using the equal dating method [57,58]. Absolute ages for the occurrences are from Benson et al. [31] and Gradstein et al. [59]. The positions of internal nodes in the phylomorphospaces were estimated using maximum-likelihood approaches in the R package phytools [60].
2.4. Size and shape
Statistical tests for allometry were based on multivariate regressions of the jaw shape variables and centroid size [32]. For the outline-based shape data, multivariate regression was performed on the 44 Fourier coefficients and log-transformed centroid size. For the landmark-based approach, allometry was assessed based on a multivariate regression of the Procrustes-aligned coordinates and log-transformed centroid size. Centroid size was calculated from the landmark coordinates using tpsRelw [61]. The statistical significance for each correlation test was assessed with permutation tests using 9999 iterations. All correlation tests were performed in the R package geomorph [51].
2.5. Disparity analyses
Comparative morphological disparity analyses were performed to test if taxonomic and dental subgroups showed equal morphological variation. Disparity was quantified based on the positions of taxa in the multivariate morphospaces. Taxa were binned into the taxonomic and dental groupings (electronic supplementary material) and PC scores from the axes that represented 95% of overall variation were used to quantify morphological variation. Disparity is here based on the sum of variances metric. Confidence intervals (95%), generated by bootstrapping with 10 000 replications, were used to test for statistically significant differences in disparity. All analyses were performed with the MDA Matlab® package [62] and in R [63].
3. Results
3.1. Pterosaur morphospace trends
In both outline and SLM-based analyses, most shape variation in pterosaur lower jaws can be summarized by the first two PC axes (figures 3 and 4). PC1 accounts for 58% of overall variance in the outline-based morphospace, and 34% in the landmark-based morphospace. The major element of shape change along PC1, in both spaces, is the development of a distinct and increasingly large ventral crest on the anterior part of the lower jaw, in addition to the overall changes in dorsoventral depth (figures 3c and 4c). Negative PC1 scores represent pterosaurs with slender lower jaws and no exaggerated structures (e.g. Aetodactylus and Quetzalcoatlus) (figures 3a and 4a), while taxa with the greater positive scores on PC1 have more robust jaws with massive ventral crests (e.g. Tupandactylus and Ikrandraco) (figures 3a and 4a). PC2 accounts for a further 16% of overall variance in the outline-based morphospace, and 26% in the landmark-based morphospace. PC2 represents the curvature of the mandible in both spaces (figures 3c and 4c). Mandibles with high positive PC2 scores are highly curved, with the anterior and/or posterior parts dorsally upturned relative to the jaw midpoint, resulting in most of the tooth row falling below the jaw–quadrate articulation. This morphotype is best exemplified by Pterodaustro and Dsungaripterus (figures 3a and 4a). Neutral PC2 scores represent taxa with straight lower jaws, whereas taxa with increasingly negative PC2 scores have jaws where the anterior and/or posterior parts are ventrally downturned relative to the midpoint, often resulting in a tooth row positioned above the jaw–quadrate articulation (e.g. Raeticodactylus).
Figure 3.

Pterosaur lower jaw morphospace based on elliptical Fourier outline analysis. Two-dimensional morphospace plots are based on the first two principal components axes. (a) Distribution of broad taxonomic groups (convex hulls) with numerous mandible shapes illustrated and labelled. (b) Phylomorphospace illustrating branching patterns. (c) Dental guild distributions (convex hulls). Taxonomic groups in (a) and (b) are ‘basal’ non-monofenestratan, Archaeopterodactyloidea, Pteranodontia and Azhdarchoidea. Shape variation along PC1 and PC2 is plotted. Silhouettes are taken from the following sources: ‘basal non-monofenestratan’ from http://phylopic.org by Dmitry Bogdanov, Archaeopterodactyloidea from http://phylopic.org/ by Matthew Martyniuk, Pteranodontia from http://phylopic.org/ by FunkMonk and Azhdarchoidea from Naish et al. [64].
Figure 4.

Pterosaur lower jaw morphospace based on landmark-based morphometric analysis. Two-dimensional morphospace plots are based on the first two principal components axes. (a) Distribution of broad taxonomic groups (convex hulls) with numerous mandible shapes illustrated and labelled. (b) Phylomorphospace illustrating branching patterns. (c) Dental guild distributions (convex hulls). Taxonomic groups in (a) and (b) are ‘basal’ non-monofenestratan, Archaeopterodactyloidea, Pteranodontia and Azhdarchoidea. Shape variation along PC1 and PC2 is plotted. Silhouettes are taken from the following sources: ‘basal non-monofenestratan’ from http://phylopic.org by Dmitry Bogdanov, Archaeopterodactyloidea from http://phylopic.org/ by Matthew Martyniuk, Pteranodontia from http://phylopic.org/ by FunkMonk, and Azhdarchoidea from Naish et al. [64].
Both analytical approaches recover the same major elements of shape change. Mantel tests confirm that the outline and landmark-based analyses quantify very similar morphological information. Comparison of pairwise Euclidean distance matrices derived from both shape datasets reveals a very strong and significant positive correlation (z = 0.9005; p = 0.001). Overall, the outline-based analyses capture morphological variation more succinctly than the landmark-based approach. The first two axes in the outline-based morphospace encapsulate 74% of overall variance, four PC axes are required to reach 90% of overall variance, with six axes needed to reach 95% and 12 axes to reach 99%. In comparison, the PC1–PC2 morphospace in the landmark-based approach encapsulates 60% of overall variance, while nine axes are required to reach 90%, 12 to reach 95% and 22 to incorporate 99%. The outline-based approach places greater emphasis on variation along PC1, while the landmark-based approach places greater weight on PC2. This is reflected by almost identical patterns of morphospace occupation and distribution, but variation in the spacing between taxa (figures 3 and 4).
One of the most striking trends in morphospace occupation is the large-scale overlap of many taxa from different taxonomic groupings in central morphospace (figures 3a and 4a). There is little evidence of discrete group clustering in both spaces. All major groups have divergent representatives that spread out from the central regions to more fully explore morphospace. The Archaeopterodactyloidea are found centrally, with primarily negative PC1 scores and neutral PC2 scores, representing straight and slender jaws. The notable exception is the outlying extreme Pterodaustro. Most pteranodontians are, again, positioned centrally (mainly Anhangueria), however Ikrandraco represents a distinct outlier, plotting close to the tapejarids at the extreme positive end of PC1 with a prominent crest. Pteranodon also falls separately from other, more derived, pteranodontians, and is found at a higher positive position along PC2. The main difference in Azhdarchoidea is between the neoazhdarchians and the tapejarids. Some neoazhdarchians, found in negative PC1 regions, such as Quetzalcoatlus, have slender and straight jaws, whereas the most extreme azhdarchoid morphology is shown by the tapejarids at the extreme positive end of PC1, with massively developed ventral crests. The phylomorphospaces further illustrate high levels of overlap and the clustering of internal nodes and branches (figures 3b and 4b). Only two divergent branching events can be identified. One major divergence is seen in derived tapejarids (Azhdarchoidea) into regions of high positive PC1 scores. The second major excursion is seen in a basal assemblage of non-pterodactyloids into negative PC2 space. Long branches leading to Pterodaustro, Ikrandraco and Raeticodactylus reveal how divergent they are compared with their parent clades and sister taxa (figures 3b and 4b).
Statistical tests for significant group separations reveal mixed results. Overall, pairwise comparisons among groups corroborate the visual inspections of morphospace and do not support discrete separation. Based on the outline analyses, no pairwise comparisons return statistically significant results (Bonferroni-corrected p-values range from 0.125 to 1). The same result is returned if narrower taxonomic divisions are used (Bonferroni-corrected p-values range from 0.051 to 1). Tests for separation in the landmark-based morphospace do return some statistically significant results, when comparing the ‘basal non-monofenestratan’ grouping to the pteranodontians (corrected p = 0.039) and Azhdarchoidea (corrected p < 0.001), and when comparing the pteranodontians to Azhdarchoidea (corrected p = 0.020). The only significant results when using narrower taxonomic subdivisions in the landmark data are found between the tapejarids and Anhangueria (corrected p = 0.011), and Anhangueria and Eudimorphodontidae (corrected p = 0.044).
There is no clear evidence for a strong link between jaw shape and dental morphology. Representatives from all dental guilds converge in central morphospace (figures 3c and 4c). Pterosaurs with recurved conical dentition and pronounced size heterodonty are the most common in our study, and such taxa are mostly positioned centrally, but they do show moderate expansion on both the major axes of variation. Taxa with homodont recurved conical dentition are clustered tightly, with the notable exception of Ikrandraco which is located close to edentulous tapejarids. Edentulous taxa are unexpectedly disparate and have wide morphospace occupation. No single jaw morphotype is characteristic of toothless taxa, and they occupy the extreme positions of positive and negative PC1 (Quetzalcoatlus and Tupandactylus) and positive PC2 (Pteranodon). Pterosaurs which possessed rarer and more specialized dental morphologies, including crushing, shearing, peg-like and multicusped, do not form separate clusters in mandible shape morphospace, but are instead all overlapping and close to taxa with simple recurved cones. Pterodaustro, the only taxon we sample with specialized filter-feeding dentition, is found at the extreme positive of PC2. Statistical tests for differences in morphospace occupation by dental groups return no significant results for the outline data. For the landmark data, significant differences are found between multicusped taxa and both edentulous forms (corrected p = 0.040) and taxa with heterodont and recurved cones (corrected p = 0.017), and between edentulous forms and taxa with heterodont and recurved cones (corrected p = 0.010).
3.2. The relationship between size and shape
Lower jaw size has limited overall control on shape, and the position of taxa in morphospace (figure 5). Multivariate regression tests show there is a significant, but weak, relationship between mandible size and shape based on outline data (p = 0.041, r2 = 0.061) and SLMs (p = 0.002, r2 = 0.082). Size only accounts for 6% of shape variation in the outline data and 8% of variation in the landmark data after Procrustes superimposition. This trend is reinforced by visual inspections of distribution in morphospaces, where taxa of varying size are found distributed widely and frequently overlap (figure 5).
Figure 5.
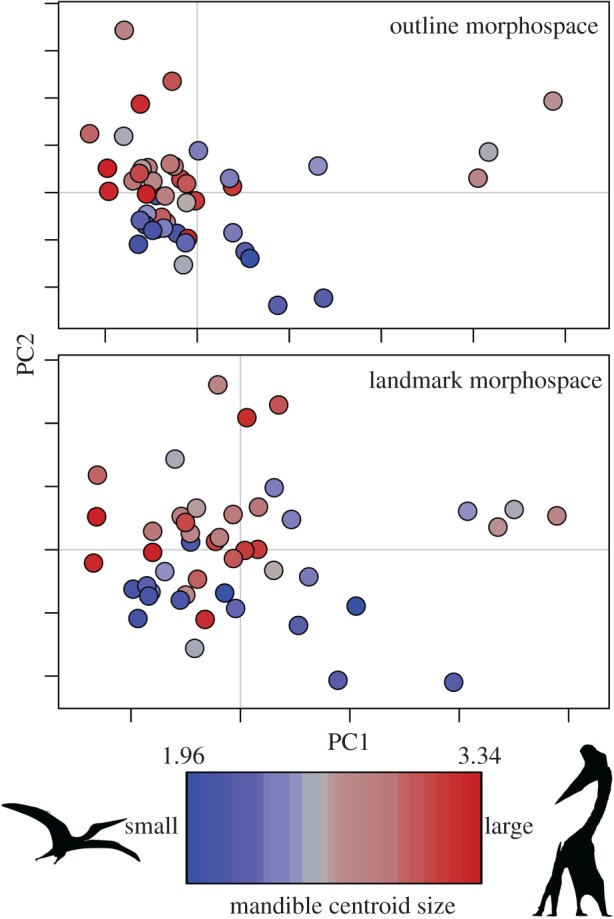
Distribution of lower jaw sizes within shape morphospaces. Pterosaur lower jaw morphospaces from the outline and landmark analyses are presented, with taxa plotted using a colour gradient according to log-transformed mandible centroid size. Left image is from http://phylopic.org by Gareth Monger, and the right image is by Mark Witton.
3.3. Disparity trends
Pterosaur subgroups have unequal mandibular shape disparity (figure 6). The Azhdarchoidea (incorporating tapejaromorphs and neoazhdarchians) have greatest disparity, based on both outline and landmark-based morphospace occupation. The Archaeopterodactyloidea consistently show low disparity. The ‘basal non-monofenestratan’ grouping shows high disparity in calculations based on the landmark-based morphospace (figure 6d), but not in the outline data (figure 6a). Confidence intervals associated with the disparity values consistently overlap. These large confidence intervals likely result from an abundance of outlying forms from each group and low sample sizes. Much of the disparity in Azhdarchoidea is contributed by the tapejarids, which are recovered as the most disparate group when narrower, less inclusive, subgroups are used (figure 6b and e). Most other small subgroups have indistinguishable disparity. Calculations from the landmark-based morphospace scores suggest the Eudimorphodontidae have relatively high disparity, however this is associated with a large confidence envelope resulting from a small sample size (n = 3).
Figure 6.

Mandibular morphological disparity in pterosaur subgroups, using outline data (a–c) and landmark data (d–f). Disparity is based on the sum of variances metric (circle and square symbols), with error bars representing 95% confidence intervals based on 1000 bootstrap replicates. Disparity is calculated for taxonomic groups (a,b,d,e) and dental guilds (c,f). The taxonomic groups used in (a) and (d) are ‘basal’ non-monofenestratan, Archaeopterodactyloidea, Pteranodontia and Azhdarchoidea. In (b) and (e) narrower subdivisions are used, including the groups Eudimorphodontidae, Ctenochasmatoidea, Rhamphorhynchidae, Anhangueridae, Tapejaridae and Neoazhdarchia. Disparity was calculated for the following dental guilds: recurved (all), recurved heterodont, recurved homodont, multicusped, ‘crushing’ and edentulous. Illustrative silhouettes are taken from the following sources: ‘basal non-monofenestratan’ from http://phylopic.org/ by Dmitry Bogdanov, Archaeopterodactyloidea from http://phylopic.org/ by Matthew Martyniuk, Pteranodontia from http://phylopic.org/ by FunkMonk, Azhdarchoidea from Naish et al. [64], Eudimorphodontidae by Corey Ford, Rhamphorhynchidae from http://phylopic.org/ by Dmitry Bogdanov, Ctenochasmatoidea from http://phylopic.org/ by Matthew Martyniuk, Anhangueridae by Nobu Tamura, Tapejaridae by Mark Witton, and Neoazhdarchia by Mark Witton.
Most dental guilds have similar mandibular shape disparity (figure 6c and f). Only edentulous forms consistently show higher disparity, based on both outline and landmark-based morphospace occupation. In the outline-based analyses, the homodont recurved dental group also has higher disparity (figure 6c), but this is associated with a large confidence envelope. This inflated disparity and confidence envelope results from the inclusion of the outlying taxon Ikrandraco. Similarly, in the landmark-morphospace calculations, the multicusped forms show elevated disparity (figure 6f), however this is once again associated with large confidence envelopes due to a small sample size (n = 3).
4. Discussion
Pterosaurs were ecologically diverse, but this study reveals that there is no clear relationship between lower jaw shape and other ecologically relevant characteristics, such as dental morphology and size (figures 3–5). Many pterosaurs, in phylogenetically distant subclades and with diverse diets, conformed to a mandible shape that was elongate, with a dorsoventrally thin dentary, short or absent retroarticular process, and the tooth row at the same level as the jaw joint. Convergence is the overriding trend, with a large degree of overlap in central morphospace, and no discrete clustering (figures 3 and 4). Divergent mandibular morphologies are represented by rare morphological extremes. These results contrast with Zhou et al. [20], who identified partitioning of feeding adaptations and clustering in pterosaur ecomorphospace. This discrepancy may, in part, be due to the large number of dental characters used by Zhou et al. [20]. Of the 34 morphological characters they sampled, 20 relate to dental variation. Therefore, it appears that a clearer ecomorphological signal is present in pterosaur dentition rather than jaw shape.
4.1. Mandibular crests
The development of a large anterior ventral crest represents the major element of mandibular shape disparity in pterosaurs (figures 3 and 4). Elaborate crests are known in several pterosaur lineages and are made up of bone or soft tissue, or a combination of both [65]. We sampled thirteen taxa with ventral crests, including five where the crest is greatly developed (Tapejara, Tupandactylus, Ikrandraco, Caiuajara and Raeticodactylus). Most pterosaurs bearing crests have them on both the skull and mandible, such as Tapejara and Tupandactylus, or the skull only, such as Pteranodon or Nyctosaurus. Ikrandraco is an exception, it only has a mandibular crest. Some hypothesize that a ventral crest on the mandible may have aided in the acquisition of prey by facilitating temporary skimming, where the mandible would be partially immersed and the crest would break the water, while pterosaurs lacking a crest could still engage in skim-feeding due to similarities with the skimming bird Rynchops [66]. However, many others have suggested that skim-feeding would not be possible in pterosaurs due to biomechanical constraints [8,67,68]. It is more commonly believed that the crests (especially cranial crests) were socio-sexual display structures, either being sexually dimorphic structures (e.g. [69,70] or mutually sexually selective features [71]. Cranial crests have been shown to develop in a positively allometric fashion, being larger in individuals presumably at, or reaching, sexual maturity. This has been reported in the tapejarid Caiuajara [72], the pteranodontian Pteranodon [73] and anhanguerids [34]. As cranial crests are linked to socio-sexual selection, it is reasonable to believe that, in the absence of clear biomechanical or functional evidence, mandibular crest development may also be driven by socio-sexual selection [71]. While the effect of cranial crests on aerodynamics has been studied previously [25], this has not been explored in mandibular crests. A mandibular crest would have affected both drag and yaw, but there is currently no evidence that aerodynamics was responsible for morphological innovations in mandibular crests. Therefore, we present evidence that socio-sexual selection was responsible for generating considerable geometric disparity in pterosaur mandibles, perhaps more so than dietary and functional factors.
4.2. Functional signal
There is some functional signal in variation along PC2 in both mandibular morphospaces, with regards to the position of the quadrate–articular joint relative to the occlusal plane (figures 3 and 4). In most pterosaurs, the mandible is a straight beam, and the jaw joint is positioned level with the tooth row. However, there are some basal, non-pterodactyloid, pterosaurs with high negative PC2 scores, representing mandibles where the joint is positioned below the tooth row (e.g. Jianchangnathus, Raeticodactylus and Scaphognathus). Having jaw joints positioned below the tooth row affect the occlusion between the upper and lower teeth [42], and the architecture of the adductor musculature needed to produce rapid jaw closure [11]. Two other functionally distinct morphotypes are positioned at the opposite end of PC2, in regions of high positive PC2 scores. The distinctive ctenochasmatid Pterodaustro had a uniquely curved and scoop-like jaw housing densely packed filament-like teeth, allowing efficient filter-feeding [22]. Also positioned at the positive extreme of PC2 is the dsungaripterid Dsungaripterus, which had a slender and distinctly upturned edentulous mandible tip, potentially used for prey acquisition before the prey was moved to more posteriorly positioned crushing teeth [74].
4.3. Size trends
There is no clear trend of size distributions in pterosaur mandibular morphospace. Statistical tests confirm that there is no overriding allometric pattern. Larger pterosaurs are widely distributed along both major morphospace axes, suggesting that aerodynamic and other functional restrictions did not confine all larger pterosaurs to a small area of overall mandibular morphospace, when compared with small- and medium-sized forms. The evolution of exceptionally large body size in some pterosaurs has been attributed to competition from Cretaceous birds [31], although other evidence suggests this is not the case [75,76]. This body-size expansion was not associated with any major innovations in jaw shape evolution or major shifts in morphospace.
4.4. Morphometric protocols: the use of landmarks and outlines
Our results show that outline and landmark-based morphometric techniques reveal congruent patterns. Similar morphological trends are recovered on the major axes of variation in multivariate morphospace, and in the preordination data. Other researchers have reached similar conclusions in other groups, while some have emphasized that the complexity of the structure may be pivotal [77–80]. We suggest that both methods may be interchangeable in simple biological structures which can be measured in two dimensions. The use of outline-based techniques may be a suitable alternative to a combined landmark and SLM approach when homologous landmarks cannot be accurately identified, or they are very sparse.
4.5. Future directions
Here we identify major shape innovations in pterosaur lower jaw evolution and explore potential drivers and constraints. Future studies may wish to investigate functional trends, to understand ecological partitioning within a biomechanical framework and provide insights into the relationship between ecology, geometry and biomechanical performance (e.g. [81,82]). This would be improved by additional studies of pterosaur jaw musculature, facilitating the use of biomechanical characters and potentially finite-element analysis. Dental microwear analysis also represents a potentially rich source of ecomorphologically relevant data [83–85].
Supplementary Material
Supplementary Material
Supplementary Material
Acknowledgements
The authors thank E. J. Rayfield for assistance with the project and comments on the manuscript, D. Hone for a constructive review and sharing specimen images, and T. Rodrigues for constructive reviewer comments. E.M.-S. thanks C. Mehling (AMNH), R. Schoch (SMNS) and O. Rauhut (BSPG) for assistance with collection visits.
Data accessibility
Supplementary information has been provided as the electronic supplementary material.
Authors' contributions
This study is based on an MSc thesis by C.A.N., originally conceived by T.L.S, E.J. Rayfield and E.M.-S. at the University of Bristol (UK). Jaw images were collected by C.A.N. and E.M.-S. Outlines and landmarks were collected by C.A.N. and analysed by T.L.S. All authors contributed to drafting the manuscript.
Competing interests
We declare we have no competing interests.
Funding
E.M.-S. thanks the Palaeontological Association, the Geological Society of London, NSERC and the Graduate School of the National Oceanography Centre, University of Southampton for funding assistance.
References
- 1.Padian K. 1983. A functional analysis of flying and walking in pterosaurs. Paleobiology 9, 218–239. (doi:10.1017/S009483730000765X) [Google Scholar]
- 2.Prentice KC, Ruta M, Benton MJ. 2011. Evolution of morphological disparity in pterosaurs. J. Syst. Palaeontol. 9, 337–353. (doi:10.1080/14772019.2011.565081) [Google Scholar]
- 3.Lockley MG, Wright JL. 2003. Pterosaur swim tracks and other ichnological evidence of behaviour and ecology. Geol. Soc. London Spec. Publ. 217, 297–313. (doi:10.1144/GSL.SP.2003.217.01.18) [Google Scholar]
- 4.Lü J, Unwin DM, Jin X, Liu Y, Ji Q. 2009. Evidence for modular evolution in a long-tailed pterosaur with a pterodactyloid skull. Proc. R. Soc. B 277, 383–389. (doi:10.1098/rspb.2009.1603) [DOI] [PMC free article] [PubMed] [Google Scholar]
- 5.Wang X, Kellner AWA, Zhou Z, Campos DA. 2008. Discovery of a rare arboreal forest-dwelling flying reptile (Pterosauria, Pterodactyloidea) from China. Proc. Natl Acad. Sci. USA 105, 1983–1987. (doi:10.1073/pnas.0707728105) [DOI] [PMC free article] [PubMed] [Google Scholar]
- 6.Unwin DM, Bakhurina NN. 2000. Pterosaurs from Russia, middle Asia and Mongolia. In The age of dinosaurs in Russia and Mongolia (eds Benton MJ, Shishkin MA, Unwin DM, Kurochkin EN), pp. 420–433. Cambridge, UK: Cambridge University Press. [Google Scholar]
- 7.Witton M. 2007. Titans of the skies: azhdarchid pterosaurs. Geol. Today 23, 33–38. (doi:10.1111/j.1365-2451.2007.00596.x) [Google Scholar]
- 8.Witton MP, Naish D. 2008. A reappraisal of azhdarchid pterosaur functional morphology and paleoecology. PLoS ONE 3, e2271 (doi:10.1371/journal.pone.0002271) [DOI] [PMC free article] [PubMed] [Google Scholar]
- 9.Vullo R, Marugán-Lobón J, Kellner AW, Buscalioni AD, Gomez B, De La Fuente M, Moratalla JJ. 2012. A new crested pterosaur from the Early Cretaceous of Spain: the first European tapejarid (Pterodactyloidea: Azhdarchoidea). PLoS ONE 7, e38900 (doi:10.1371/journal.pone.0038900) [DOI] [PMC free article] [PubMed] [Google Scholar]
- 10.Unwin DM. 2005. The pterosaurs: from deep time. New York, NY: Pi Press. [Google Scholar]
- 11.Õsi A. 2011. Feeding-related characters in basal pterosaurs: implications for jaw mechanism, dental function and diet. Lethaia 44, 136–152. (doi:10.1111/j.1502-3931.2010.00230.x) [Google Scholar]
- 12.Witton MP. 2018. Pterosaurs in Mesozoic food webs: a review of fossil evidence. Geol. Soc. Spec. Publ. 455, 7–23. (doi:10.1144/SP455.3) [Google Scholar]
- 13.Anderson PSL. 2008. Shape variation between arthrodire morphotypes indicates possible feeding niches. J. Vertebr. Paleontol. 28, 961–969. (doi:10.1671/0272-4634-28.4.961) [Google Scholar]
- 14.Nogueira MR, Peracchi AL, Monteiro LR. 2009. Morphological correlates of bite force and diet in the skull and mandible of phyllostomid bats . Funct. Ecol. 23, 715–723. (doi:10.1111/j.1365-2435.2009.01549.x) [Google Scholar]
- 15.Monteiro LR, Nogueira MR. 2010. Adaptive radiations, ecological specialization, and the evolutionary integration of complex morphological structures. Evolution 64, 724–744. (doi:10.1111/j.1558-5646.2009.00857.x) [DOI] [PubMed] [Google Scholar]
- 16.Walmsley CW, Smits PD, Quayle MR, McCurry MR, Richards HS, Oldfield CC, Wroe S, Clausen PD, McHenry CR. 2013. Why the long face? The mechanics of mandibular symphysis proportions in crocodiles. PLoS ONE 8, e53873 (doi:10.1371/journal.pone.0053873) [DOI] [PMC free article] [PubMed] [Google Scholar]
- 17.Grossnickle DM, Polly P. 2013. Mammal disparity decreases during the Cretaceous angiosperm radiation. Proc. R. Soc. B 280, 20132110 (doi:10.1098/rspb.2013.2110) [DOI] [PMC free article] [PubMed] [Google Scholar]
- 18.MacLaren JA, Anderson PSL, Barret PM, Rayfield EJ. 2016. Herbivorous dinosaur jaw disparity and its relationship to extrinsic evolutionary drivers. Paleobiology 43, 15–33. (doi:10.1017/pab.2016.31) [DOI] [PMC free article] [PubMed] [Google Scholar]
- 19.Knell RJ, Naish D, Tomkins JL, Hone DWE. 2013. Sexual selection in prehistoric animals: detection and implications. Trends Ecol. Evol. 28, 38–47. (doi:10.1016/j.tree.2012.07.015) [DOI] [PubMed] [Google Scholar]
- 20.Zhou CF, Gao KQ, Yi H, Xue J, Li Q, Fox RC. 2017. Earliest filter-feeding pterosaur from the Jurassic of China and ecological evolution of Pterodactyloidea. R. Soc. open sci. 4, 160672 (doi:10.1098/rsos.160672) [DOI] [PMC free article] [PubMed] [Google Scholar]
- 21.Witton MP. 2013. Pterosaurs: natural history, evolution, anatomy. Princeton, NJ: Princeton University Press. [Google Scholar]
- 22.Bonaparte JF. 1970. Pterodaustro guinazui gen. et sp. nov. Pterosaurio de la Formación Lagarcito, Provincia de San Luis, Argentina y su significado en la geología regional (Pterodactylidae). Acta Geol. Lill. 10, 207–226. [Google Scholar]
- 23.Bennett SC. 2013. The morphology and taxonomy of the pterosaur Cycnorhamphus. Neues Jahrb. Geol. Paläontol. Abh. 267, 23–41. (doi:10.1127/0077-7749/2012/0295) [Google Scholar]
- 24.Padian K. 1985. The origins and aerodynamics of flight in extinct vertebrates. Palaeontology 28, 413–433. [Google Scholar]
- 25.Elgin RA, Grau CA, Palmer C, Hone DW, Greenwell D, Benton MJ. 2008. Aerodynamic characters of the cranial crest in Pteranodon. Zitteliana B 28, 167–174. [Google Scholar]
- 26.Palmer C. 2011. Flight in slow motion: aerodynamics of the pterosaur wing. Proc. R. Soc. B 278, 1881–1885. (doi:10.1098/rspb.2010.2179) [DOI] [PMC free article] [PubMed] [Google Scholar]
- 27.Hone D, Henderson DM, Therrien F, Habib MB. 2015. A specimen of Rhamphorhynchus with soft tissue preservation, stomach contents and a putative coprolite. PeerJ. 3, e1191 (doi:10.7717/peerj.1191) [DOI] [PMC free article] [PubMed] [Google Scholar]
- 28.Henderson DM. 2010. Pterosaur body mass estimates from three-dimensional mathematical slicing. J. Vertebr. Paleontol. 30, 768–785. (doi:10.1080/02724631003758334) [Google Scholar]
- 29.Witton MP, Habib MB. 2010. On the size and flight diversity of giant pterosaurs, the use of birds as pterosaur analogues and comments on pterosaur flightlessness . PLoS ONE 5, e13982 (doi:10.1371/journal.pone.0013982) [DOI] [PMC free article] [PubMed] [Google Scholar]
- 30.Martin EG, Palmer C. 2014. Air space proportion in pterosaur limb bones using computed tomography and its implications for previous estimates of pneumaticity. PLoS ONE 9, e97159 (doi:10.1371/journal.pone.0097159) [DOI] [PMC free article] [PubMed] [Google Scholar]
- 31.Benson RB, Frigot RA, Goswami A, Andres B, Butler RJ. 2014. Competition and constraint drove Cope's rule in the evolution of giant flying reptiles . Nat. Commun. 5, 3567 (doi:10.1038/ncomms4567) [DOI] [PMC free article] [PubMed] [Google Scholar]
- 32.Mitteroecker P, Gunz P, Windhager S, Schaefer K. 2013. A brief review of shape, form, and allometry in geometric morphometrics, with applications to human facial morphology . Hystrix 24, 59–66. [Google Scholar]
- 33.Bright JA, Marugán-Lobón J, Cobb SN, Rayfield EJ. 2016. The shapes of bird beaks are highly controlled by nondietary factors. Proc. Natl Acad. Sci. USA 113, 5352–5357. (doi:10.1073/pnas.1602683113) [DOI] [PMC free article] [PubMed] [Google Scholar]
- 34.Pinheiro FL, Rodrigues T. 2017. Anhanguera taxonomy revisited: is our understanding of Santana Group pterosaur diversity biased by poor biological and stratigraphic control? PeerJ 5, e3285 (doi:10.7717/peerj.3285) [DOI] [PMC free article] [PubMed] [Google Scholar]
- 35.Stubbs TL, Pierce SE, Rayfield EJ, Anderson PS. 2013. Morphological and biomechanical disparity of crocodile-line archosaurs following the end-Triassic extinction. Proc. R. Soc. B 280, 20131940 (doi:10.1098/rspb.2013.1940) [DOI] [PMC free article] [PubMed] [Google Scholar]
- 36.Lautenschlager S. 2014. Morphological and functional diversity in therizinosaur claws and the implications for theropod claw evolution . Proc. R. Soc. B 281, 20140497 (doi:10.1098/rspb.2014.0497) [DOI] [PMC free article] [PubMed] [Google Scholar]
- 37.Anderson PSL, Friedman M, Brazeau MD, Rayfield EJ. 2011. Initial radiation of jaws demonstrated stability despite faunal and environmental change. Nature 476, 206–209. (doi:10.1038/nature10207) [DOI] [PubMed] [Google Scholar]
- 38.Stubbs TL, Benton MJ. 2016. Ecomorphological diversifications of Mesozoic marine reptiles: the roles of ecological opportunity and extinction. Paleobiology 42, 547–573. (doi:10.1017/pab.2016.15) [Google Scholar]
- 39.Ruta M, Botha-Brink J, Mitchell SA, Benton MJ. 2013. The radiation of cynodonts and the ground plan of mammalian morphological diversity . Proc. R. Soc. B 280, 20131865 (doi:10.1098/rspb.2013.1865) [DOI] [PMC free article] [PubMed] [Google Scholar]
- 40.Lloyd GT. 2016. Estimating morphological diversity and tempo with discrete character-taxon matrices: implementation, challenges, progress, and future directions. Biol. J. Linn. Soc. 118, 131–151. (doi:10.1111/bij.12746) [Google Scholar]
- 41.Foth C, Brusatte SL, Butler RJ. 2012. Do different disparity proxies converge on a common signal? Insights from the cranial morphometrics and evolutionary history of Pterosauria (Diapsida: Archosauria). J. Evol. Biol. 25, 904–915. (doi:10.1111/j.1420-9101.2012.02479.x) [DOI] [PubMed] [Google Scholar]
- 42.Anderson PS. 2009. Biomechanics, functional patterns, and disparity in Late Devonian arthrodires . Paleobiology 35, 321–342. (doi:10.1666/0094-8373-35.3.321) [Google Scholar]
- 43.Anderson PS, Friedman M, Ruta M. 2013. Late to the table: diversification of tetrapod mandibular biomechanics lagged behind the evolution of terrestriality. Integr. Comp. Biol. 53, 197–208. (doi:10.1093/icb/ict006) [DOI] [PubMed] [Google Scholar]
- 44.Andres B, Myers TS. 2013. Lone star pterosaurs. Earth Env. Sci. T. R. Soc. 103, 383–398. [Google Scholar]
- 45.Andres B, Clark J, Xu X. 2014. The earliest pterodactyloid and the origin of the group. Curr. Biol. 24, 1011–1016. (doi:10.1016/j.cub.2014.03.030) [DOI] [PubMed] [Google Scholar]
- 46.Mitteroecker P, Gunz P. 2009. Advances in geometric morphometrics. Evol. Biol. 36, 235–247. (doi:10.1007/s11692-009-9055-x) [Google Scholar]
- 47.Bonhomme V, Picq S, Gaucherel C, Claude J. 2014. Momocs: outline analysis using R. J. Stat. Softw. 56, 1–24. (doi:10.18637/jss.v056.i13) [Google Scholar]
- 48.Rohlf FJ. 2006. TPS software series. Department of Ecology and Evolution, State University of New York See http://life.bio.sunysb.edu/morph/.
- 49.Gunz P, Mitteroecker P. 2013. Semilandmarks: a method for quantifying curves and surfaces . Hystrix 24, 103–109. [Google Scholar]
- 50.Hammer Ø, Harper DAT, Ryan PD. 2001. PAST: paleontological statistics software package for education and data analysis. Palaeontol. Electron. 4, 9. [Google Scholar]
- 51.Adams DC, Otárola-Castill E. 2013. Geomorph: an R package for the collection and analysis of geometric morphometric shape data. Methods Ecol. Evol. 4, 393–399. (doi:10.1111/2041-210X.12035) [Google Scholar]
- 52.Dray S, Dufour AB. 2007. The ade4 package: implementing the duality diagram for ecologists. J. Stat. Softw. 22, 1–20. (doi:10.18637/jss.v022.i04) [Google Scholar]
- 53.Oksanen J. et al. 2016. vegan: Community ecology package. R package version 2.3-5.
- 54.Unwin DM. 2003. On the phylogeny and evolutionary history of pterosaurs. Geol. Soc. Spec. Publ. 217, 139–190. (doi:10.1144/GSL.SP.2003.217.01.11) [Google Scholar]
- 55.Kellner AW. 2003. Pterosaur phylogeny and comments on the evolutionary history of the group. Geol. Soc. Spec. Publ. 217, 105–137. (doi:10.1144/GSL.SP.2003.217.01.10) [Google Scholar]
- 56.Tischlinger H, Frey E. 2014. Ein neuer Pterosaurier mit Mosaikmerkmalen basaler und pterodactyloider Pterosauria aus dem Ober-Kimmeridgium von Painten (Oberpfalz, Deutschland). Archaeopteryx 31, 1–14. [Google Scholar]
- 57.Brusatte SL, Benton MJ, Ruta M, Lloyd GT. 2008. The first 50 Myr of dinosaur evolution: macroevolutionary pattern and morphological disparity. Biol. Lett. 4, 733–736. (doi:10.1098/rsbl.2008.0441) [DOI] [PMC free article] [PubMed] [Google Scholar]
- 58.Bapst DW. 2012. paleotree: an R package for paleontological and phylogenetic analyses of evolution. Methods Ecol. Evol. 3, 803–807. (doi:10.1111/j.2041-210X.2012.00223.x) [Google Scholar]
- 59.Gradstein FM, Ogg JG, Schmitz M, Ogg G. 2012. The geologic time scale 2012. Oxford, UK: Elsevier. [Google Scholar]
- 60.Revell LJ. 2012. phytools: an R package for phylogenetic comparative biology (and other things). Methods Ecol. Evol. 3, 217–223. (doi:10.1111/j.2041-210X.2011.00169.x) [Google Scholar]
- 61.Rohlf FJ. 2008. TPSRelw version 1.46 Department of Ecology and Evolution, State University of New York; See http://life.bio.sunysb.edu/morph/. [Google Scholar]
- 62.Navarro N. 2003. MDA: a MATLAB-based program for morphospace-disparity analysis. Comput. Geosci. 29, 655–664. (doi:10.1016/S0098-3004(03)00043-8) [Google Scholar]
- 63.R Development Core Team. 2011. R: A language and environment for statistical computing. Vienna, Austria: R Foundation for Statistical Computing. [Google Scholar]
- 64.Naish D, Simpson M, Dyke G. 2013. A new small-bodied azhdarchoid pterosaur from the Lower Cretaceous of England and its implications for pterosaur anatomy, diversity and phylogeny. PLoS ONE 8, e58451 (doi:10.1371/journal.pone.0058451) [DOI] [PMC free article] [PubMed] [Google Scholar]
- 65.Wang X, Rodrigues T, Jiang S, Cheng X, Kellner AW. 2014. An Early Cretaceous pterosaur with an unusual mandibular crest from China and a potential novel feeding strategy. Sci. Rep. 4, 6329 (doi:10.1038/srep06329) [DOI] [PMC free article] [PubMed] [Google Scholar]
- 66.Kellner AW, Campos DA. 2002. The function of the cranial crest and jaws of a unique pterosaur from the Early Cretaceous of Brazil. Science 297, 389–392. (doi:10.1126/science.1073186) [DOI] [PubMed] [Google Scholar]
- 67.Humphries S, Bonser RH, Witton MP, Martill DM. 2007. Did pterosaurs feed by skimming? Physical modelling and anatomical evaluation of an unusual feeding method. PLoS Biol. 8, e204 (doi:10.1371/journal.pbio.0050204) [DOI] [PMC free article] [PubMed] [Google Scholar]
- 68.Witton MP, Naish D. 2013. Azhdarchid pterosaurs: water-trawling pelican mimics or ‘terrestrial stalkers'? Acta Palaeontol. Pol. 60, 651–660. [Google Scholar]
- 69.Bennett SC. 1992. Sexual dimorphism of Pteranodon and other pterosaurs, with comments on cranial crests. J. Vertebr. Paleontol. 12, 422–434. (doi:10.1080/02724634.1992.10011472) [Google Scholar]
- 70.Lü J, Unwin DM, Deeming DC, Jin X, Liu Y, Ji Q. 2011. An egg–adult association, gender, and reproduction in pterosaurs. Science 331, 321–324. (doi:10.1126/science.1197323) [DOI] [PubMed] [Google Scholar]
- 71.Hone DW, Naish D, Cuthill IC. 2012. Does mutual sexual selection explain the evolution of head crests in pterosaurs and dinosaurs? Lethaia 45, 139–156. (doi:10.1111/j.1502-3931.2011.00300.x) [Google Scholar]
- 72.Manzig PC, et al. 2014. Discovery of a rare pterosaur bone bed in a Cretaceous desert with insights on ontogeny and behavior of flying reptiles. PLoS ONE 9, e100005 (doi:10.1371/journal.pone.0100005) [DOI] [PMC free article] [PubMed] [Google Scholar]
- 73.Tomkins JL, LeBas NR, Witton MP, Martill DM, Humphries S. 2010. Positive allometry and the prehistory of sexual selection. Am. Nat. 176, 141–148. (doi:10.1086/653001) [DOI] [PubMed] [Google Scholar]
- 74.Wellnhofer P. 1991. The illustrated encyclopaedia of pterosaurs. London: Salamander. [Google Scholar]
- 75.Martin-Silverstone E, Witton MP, Arbour VM, Currie PJ. 2016. A small azhdarchoid pterosaur from the latest Cretaceous, the age of flying giants. R. Soc. open sci. 3, 160333 (doi:10.1098/rsos.160333) [DOI] [PMC free article] [PubMed] [Google Scholar]
- 76.Chan NR. 2017. Morphospaces of functionally analogous traits show ecological separation between birds and pterosaurs. Proc. R. Soc. B 284, 20171556 (doi:10.1098/rspb.2017.1556) [DOI] [PMC free article] [PubMed] [Google Scholar]
- 77.MacLeod N. 2015. Use of landmark and outline morphometrics to investigate thecal form variation in crushed gogiid echinoderms. Palaeoworld 24, 408–429. (doi:10.1016/j.palwor.2015.07.004) [Google Scholar]
- 78.Dujardin JP, Kaba D, Solano P, Dupraz M, McCoy KD, Jaramillo-O N. 2014. Outline-based morphometrics, an overlooked method in arthropod studies? Infect. Genet. Evol. 28, 704–714. (doi:10.1016/j.meegid.2014.07.035) [DOI] [PubMed] [Google Scholar]
- 79.Jensen RJ, Ciofani KM, Miramontes LC. 2002. Lines, outlines, and landmarks: morphometric analyses of leaves of Acer rubrum, Acer saccharinum (Aceraceae) and their hybrid. Taxon 51, 475–492. (doi:10.2307/1554860) [Google Scholar]
- 80.Van Bocxlaer B, Schultheiß R. 2010. Comparison of morphometric techniques for shapes with few homologous landmarks based on machine-learning approaches to biological discrimination. Paleobiology 36, 497–515. (doi:10.1666/08068.1) [Google Scholar]
- 81.Button DJ, Rayfield EJ, Barrett PM. 2014. Cranial biomechanics underpins high sauropod diversity in resource-poor environments. Proc. R. Soc. B 281, 20142114 (doi:10.1098/rspb.2014.2114) [DOI] [PMC free article] [PubMed] [Google Scholar]
- 82.Lautenschlager S, Brassey CA, Button DJ, Barrett PM. 2016. Decoupled form and function in disparate herbivorous dinosaur clades. Sci. Rep. 6, 26495 (doi:10.1038/srep26495) [DOI] [PMC free article] [PubMed] [Google Scholar]
- 83.Fiorillo AR. 1998. Dental micro wear patterns of the sauropod dinosaurs Camarasaurus and Diplodocus: evidence for resource partitioning in the Late Jurassic of North America. Hist. Biol. 13, 1–16. (doi:10.1080/08912969809386568) [Google Scholar]
- 84.Williams VS, Barrett PM, Purnell MA. 2009. Quantitative analysis of dental microwear in hadrosaurid dinosaurs, and the implications for hypotheses of jaw mechanics and feeding. Proc. Natl Acad. Sci. USA 106, 11 194–11 199. (doi:10.1073/pnas.0812631106) [DOI] [PMC free article] [PubMed] [Google Scholar]
- 85.Gill PG, Purnell MA, Crumpton N, Brown KR, Gostling NJ, Stampanoni M, Rayfield EJ. 2014. Dietary specializations and diversity in feeding ecology of the earliest stem mammals. Nature 512, 303–305. (doi:10.1038/nature13622) [DOI] [PubMed] [Google Scholar]
Associated Data
This section collects any data citations, data availability statements, or supplementary materials included in this article.
Supplementary Materials
Data Availability Statement
Supplementary information has been provided as the electronic supplementary material.