

Abstract
We have interrogated the isothermal folding behavior of the DNA i-motif of the human telomere, dC19, and a high-stability i-motif-forming sequence in the promoter of the human DNA repair gene RAD17 using human physiological solution and temperature conditions. We developed a circular-dichroism-spectroscopy-based pH titration method that is followed by analysis of titration curves in the derivative domain and found that the observed pH-dependent folding behavior can be significantly different and, in some cases, multiphasic, with a dependence on how rapidly i-motif folding is induced. Interestingly, the human telomere sequence exhibits unusual isothermal hysteresis in which the unfolding process always occurs at a higher pH than the folding process. For the RAD17 i-motif, rapid folding by injection into a low-pH solution results in triphasic unfolding behavior that is completely diminished when samples are slowly folded in a stepwise manner via pH titration. Chemical footprinting of the RAD17 sequence and pH titrations of dT-substituted mutants of the RAD17 sequence were used to develop a model of RAD17 folding and unfolding. These results may provide valuable information pertinent to i-motif use in sensors and materials, as well as insight into the potential biological activity of i-motif-forming sequences under stepwise or instantaneous changes in pH.
Introduction
The DNA i-motif is a noncanonical tetraplex structure typically formed under conditions of low pH (1, 2) in sequences with proximal homopolymer tracks of 2′-deoxycytidine (dC). Currently, research involving DNA i-motif structures ranges from gene regulation (3, 4, 5) to smart sensors, DNA switches, and nanoparticle assembly techniques (6, 7). A commonality in i-motif relevance and/or utility for any field relies heavily on the pH-dependent folding and unfolding behavior of i-motif-forming sequences and the conditions that influence it. Intrinsic factors that affect folding behavior are the length of the oligodeoxynucleotide (8), the length and number of the poly-dC tracks (9), and the length and nucleotide composition of intervening, non-poly-dC tracks (10, 11, 12, 13). Extrinsic factors influencing i-motif structural transitions include salt concentration and identity (1, 14, 15, 16), temperature (11, 17), and molecular crowding (18, 19, 20).
The aforementioned factors generate a complex set of experimental variables that one must consider when characterizing i-motif-forming sequences in vitro. Physiological salt and buffer conditions are typically mimicked for investigations into the folding behavior and structure of biologically pertinent sequences, whereas alternative conditions may be used for other applications. For any new i-motif-forming sequence, however, the focus first centers on a parameter called the transition pH (pHT), defined as the pH at a given temperature at which 50% of the oligodeoxynucleotide resides in the intramolecularly folded state.
Evaluating the pHT for a potential i-motif-forming DNA sequence is usually performed using ultraviolet (UV), circular dichroism (CD), or NMR spectroscopy (21, 22, 23). In a typical experiment, the spectrum of a set of isothermally equilibrated sample solutions, each at a unique pH value, are recorded. The absorbance (UV) or ellipticity (CD) of the samples at a characteristic wavelength maximum, ∼260 nm in the UV spectrum and ∼285 nm in the CD spectrum, or the intensity of a characteristic chemical shift in the NMR spectrum are then collected for each sample at each pH. Absorbance or rotation values may then be normalized and fit to a sigmoid equation model, directly fit to a sigmoid equation model, or interpolated with a spline curve to determine the pHT value. These approaches give a steady-state transition curve that is rapidly obtained and can be easily used to compare the pH-dependent stability of a set of sequences of interest.
Though useful for surveys of potential i-motif-forming sequences, typical sampling pH intervals are too wide to provide a complete picture of i-motif folding behavior under pertinent condition changes such as one-directional decreases or increases in solution pH, especially when the rate of pH change varies. Examination of the detailed folding and unfolding structural transitions of i-motif forming sequences can, as we have found, reveal unusual multiphasic structural transition behavior. For any applications in which the i-motif is the primary sensing element, multiphasic structural transition behavior could be exploited to give highly specific information about environmental changes within narrow pH ranges. Further, knowledge of hysteresis in i-motif structural transitions under various conditional constraints can be used to enhance the accuracy of i-motif sensors. This is of particular interest for applications of i-motif forming oligodeoxynucleotides in cellular environments, such as those developed by Modi et al. for DNA nanomachines employed to sense pH changes in living cells (24, 25).
Biomolecular folding behavior and conformational states can be interrogated by a variety of experimental techniques such as NMR spectroscopy, Förster resonance energy transfer, and x-ray crystallography, but each has pitfalls compared to CD spectroscopy. NMR utilizes high oligodeoxynucleotide concentrations, well above what is physiologically relevant, which could alter the equilibrated state or structure of folded conformations. Förster resonance energy transfer employs the use of oligodeoxynucleotides covalently modified with large, hydrophobic dyes, which result in a nonnative biomolecule, and x-ray crystallography does not allow the conclusive determination of solution phase structure or the interrogation of structural transitions. In comparison, CD spectroscopy is a simple and widely available solution phase technique that enables the use of physiological conditions and low oligodeoxynucleotide concentrations and requires no structural modification to the biomolecule.
Here, the folding and unfolding spectroscopic characteristics of several DNA i-motifs are presented. We demonstrate a thorough method of interrogating i-motif folding behavior using CD spectroscopy, which is advantageous over other techniques such as NMR spectroscopy, and show that i-motif-forming oligodeoxynucleotides behave differently depending on how a sample is folded or unfolded. We applied this technique to the human telomere sequence, to what we believe is a new i-motif-forming sequence found in the promoter of the human gene RAD17 (26), and to dC19. The sequence of the RAD17 i-motif is very similar to the recently discovered dC19 i-motif (8), for which the dC-rich core of the sequence differs by only one 2′-deoxyguanosine (dG) nucleotide located precisely in the center of the dC19 track. All oligodeoxynucleotides studied exhibit unique multiphasic unfolding behavior that depends on how the pH changes, and, in the case of the RAD17 promoter sequence, shows a stable conformation at pH ∼7 and human physiological temperature.
Materials and Methods
Oligodeoxynucleotide synthesis and purification
All oligodeoxynucleotides used herein were synthesized using standard phosphoramidite procedures by the DNA synthesis core at the University of Utah. Samples were then treated with 200 mM piperidine for 30 min at 90°C before purification by high performance liquid chromatography using a high pH eluent to prevent i-motif folding on column. Samples were subsequently dialyzed three separate times for 12 h each against ddH2O, lyophilized, resuspended in ddH2O, quantified, and then frozen as concentrated stock solutions until needed for experiments. Molar absorptivity values for all oligodeoxynucleotides studied were determined using the nearest-neighbor method.
pH titrations using CD spectroscopy
Each oligodeoxynucleotide sample was prepared using a buffer composed of 20 mM KPi, 12 mM NaCl, and 140 mM KCl, equilibrated at 37°C. Sample concentrations were on the order of ∼1–3 μM, determined individually by calculating the amount needed to give an absorbance of ∼0.5 at 260 nm in the UV spectrum based on molar absorptivities. The CD spectra were recorded at pH increments of ∼0.1–0.2, using small aliquots of 1 M LiOH to adjust the pH each time, until no further change in the CD spectrum was observed. For increasing pH titrations, LiOH was chosen because 1) it would not significantly affect the physiological concentrations of K+ or Na+ or alter the buffer concentration if used as a concentrated solution, and 2) because it was demonstrated to have little effect on i-motif folding behavior until concentrations above 50 mM are obtained (1, 15). Our experiments typically resulted in a high end Li+ concentration of <10 mM, which might affect the thermal stability by a few degrees, but overall should have a minimal effect on the isothermal pH stability and preserve the desired physiological salt and buffer conditions. Once the sample achieved complete i-motif unfolding, the titration was then reversed using 1 M HCl in the same procedure down to a pH of ∼4.5. These two titrations comprised what we call “titration cycle A.” Over the course of the bidirectional titration, no more than 60 μL total of 1 M LiOH and 1 M HCl was added to the 2000-μL sample, resulting in a volume change of less than 5% in all cases. For completeness, experiments were also conducted by titrating from high to low pH and then back to high pH in the same manner, called “titration cycle B.” All titrations were performed in triplicate, and every spectrum represents a sample equilibrated for ∼90 s after addition of an aliquot of acid or base.
Data analysis for pH titrations
The CD spectra for any given sample were first converted from raw ellipticity, , to molar ellipticity, , by the equation , where is the concentration of the sample based on the absorbance at 260 nm in the UV spectrum and is the path length of the cuvette. The resultant pH-dependent spectra for titration in any given direction of pH change were then analyzed, and the values at the experimentally determined maximum wavelength, ∼285 nm, in the lowest pH spectrum were extracted from each pH-specific spectrum. Each set of values from replicate titrations for each sample were then individually normalized and plotted versus pH, where the normalized values correspond to the folded state population fraction . Standard nonlinear regression analysis was used to mathematically characterize each transition, using global analysis of triplicate data sets according to Eq. 1:
| (1) |
In Eq. 1, is the folded state population (ordinate) at a given pH value (abscissa) and are parameters to be fit via nonlinear regression in MATLAB 2013b (MathWorks, Natick, MA). The residuals were then calculated and plotted versus pH to assess each titration curve for multiphasic behavior, indicated by structure in the residuals.
A second method of analysis was then used to assess, and, if needed, deconvolute and quantify, multiphasic titration curves. To accomplish this, the data used for analysis according to Eq. 1 were converted to the derivative domain. The negative of the slope between each and data point, , within a single replicate data set was calculated and plotted versus the average pH between the pairwise values, . This gives data points for each replicate titration. The triplicate data set for each sample was then combined for a given sample and globally normalized, and then Eq. 2 was used to analyze the pH titration data in the derivative domain:
| (2) |
In the above equation, are parameters to be fit in MATLAB (MathWorks) using nonlinear regression analysis. The number of bell curves used in the fit varies between 1 and 3 in all cases for this work. For each underlying bell curve, the pHT value was redefined as the pH value corresponding to the steepest slope in each underlying transition resulting from the plot of vs. , which differs from the standard definition of pHT. After analysis of the pH titration data according to Eq. 2, the resulting best-fit line was converted back into a normalized sigmoidal form (see Supporting Material) for comparison with the original, normalized triplicate data set.
To assign populations to each peak, integration of each individual bell curve allowed a summation of total area that could then be used to find the structural population giving rise to each transition assigned using deconvolution by Eq. 2. In addition to this information, we provide the relative amplitude, , and the full width at half-maximum (FWHM in pH units) of deconvoluted structural transition peaks found via analysis by Eq. 2. FWHM is related to by the equation . The FWHM is indicative of the level of cooperativity of the transition, similar to previous quantitative work by Nesterova et al. (27) in which smaller values indicate a higher level of cooperativity. An example workflow (Fig. S1), representative pH-dependent CD spectra, and nonlinear regression plots according to Eq. 2 (Figs. S2–S22) and fit statistics (Table S4) are provided in the Supporting Material.
Thermal melting analysis
Triplicate samples were dissolved in 20 mM Britton-Robinson buffer at a predefined pH, and UV spectroscopy was used to monitor heat-induced denaturation. Each solution was equilibrated at 20°C for 5 min and heated in 1°C increments at a rate of 1°C min−1, pausing for 30 s after each 1°C increase in temperature for equilibration, followed by recording the absorbance at 262 nm, to a final temperature of 100°C. The derivative method was then used to analyze the resultant thermal denaturation curves at 262 nm.
Bromine footprinting
The procedure for bromine footprinting is adapted and modified from a procedure described in the literature (28, 29, 30). Briefly, oligodeoxynucleotides were first 5′-radiolabeled with [γ]-32P-ATP using T4 polynucleotide kinase. The bromination reaction conditions were as follows: 2 pmol of radiolabeled oligodeoxynucleotide was added to a 200-μL solution of either 20 mM acetate buffer (pH 5) or 20 mM phosphate buffer (pH 8) containing 4 μM unlabeled oligodeoxynucleotide. All reaction mixtures were spiked with a concentrated stock of KHSO5 to give 240 μM final concentration. To non-control lanes, a concentrated stock of KBr was added to give a final concentration of 240 μM. The reactions, including controls that lacked a bromine source, were allowed to proceed for 30 min at room temperature. All samples were subsequently quenched with the addition of 2 μL of 200 mM HEPES buffer. The samples were then dialyzed three times for 12 h each against ddH2O, lyophilized, and then resuspended in a 1 M piperidine solution. The piperidine reaction was carried out at 90°C for 45 min. Piperidine-treated samples were then dialyzed three times for 12 h each against ddH2O, lyophilized several times by refilling the sample Eppendorf tubes with ddH2O each time to ensure piperidine removal, and then analyzed by denaturing polyacrylamide gel electrophoresis at 20% 19:1 acrylamide:bisacrylamide. The results of the bromine footprinting reaction were imaged using storage phosphor autoradiography, and intensity profiles were used to assign the base-pairing environment of each fragment band, indicative of loop or core locations within the i-motif structure.
Isothermal difference spectroscopy
During CD spectroscopy experiments, the UV spectrum was recorded concurrently with each CD spectrum. The UV spectra for the lowest and highest pH scans were subtracted from one another, giving the isothermal difference spectra (IDS). The results of this approach are identical to those obtained via the thermal method described by Mergny et al. (17) and are characteristic of the protonation state of 2′-deoxycytosine residues. IDS are contained in the Figs. S2–S22, (B) for all oligodeoxynucleotides studied.
Results and Discussion
Oligodeoxynucleotide sequences
Table 1 shows the oligodeoxynucleotide sequences used in this study. hTeloC is the human telomere sequence and dC19 is the most pH-stable poly-dC sequence, recently identified by Fleming et al. (8). All sequences derived from the gene promoter of RAD17 are denoted “R17” and include, if necessary, appended core poly-dC track length designations. Each sequence except dC19 contains three nucleotide tails derived from the wild-type sequence except for T5-R17, which includes a 5′-appended dT5 sequence used to enhance the results of the bromine footprinting structure assay. Tails were included to assay to a greater extent the behavior of an i-motif, in the context of surrounding nucleotides proximal to the core sequence itself, that could promote or inhibit i-motif stability. The UV molar absorptivities at 260 nm (ε260) are included in Table 1.
Table 1.
Oligodeoxynucleotide Sequences Studied and Their UV Molar Extinction Coefficients at 260 nm
| Name | Sequence | ε260 (L μM−1 cm−1) |
|---|---|---|
| hTeloC | 5′-TAACCCTAACCCTAACCCTAACCCTAA | 0.2542 |
| dC19 | 5′-CCCCCCCCCCCCCCCCCCC | 0.1370 |
| R17 | 5′-CCACCCCCCCCCGCCCCCCCCCGGA | 0.2005 |
| R17-4444 | 5′-CCACCCCTCCCCGCCCCTCCCCGGA | 0.2080 |
| R17-3434 | 5′-CCACCCTCCCCTGTCCCTCCCCGGA | 0.2053 |
| R17-3443 | 5′-CCACCCTCCCCTGTCCCCTCCCGGA | 0.2053 |
| R17-4334 | 5′-CCACCCCTCCCTGTCCCTCCCCGGA | 0.2053 |
| R17-4343 | 5′-CCACCCCTCCCTGTCCCCTCCCGGA | 0.2053 |
| R17-3333 | 5′-CCACCCTTCCCTGTCCCTTCCCGGA | 0.2071 |
| T5-R17a | 5′-TTTTTCCACCCCCCCCCGCCCCCCCCCGGA | 0.2280 |
T5-R17 was primarily designed for bromine footprinting use only, but pH titrations were carried out to ensure perturbations in folding compared with R17 were minimal (Fig. S18).
pH titrations of the human telomere i-motif
We first set out to characterize the pH-dependent folding and unfolding characteristics of the canonical i-motif sequence, hTeloC, under physiological solution and temperature conditions (37°C). This set of control experiments was used to test our pH titration methodology, primarily developed to assess the isothermal pH stability when the pH of a sample solution changes in one direction. The hTeloC i-motif was subject to two cycles of titration. Cycle A was performed by injecting a stock solution of oligodeoxynucleotide (stock pH ≈ 7.8) into a pH 4.5 solution, equilibrating the sample for ∼30 min, titrating to high pH, and then titrating back to low pH. Cycle B was performed by injecting a stock solution of oligodeoxynucleotide into a pH 8 solution, titrating to low pH, and then titrating back to high pH. Pertinent transition pH values, fit parameters, and population percentages are given in Table S1.
Fig. 1 A shows the results of cycle A: when hTeloC was injected into a pH 4.5 solution and aliquots of LiOH were added in a stepwise manner, slow unfolding occurred in a biphasic fashion (inset 1). Titrating the same samples back toward low pH with small aliquots of HCl resulted in a monophasic transition (inset 2). Fig. 1 B shows the results of cycle B, in which, starting at high pH, slow folding was monophasic (inset 2), but titration back to high pH was also monophasic, yet shifted to slightly higher pH (inset 1). Analysis via Eq. 2 shows that hTeloC exhibits a biphasic unfolding transition for samples injected into a low-pH solution during cycle A. Integration of the overlapping bell curve peaks (Fig. 1 A; inset 1) gave relative populations of ∼13% (pHT,1) and ∼87% (Table S1, pHT,2), the former being lower in cooperativity than the latter, indicated by the low amplitude (0.19) and relatively large FWHM (0.47) in the vs. pH plot.
Figure 1.

hTeloC pH titration cycles recorded ∼287 nm in the CD spectrum (see Table S4 for exact values). Increasing pH titrations are black, and decreasing pH titrations are red. (A) This panel shows cycle A with increasing pH (inset 1), then decreasing pH (inset 2). (B) This panel shows cycle B with decreasing pH (inset 2), then increasing pH (inset 1). Insets are plots according to Eq. 2 for each directional pH titration. Table S1 contains fit parameters, structural populations (for multiphasic curves), and sample concentrations. Table S4 contains pertinent statistics information for each fit. The (∗) indicates the starting pH for each cycle. To see this figure in color, go online.
Possibilities for the cause of the biphasic unfolding titration curve (Fig. 1 A, inset 1) include multiple conformational topologies or dimer formation. In 2012, Lieblein et al. showed for the human telomere sequence d((C3TA2)3C3) that pH jumps from 9 to 6 can result in kinetic partitioning, giving rise to the formation of a 1:3 population distribution of 3′E to 5′E conformations, respectively, at ∼2°C (13, 31). At ∼15°C, the ratio shifts to 1:4, and at ∼35°C, the 3′E conformation was no longer detectable. Our experiments were conducted at 37°C, and therefore it is unlikely that conformational topology is the cause of the observed biphasic unfolding for samples subject to a sharp pH decrease from the stock solution environment to pH ∼4.5.
In 2013, Wu et al. used analytical ultracentrifugation to interrogate the effect of pH jumps on the formation of intramolecular structures of the human telomere i-motif sequence d((C3TA2)3C3 (32). They found that the human telomere i-motif is prone to forming intermolecular dimers (∼18%) at concentrations as low as 2 μM when subject to a pH jump from 7.5 to 4.5 at 20°C. Oligodeoxynucleotide concentrations in our experiments here were ∼1.8 μM, though the temperature of our experiments was 37°C. Further, Wu et al. showed that the dimer is less stable than the intramolecular i-motif, which our experiments also confirm, assuming dimer dissociation is what we observe in the lowest-pH, low-cooperativity transition in Fig. 1 A, inset 1.
Monophasic unfolding of hTeloC, after being folded via titration from high pH to low pH during cycle B (Fig. 1 B, inset 1), suggests a lack of dimer formation. Slow folding in this case likely promotes intramolecular i-motif formation. Indeed, Wu et al. showed that annealing, which is similar to slow folding via pH titration, prohibited the formation of dimers in analytical ultracentrifugation experiments (32). Therefore, we postulate that our observation of biphasic unfolding for samples subject to a rapid drop in pH is consistent with the formation of a small subpopulation of dimers.
A second observation was that in all cases, unfolding of hTeloC occurs at a higher pH than folding regardless of how the folded state was obtained. In 2000, Phan et al. performed pD titrations of a modified human telomere sequence d(C3TA25mCC2TA2C3UA2C3T) at 4°C (33). At the time, they attributed hysteresis to slow unfolding and folding kinetics; however, in 2012, Chen et al. showed that the human telomere i-motif unfolding transition occurs between ∼120 ms and 150 s, depending on the pH change increment across the structural transition range (34). An alternative interpretation is based on structural features. The higher observed unfolding pHT compared with the folding pHT could be attributable to a “capping” effect, whereby coplanar dT bases between parallel-oriented segments of the i-motif form the dT:dT wobble base pair (35, 36). For the sequence studied by Phan et al., such stabilization would occur only on the two-loop side of the 5′E topology intramolecular i-motif. This sequence, hTeloC, includes 5′-TAA… and …TAA-3′ tails. In this case, it is likely that dT:dT wobble pairs can also form in the 5′E topology on the single-loop side of the core between the dT nucleotide of the second loop and the 3′tail dT nucleotide (Fig. 2). The 5′E topology has also been shown to be the dominant fold of the human telomere i-motif in solution regardless of whether the pH is decreased rapidly or slowly (13, 33).
Figure 2.
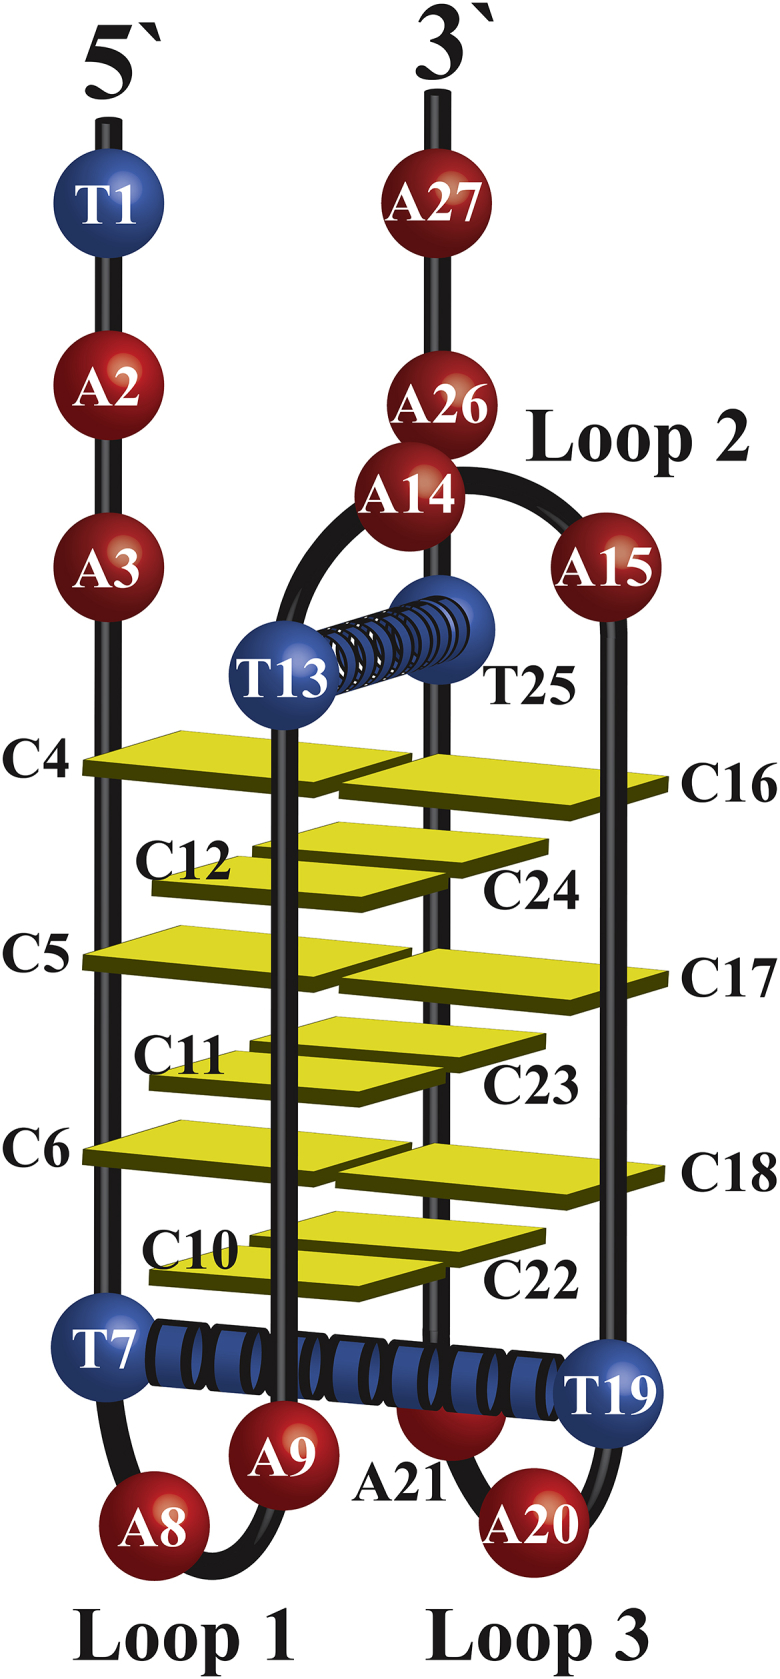
Model of the 5`E topology of hTeloC. Potential dT:dT wobble pairs that stabilize the structure during unfolding are shown by rings. Loops are numbered 1–3 from the 5′-terminus to the 3′-terminus. To see this figure in color, go online.
Folding transitions are predominantly driven by dC-dC+ formation, initiated by protonation of dC nucleotides (34) in a pH range in which the dT protonation state remains unchanged (37, 38). This suggests that dT:dT pairs do not play a role in i-motif formation, but they may be a contributing factor to a higher observed unfolding pHT compared to the folding pHT. Importantly, we do not suggest this behavior is a general phenomenon for all i-motif-forming sequences; rather, it is dependent on the sequence itself. The observed hysteresis is, therefore, likely due to the formation of dT:dT wobble pairs between dT nucleotides (Fig. 2, blue rings) on each side of the intercalated core, a unique feature of the hTeloC sequence studied here. This likely results in resistance to unfolding and dC-dC+ deprotonation, shifting the unfolding transition pH to a higher value than the folding transition pH, at which dT:dT wobble pair formation does not contribute to i-motif formation.
Isothermal folding and unfolding of the RAD17 i-motif
The pH titrations of the RAD17 i-motif (R17) were carried out at 37°C and analyzed by Eq. 2. Experiments were conducted analogously to those performed for hTeloC. The results of each titration cycle are summarized in Table S2.
In titration cycle A, R17 was injected into a low-pH solution and titrated in the increasing-pH direction (Fig. 3 A, inset 1). The structural unfolding transition occurred here in triphasic fashion (Fig. 3 A; inset 1), in which two of the transitions are obvious in the graph and the third is broad, with low cooperativity. Upon titration of the same samples back to low pH (Fig. 3 A, inset 2), a biphasic transition was observed (Fig. 3 A; inset 2). In titration cycle B (Fig. 3 B), a biphasic folding transition was observed (inset 1), and titration of the same samples back to high pH (inset 2) revealed neither hysteresis nor triphasic unfolding. Instead, unfolding assumed nearly the exact same pH dependence and number of phases as both folding titrations in cycles 1 and 2.
Figure 3.

R17 pH titration cycles, recorded at ∼288 nm in the CD spectrum (see Table S4 for exact values). Increasing pH titrations are black, and decreasing pH titrations are red. (A) This panel shows cycle A with increasing pH (inset 1), then decreasing pH (inset 2). (B) This panel shows cycle B with decreasing pH (inset 2), then increasing pH (inset 1). Insets are plots according to Eq. 2 for each directional pH titration. Table S2 contains fit parameters, structural populations (for multiphasic curves), and sample concentrations. Table S4 contains pertinent statistics information for each fit. The (∗) indicates the starting pH for each cycle. To see this figure in color, go online.
In all cases for R17, the lowest stability and cooperativity transitions could correspond to dimer formation, analogous to our postulate for hTeloC, because of the lower stability and cooperativity of intermolecular structures. In the case of the triphasic unfolding behavior for samples injected into a low-pH solution, the two lowest pHT peaks occur nearly simultaneously, with one transition being much sharper and therefore more cooperative than the other. The lower cooperativity peak underlies nearly the entire structural transition range (Fig. 3 A, inset 1) and comprises 48% of the total structural population (Table S2). In the three other titrations, a consistent population was observed that could correspond to dimers and always displays low cooperativity, corresponding to 25–31% of the population (Table S2). One interpretation is that this is due to the formation of dimers, even under slow folding induced by titration. R17 is nearly poly-dC in nucleotide composition and would not be as spatially restricted to dimer formation through random collisions compared to hTeloC. Wu et al. postulated that collision geometries are a limiting factor in dimer formation for hTeloC, which has only 12 dC nucleotides (32). R17 has 18 dC nucleotides contained within two dC9 tracks separated by a single dG nucleotide, making it much less conformationally restricted in terms of the trajectories that lead to folding. The possibility for the formation of higher-order intermolecular structures like tetramer i-motifs or supramolecular i-motifs (39, 40, 41) remains, though conclusively discerning their formation from that of dimers using our approach is not possible.
Another interpretation of the underlying transition displaying low cooperativity includes nonlinearity in the folded and unfolded states, meaning that a particular transition could be an artifact of analysis via Eq. 2. Additionally, i-motif folded states are not necessarily observed in CD spectroscopy as an unchanging molar ellipticity at the rotation maximum of ∼285 nm in low pH ranges (i.e., below the bulk of the structural transition range). Thermodynamic linkage analysis shows that as the pH is decreased below the pKa of cytosine, the CD spectrum will again decrease as i-motif-forming oligodeoxynucleotides become hyperprotonated, thereby dissociating the folded state at extremely low pH values (42).
Regardless of how we interpret the underlying low-cooperativity transition in triphasic unfolding of R17, we are still left with the question of what gives rise to the two distinct high-cooperativity transitions (Fig. 3 A, inset 1) that occur at pH 6.1 and 7.0. Computational and experimental investigations into the unfolding process of the human telomere sequence d((C3TA2)3CCCT) show that more than one step may occur on the unfolding pathway (34, 43, 44), though it is unlikely that these steps would be discernible on timescales relevant to our experiments. Each of those investigations shows a high level of cooperativity in unfolding intramolecular i-motifs, and so, we tentatively assigned each of the aforementioned sharp transitions to individual i-motif structures with different unfolding transition pH values.
It should be noted that the hysteresis observed in cycle A is not observed in cycle B (Fig. 3), unlike the behavior of hTeloC (Fig. 1). hTeloC possesses the potential for loop and tail nucleotide interactions that would occur regardless of how the folded state is obtained, whereas R17 does not possess the same sequence-specific features, such as loop dT:dT interactions, that could confer a resistance to unfolding. The differences in cycle A and cycle B are likely sequence-specific but are most likely due to differences in core topology (i.e., the number and arrangement of dC-dC+ pairs) that arise because of the rate of solution pH change during folding, the key difference between cycle A and B experiments. To test this hypothesis, we carried out titrations on mutants of R17 that employ dT substitutions to limit folded conformations to varying core dC-dC+ arrangements.
The effects of dT substitutions, annealing, and concentration on R17 unfolding after a rapid pH drop
Table 2 summarizes the results of titrating the R17 mutant sequences in comparison to the wild-type R17 sequence in the increasing-pH direction after injection into a low-pH solution (first titration of cycle A). Here, we were interested in modulating the triphasic unfolding behavior noted for R17 in Fig. 3 A (inset 1) in an effort to determine the most likely folding conformations of the wild-type sequence that give rise to multiphasic unfolding.
Table 2.
Structural Transition Data and Fit Parameters from Analysis for R17 and R17-dT Mutants from Cycle A with Increasing pH Titrations
| Sequence | pHT (± SD) | Amplitude (b1)a | FWHM (pH Units)b | Population (%)c | Concentration (μM)d |
|---|---|---|---|---|---|
| R17 | pHT,1 = 6.1 (0.1) | 0.74 | 0.29 | 39 | 3.0 |
| pHT,2 = 6.2 (0.2) | 0.20 | 1.28 | 48 | ||
| pHT,3 = 7.0 (0.1) | 0.22 | 0.33 | 13 | ||
| R17-annealed | pHT,1 = 6.1 (0.1) | 0.88 | 0.37 | 65 | 2.4 |
| pHT,2 = 6.2 (0.2) | 0.09 | 1.90 | 35 | ||
| R17-low concentration | pHT,1 = 6.1 (0.1) | 0.16 | 0.29 | 43 | 1.3 |
| pHT,2 = 6.2 (0.1) | 0.81 | 1.43 | 40 | ||
| pHT,3 = 7.0 (0.1) | 0.45 | 0.24 | 17 | ||
| R17-4444 | pHT,1 = 6.1 (0.1) | 0.69 | 0.87 | 66 | 2.7 |
| pHT,2 = 6.7 (0.1) | 0.84 | 0.37 | 34 | ||
| R17-3434 | pHT,1 = 5.7 (0.1) | 0.30 | 1.04 | 54 | 2.3 |
| pHT,2 = 5.8 (0.1) | 0.69 | 0.29 | 35 | ||
| pHT,3 = 6.6 (0.1) | 0.16 | 0.41 | 11 | ||
| R17-3443 | pHT,1 = 5.2 (0.1) | 0.11 | 0.47 | 10 | 2.6 |
| pHT,2 = 5.8 (0.1) | 0.97 | 0.44 | 78 | ||
| pHT,3 = 6.6 (0.1) | 0.16 | 0.41 | 12 | ||
| R17-4334 | pHT,1 = 5.6 (0.1) | 0.24 | 0.74 | 42 | 2.2 |
| pHT,2 = 5.8 (0.1) | 0.76 | 0.33 | 58 | ||
| R17-4343 | pHT,1 = 5.4 (0.1) | 0.16 | 0.69 | 7 | 2.5 |
| pHT,2 = 5.9 (0.1) | 0.95 | 0.44 | 73 | ||
| pHT,3 = 6.6 (0.1) | 0.24 | 0.47 | 20 | ||
| R17-3333 | pHT,1 = 5.2 (0.2) | 0.21 | 0.50 | 18 | 2.4 |
| pHT,2 = 5.6 (0.1) | 0.93 | 0.44 | 71 | ||
| pHT,3 = 6.4 (0.1) | 0.10 | 0.60 | 11 | ||
| T5-R17∗ | pHT,1 = 6.1 (0.1) | 0.26 | 1.15 | 46 | 2.5 |
| pHT,2 = 6.1 (0.1) | 0.53 | 0.24 | 18 | ||
| pHT,3 = 7.0 (0.1) | 0.60 | 0.41 | 35 |
Analysis was done via Eq. 2. The asterisk indicates that T5-R17 was titrated to ensure minimal perturbations in unfolding behavior of this sequence compared to the WT sequence R17.
Amplitudes are a relative indication of the steepness of a transition pH at the midpoint (Eq. 2, parameter b1).
The FWHM was calculated via Eq. 2 using parameter b3. The FWHM value is an indication of the cooperativity of a structural transition when the amplitude is also taken into account.
Populations were determined by integrating each underlying transition using the fit parameters and Eq. 2 and dividing by the sum of areas for all underlying transitions.
Concentrations were determined by using the UV molar absorptivity at 260 nm (ε260) and the concurrently recorded UV spectrum of a given sample at high pH.
Visual comparison of the dT-mutated R17 sequences (Fig. 4) shows several facets of R17 folding that point toward the most stable folded-state conformation. At the extremes of pH stability lie R17-4444 and R17-3333. R17-3434 and R17-4343 show nearly identical behavior, lower overall than R17-4444. R17-3443 and R17-4334 also show nearly identical behavior. The data generally point to a trend in which the more dT nucleotides there are—forcing loops in those positions—the less pH-stable the i-motif is. This indicates that restricting the range of conformations that R17 may assume via dT substitution when folding during a rapid drop in pH decreases their structural stability. Causes of this observation include increases in the hydrophobicity of the oligodeoxynucleotide (45) and decreases in both the number of core dC-dC+ hydrogen bonds and possible core configurations.
Figure 4.

Comparison of unfolding pH titration curves for dT-substituted mutants of R17 with R17 cycle A, increasing pH and decreasing pH curves. Note that the data shown are the regression lines from analysis via Eq. 2 and do not show the replicate data points from titration experiments. Each curve was recorded ∼288 nm in the CD spectrum (see Table S4 for exact values). To see this figure in color, go online.
Previously, d((C4T)3CCCC) was noted as the most pH-stable dT-mutant sequence of dC19, but less stable than dC19 overall (8). Single dT nucleotides in the first and third loops of other i-motif sequences have also been shown as the most thermally stable for four dC-dC+-pair core i-motif structures (46). In concurrence with these previous investigations, our data suggest that limiting the conformational possibilities of the i-motif by forcing loop positions in a minimal way, as shown by R17-4444, increases the population, giving rise to the highest-stability fold in the R17 i-motif (Fig. 4) obtained by subjecting the sample to a rapid drop in pH. Conversely, R17-3333, which limits conformational possibilities to the greatest extent, results in a significantly diminished overall pH stability and diminished population of structures with high pH stability (pHT,3; see Table 2). The intermediate loop configurations show that a seven dC-dC+ core (R17-3434 and R17-4343) is more stable than a six dC-dC+ core (R17-3443 and R17-4334). This suggests that when hydrogen bonds are maximized between dC nucleotides, higher stability results overall.
Interestingly, slow folding does not appear to maximize the number of dC-dC+ pairs when folding is induced in the wild-type R17 sequence (Fig. 4). R17-4343 and R17-3434 closely match the slow folding curve, rather than that of R17-4444. The slight lag in dissociation noted for R17-4343 and R17-3434 at ∼pH 6.5 is possibly a stalled unfolding process, indicated by the lower cooperativity of those transitions. In this case, slow folding may actually promote the contribution of other factors in i-motif folding such as loop-loop, loop-tail, and tail-tail interactions that require longer timescales for formation, which is not afforded when the pH drops rapidly. Alternatively, they could be due to a small population of a high-stability alternative fold, but our data set is not conducive to making this determination.
Beyond dT loop substitutions, we investigated the effect of thermal equilibration and oligodeoxynucleotide concentration on R17 unfolding. Fig. 5 shows R17 unfolding after injection into a low-pH solution and slow refolding via titration (same data as Fig. 3 A) in comparison to the unfolding titration curve of a sample of R17 that was injected into a low-pH solution, heated to 85°C, and then slowly cooled back to 37°C before titration in the increasing-pH direction. Fig. 5 also shows the effect of decreasing the concentration of R17 by a factor of two on the overall unfolding titration curve of samples injected into a low-pH solution.
Figure 5.

Titration curve plots of R17 ∼288 nm in the CD spectrum (see Table S4 for exact values). R17 was titrated in the increasing-pH direction after injection into a low-pH solution at a concentration of ∼3 μM (R17-Cycle A Up) and ∼1.3 μM (R17-Low Conc.). (R17-Annealed) Data for R17 titrated in the increasing pH direction after both injection into a low-pH solution and annealing at 85°C are shown. (R17-Cycle A Down) shows data for titration of the same samples from “R17-Cycle A Up” in the decreasing-pH direction. Note that the data shown are the regression lines from analysis via Eq. 2 and do not show the replicate data points from titration experiments. To see this figure in color, go online.
For the annealing experiment (Fig. 5, R17-Annealed), a clear drop in pH stability was observed as well as a loss of triphasic unfolding behavior. The overall titration curve of the annealed sample assumes a transition similar to the biphasic folding curve of R17 (Fig. 5, R17-Cycle A Down). We therefore conclude that annealing promotes the formation of structural populations that are more similar to folded R17 samples obtained via titration from high pH to low pH.
Reducing the concentration of R17 by a factor of two (Fig. 5, R17-Low Conc.) for samples injected into a low-pH solution seems only to diminish the formation of the low-cooperativity population (∼40%) compared to a higher-concentration R17 treated in the same way (∼48%). This indicates that concentration has an effect on the formation of what are likely dimers, though the sensitivity of our CD instrument is not high enough to allow further decreases in concentration without a significant growth in the noise intensity.
To ensure that our observation of triphasic unfolding was not a result of performing titrations too rapidly—therefore resulting in the recording of a nonequilibrated CD spectrum—we titrated a separate set of R17 samples from low to high pH after injection into a low-pH solution. We paused this experiment in each replicate titration at pH ∼6.4 for 10 min, which is an order of magnitude greater than the longest equilibration times used to study the human telomere sequence (34). This point is where the greatest difference between increasing and decreasing pH titration curves in cycle A occurs. The results of that experiment are shown in Fig. S24. The folded state population in the pausing experiment showed that a steady CD spectrum persists at pH ∼6.4 after injection of samples into a low-pH solution and titration up to that pH. If the i-motif system was not equilibrated, a drop in folded-state population should be observed as changes in the CD spectrum during the pause, but none occurred.
Importantly, the observation of higher unfolding pH stability in rapidly folded samples of R17 (Fig. 5) compared with annealed R17 samples indicates that the most thermally stable i-motif conformations, obtained via annealing, may not reflect what the most stable conformation is when folding is induced at a specific temperature. As demonstrated by Lieblein et al. for the human telomere i-motif, solution temperature during a pH jump experiment, analogous to sample preparation here before carrying out cycle A increasing pH titrations, significantly shifts the conformational equilibrium between 3′E and 5′E topologies in which favoritism for the 3′E topology grows as the temperature is decreased below ∼35°C (13, 31). During the annealing process, the i-motif could reach a stable conformation beyond which further temperature reduction may not induce rearrangement to a more favored form at a lower specific temperature. This finding indicates that extreme care must be used when evaluating annealed i-motif structural transitions if the goal is to assess their relevance to biological activity or use in sensor applications, both of which typically occur or are carried out under isothermal conditions.
dC19 isothermal folding and unfolding
To draw comparisons between R17 and dC19, we carried out pH titrations of dC19 in the same way as was done in the two titration cycles with R17 (Fig. 3) and hTeloC (Fig. 1). Fig. 6 shows the results of those experiments. The values for transition pH values and fit parameters are provided in Table S3.
Figure 6.

dC19 pH titration cycles recorded ∼288 nm in the CD spectrum (see Table S4 for exact values). Increasing pH titrations are black, and decreasing pH titrations are red. (A) This panel shows cycle A with increasing pH (inset 1), then decreasing pH (inset 2). (B) This panel shows cycle B with decreasing pH (inset 2), then increasing pH (inset 1). Insets are plots according to Eq. 2 for each directional pH titration. Table S3 contains fit parameters, structural populations (for multiphasic curves), and sample concentrations. Table S4 contains pertinent statistics information for each fit. The (∗) indicates the starting pH for each cycle. To see this figure in color, go online.
Cycle A titrations of dC19 show triphasic unfolding curves for samples injected into a low-pH solution and titrated toward high pH (Fig. 6 A, inset 1). The transitions assume a more characteristic behavior consistent with that observed for R17-Annealed (Table 2), rather than for nonannealed R17. It should be noted that even though a biphasic regression of the decreasing pH titration portion of cycle A gave the best results according to Eq. 2 (see Table S3), the transition likely occurs in a single phase. This is because the Jacobian for regression using a single phase was ill-conditioned, a result of oversampling the regions of unchanging CD spectra below pH ∼5.5 and above pH ∼6.5. Noise fluctuations of the instrument when the CD spectrum is relatively constant over a given pH range can result in the misinterpretation of slope values between data points by the regression routine as underlying structural transitions. Titration in the decreasing direction (Fig. 6 A, inset 2) is therefore considered monophasic.
For cycle B, we again observed nearly identical folding and unfolding titration curves (Fig. 6 B), both of which were monophasic. Above and below the transitions, the fit results according to Eq. 2 are not ideal and result from similar inconsistencies noted for cycle A pH titrations in the decreasing direction. These examples illustrate the limitations of analysis via Eq. 2 for certain types of pH titration curves, predominantly occurring when the folded and unfolded states are separated by an extremely narrow pH range.
Overall, dC19 exhibits markedly different behavior from R17. It may be a result of complete conformational freedom in which restrictions on folding patterns induced by the presence of non-dC nucleotides leads to a lower overall stability of the most rapidly versus slowly formed folds. The effect of tails, present in the R17 sequence but not for dC19, may also play a role in the observed behavioral discrepancies, similar to what was noted as a possibility for the observed hysteresis in hTeloC titrations. Regardless, unfolding of dC19 has a generally similar behavior to R17, and so we hypothesize that its pattern supports the assignment of a conformation analogous to R17-4444 as the high-stability population in R17 increasing-pH titrations in cycle A.
Bromine footprinting, thermal melting analysis, and IDS of RAD17
Fig. 7 shows the results of bromine footprinting of the R17 i-motif at pH 5 and pH 8. Three loops are clearly distinguishable at pH 5 by the greater intensity of dC bands, which correspond to nonpairing dC nucleotides. At pH 8, bromination occurs roughly equally for all dC bases, indicating a random coil state.
Figure 7.

R17 bromine footprinting. The gel shown at left indicates a possibility for two conformations of the intramolecular R17 i-motif. Sample preparation for the pH 5 lane was analogous to samples injected into a low-pH solution and titrated toward high pH, and therefore these structures represent the main conformations of R17 for triphasic unfolding. To see this figure in color, go online.
Bromine footprinting shows two structural possibilities: R17-4444(3′E) and R17-4343 (5′E). Using the results of this assay in conjunction with dT substituted R17 titrations, we assign R17-4444(3′E) as the high-stability fold noted in cycle A titrations in the increasing-pH direction and R17-4343(5′E) as the lower-stability fold. Our hypothesis is that when folding is induced rapidly, a 1:3 distribution of R17-4444(3′E) (∼13%) to R17-4343(5′E) (∼39%) intramolecular products is formed, whereas the remaining population (∼48%) is made up of dimer or higher order intermolecular products (see populations in Table S2). In the slow-folding situation, we assign the R17-4343 as the dominant intramolecular population and the remaining population as dimer or higher-order intermolecular products. The focus of future investigations will be to determine conclusively the structures giving rise to each population through a variety of other experimental means not within the scope of the work presented here.
Thermal melting analysis (TM) was also carried out for R17 injected into pH 5, 6, and 7 Britton-Robinson buffers (Fig. S23). The TM values were 80.9, 63.2, and 46.8°C, respectively, and did not conclusively indicate multiphasic thermally induced unfolding. We did not perform TM on any mutant sequences because we cannot guarantee that any sample prepared would be composed of 100% of each specific conformation, calling into question their validity. Indeed, the pH titration curves for each mutant in Fig. 4 show a high likelihood that any sample prepared would have a significant population of alternative i-motif core arrangement conformations that could perturb the results of TM. Further, the isothermal folding and unfolding processes may be distinctly different from thermally induced folding and unfolding. In addition to TM analysis, we compiled IDS for R17, dC19, hTeloC, and dT-substituted R17 sequences, and all confirm dC-dC+ formation (B of Figs. S2–S22). Because of the complexity of samples, the end behavior of IDS (17, 47) for samples whose folded-state populations may contain higher-order intermolecular structures was not predictive.
Conclusions
We have shown that folding and unfolding of the DNA i-motif-forming sequences hTeloC, dC19, R17, and dT-substituted R17 sequences exhibit sequence-specific folding and unfolding behavior that depends on how the folded state was obtained. The human telomere sequence, hTeloC, exhibited persistent hysteresis, for which unfolding always occurred at a higher pH than folding. Unfolding of hTeloC, after experiencing folding induced by a rapid drop in pH, was biphasic and consistent with the formation of a small subpopulation of dimers. R17 exhibited unusual triphasic unfolding after folding induced by a rapid drop in pH, wherein we hypothesize that a subpopulation of R17-4444(3′E) was observed with a transition pH of ∼6.9 at human physiological temperature. During slow folding, the transition pH of R17 dropped significantly and, unlike hTeloC, did not exhibit hysteresis. Finally, dC19, which is similar in sequence to R17, exhibited minimal hysteresis regardless of how the folded state was obtained.
In addition, we have provided an alternative method of mathematical analysis of pH titration curves that allows facile deconvolution and quantification of multiphasic i-motif structural transitions from spectroscopic data. We applied our method of titration and analysis to characterize the isothermal folding and unfolding behavior of an i-motif-forming sequence found in the promoter of the DNA repair gene RAD17. This sequence has a high likelihood for forming a folded conformation that is stable at neutral pH and human physiological temperature, which is unusual in the i-motif field absent molecular crowding agents, although recently Dzatko et al. showed that several i-motif-forming sequences fold in living cells (48). Interrogating the folding of any DNA i-motif under conditions in which the pH changes from high to low rapidly versus slowly results in the observation of different behavioral characteristics that may be of high importance to applications of the DNA i-motif in sensors and materials as well as biology, possibly enhancing their in vivo activity and response characteristics, particularly in the case of living cell sensor technology (24, 25). Our work also evokes further questions about the effect of tails on i-motif stability, how hysteresis may affect pertinent i-motif-forming sequences of oncological importance such as the BCL2 (49, 50, 51) and c-MYC (52, 53) i-motif, and questions regarding the formation of higher-order intermolecular i-motifs, even at low μM concentrations.
Author Contributions
All authors designed the research. R.A.R. conducted the research. All authors wrote the manuscript.
Acknowledgments
This work was supported by a National Science Foundation grant (CHE-1507813) with partial support by a National Cancer Institute grant (R01 CA090689). Oligodeoxynucleotides were provided by the DNA/Peptide core facility at the University of Utah that is supported in part by a National Cancer Institute Cancer Center Support Grant (P30 CA042014).
Editor: Nadrian Seeman.
Footnotes
Supporting Materials and Methods, 24 figures, and four tables are available at http://www.biophysj.org/biophysj/supplemental/S0006-3495(18)30350-3.
Supporting Material
References
- 1.Leroy J.L., Guéron M., Hélène C. Intramolecular folding of a fragment of the cytosine-rich strand of telomeric DNA into an i-motif. Nucleic Acids Res. 1994;22:1600–1606. doi: 10.1093/nar/22.9.1600. [DOI] [PMC free article] [PubMed] [Google Scholar]
- 2.Gehring K., Leroy J.L., Guéron M. A tetrameric DNA structure with protonated cytosine.cytosine base pairs. Nature. 1993;363:561–565. doi: 10.1038/363561a0. [DOI] [PubMed] [Google Scholar]
- 3.Brooks T.A., Kendrick S., Hurley L. Making sense of G-quadruplex and i-motif functions in oncogene promoters. FEBS J. 2010;277:3459–3469. doi: 10.1111/j.1742-4658.2010.07759.x. [DOI] [PMC free article] [PubMed] [Google Scholar]
- 4.Brown R.V., Hurley L.H. DNA acting like RNA. Biochem. Soc. Trans. 2011;39:635–640. doi: 10.1042/BST0390635. [DOI] [PMC free article] [PubMed] [Google Scholar]
- 5.Day H.A., Pavlou P., Waller Z.A.E. i-Motif DNA: structure, stability and targeting with ligands. Bioorg. Med. Chem. 2014;22:4407–4418. doi: 10.1016/j.bmc.2014.05.047. [DOI] [PubMed] [Google Scholar]
- 6.Dong Y., Yang Z., Liu D. DNA nanotechnology based on i-motif structures. Acc. Chem. Res. 2014;47:1853–1860. doi: 10.1021/ar500073a. [DOI] [PubMed] [Google Scholar]
- 7.Wang F., Liu X., Willner I. DNA switches: from principles to applications. Angew. Chem. Int. Engl. 2015;54:1098–1129. doi: 10.1002/anie.201404652. [DOI] [PubMed] [Google Scholar]
- 8.Fleming A.M., Ding Y., Burrows C.J. 4n-1 is a “sweet spot” in DNA i-motif folding of 2′-deoxycytidine homopolymers. J. Am. Chem. Soc. 2017;139:4682–4689. doi: 10.1021/jacs.6b10117. [DOI] [PubMed] [Google Scholar]
- 9.Wright E.P., Huppert J.L., Waller Z.A.E. Identification of multiple genomic DNA sequences which form i-motif structures at neutral pH. Nucleic Acids Res. 2017;45:2951–2959. doi: 10.1093/nar/gkx090. [DOI] [PMC free article] [PubMed] [Google Scholar]
- 10.Gurung S.P., Schwarz C., Brazier J.A. The importance of loop length on the stability of i-motif structures. Chem. Commun. 2015;51:5630–5632. doi: 10.1039/c4cc07279k. [DOI] [PMC free article] [PubMed] [Google Scholar]
- 11.Reilly S.M., Morgan R.K., Wadkins R.M. Effect of interior loop length on the thermal stability and pK(a) of i-motif DNA. Biochemistry. 2015;54:1364–1370. doi: 10.1021/bi5014722. [DOI] [PMC free article] [PubMed] [Google Scholar]
- 12.Benabou S., Garavís M., Gargallo R. Understanding the effect of the nature of the nucleobase in the loops on the stability of the i-motif structure. Phys. Chem. Chem. Phys. 2016;18:7997–8004. doi: 10.1039/c5cp07428b. [DOI] [PubMed] [Google Scholar]
- 13.Lieblein A.L., Fürtig B., Schwalbe H. Optimizing the kinetics and thermodynamics of DNA i-motif folding. ChemBioChem. 2013;14:1226–1230. doi: 10.1002/cbic.201300284. [DOI] [PubMed] [Google Scholar]
- 14.Miyoshi D., Matsumura S., Sugimoto N. Structural polymorphism of telomeric DNA regulated by pH and divalent cation. Nucleosides Nucleotides Nucleic Acids. 2003;22:203–221. doi: 10.1081/NCN-120019528. [DOI] [PubMed] [Google Scholar]
- 15.Kim S.E., Lee I.B., Hong S.C. Destabilization of i-motif by submolar concentrations of a monovalent cation. J. Phys. Chem. B. 2014;118:4753–4760. doi: 10.1021/jp500120d. [DOI] [PubMed] [Google Scholar]
- 16.Day H.A., Huguin C., Waller Z.A.E. Silver cations fold i-motif at neutral pH. Chem. Commun. 2013;49:7696–7698. doi: 10.1039/c3cc43495h. [DOI] [PubMed] [Google Scholar]
- 17.Mergny J.L., Li J., Chaires J.B. Thermal difference spectra: a specific signature for nucleic acid structures. Nucleic Acids Res. 2005;33:e138. doi: 10.1093/nar/gni134. [DOI] [PMC free article] [PubMed] [Google Scholar]
- 18.Bhavsar-Jog Y.P., Van Dornshuld E., Wadkins R.M. Epigenetic modification, dehydration, and molecular crowding effects on the thermodynamics of i-motif structure formation from C-rich DNA. Biochemistry. 2014;53:1586–1594. doi: 10.1021/bi401523b. [DOI] [PMC free article] [PubMed] [Google Scholar]
- 19.Cui J., Waltman P., Lewis E.A. The effect of molecular crowding on the stability of human c-MYC promoter sequence I-motif at neutral pH. Molecules. 2013;18:12751–12767. doi: 10.3390/molecules181012751. [DOI] [PMC free article] [PubMed] [Google Scholar]
- 20.Rajendran A., Nakano S., Sugimoto N. Molecular crowding of the cosolutes induces an intramolecular i-motif structure of triplet repeat DNA oligomers at neutral pH. Chem. Commun. 2010;46:1299–1301. doi: 10.1039/b922050j. [DOI] [PubMed] [Google Scholar]
- 21.Mathur V., Verma A., Chowdhury S. Thermodynamics of i-tetraplex formation in the nuclease hypersensitive element of human c-myc promoter. Biochem. Biophys. Res. Commun. 2004;320:1220–1227. doi: 10.1016/j.bbrc.2004.06.074. [DOI] [PubMed] [Google Scholar]
- 22.Pataskar S.S., Dash D., Brahmachari S.K. Intramolecular i-motif structure at acidic pH for progressive myoclonus epilepsy (EPM1) repeat d(CCCCGCCCCGCG)n. J. Biomol. Struct. Dyn. 2001;19:307–313. doi: 10.1080/07391102.2001.10506741. [DOI] [PubMed] [Google Scholar]
- 23.Catasti P., Chen X., Gupta G. Cystosine-rich strands of the insulin minisatellite adopt hairpins with intercalated cytosine+.cytosine pairs. J. Mol. Biol. 1997;272:369–382. doi: 10.1006/jmbi.1997.1248. [DOI] [PubMed] [Google Scholar]
- 24.Modi S., M G S., Krishnan Y. A DNA nanomachine that maps spatial and temporal pH changes inside living cells. Nat. Nanotechnol. 2009;4:325–330. doi: 10.1038/nnano.2009.83. [DOI] [PubMed] [Google Scholar]
- 25.Modi S., Nizak C., Krishnan Y. Two DNA nanomachines map pH changes along intersecting endocytic pathways inside the same cell. Nat. Nanotechnol. 2013;8:459–467. doi: 10.1038/nnano.2013.92. [DOI] [PubMed] [Google Scholar]
- 26.Fleming A.M., Zhu J., Burrows C.J. Human DNA repair genes possess potential G-quadruplex sequences in their promoters and 5′-untranslated regions. Biochemistry. 2018;57:991–1002. doi: 10.1021/acs.biochem.7b01172. [DOI] [PMC free article] [PubMed] [Google Scholar]
- 27.Nesterova I.V., Briscoe J.R., Nesterov E.E. Rational control of folding cooperativity in DNA quadruplexes. J. Am. Chem. Soc. 2015;137:11234–11237. doi: 10.1021/jacs.5b06645. [DOI] [PubMed] [Google Scholar]
- 28.Ross S.A., Burrows C.J. Cytosine-specific chemical probing of DNA using bromide and monoperoxysulfate. Nucleic Acids Res. 1996;24:5062–5063. doi: 10.1093/nar/24.24.5062. [DOI] [PMC free article] [PubMed] [Google Scholar]
- 29.Ross S.A., Burrows C.J. Bromination of pyrimidines using bromide and monoperoxysulfate: a competition study between cytidine, uridine and thymidine. Tetrahedron Lett. 1997;38:2805–2808. [Google Scholar]
- 30.Guo K., Pourpak A., Hurley L.H. Formation of pseudosymmetrical G-quadruplex and i-motif structures in the proximal promoter region of the RET oncogene. J. Am. Chem. Soc. 2007;129:10220–10228. doi: 10.1021/ja072185g. [DOI] [PMC free article] [PubMed] [Google Scholar]
- 31.Lieblein A.L., Buck J., Schwalbe H. Time-resolved NMR spectroscopic studies of DNA i-motif folding reveal kinetic partitioning. Angew. Chem. Int. Engl. 2012;51:250–253. doi: 10.1002/anie.201104938. [DOI] [PubMed] [Google Scholar]
- 32.Wu S., Wang X., Zhang G. pH-Induced conformational change and dimerization of DNA chains investigated by analytical ultracentrifugation. J. Phys. Chem. B. 2013;117:11541–11547. doi: 10.1021/jp405561f. [DOI] [PubMed] [Google Scholar]
- 33.Phan A.T., Guéron M., Leroy J.L. The solution structure and internal motions of a fragment of the cytidine-rich strand of the human telomere. J. Mol. Biol. 2000;299:123–144. doi: 10.1006/jmbi.2000.3613. [DOI] [PubMed] [Google Scholar]
- 34.Chen C., Li M., Liu D. Study of pH-induced folding and unfolding kinetics of the DNA i-motif by stopped-flow circular dichroism. Langmuir. 2012;28:17743–17748. doi: 10.1021/la303851a. [DOI] [PubMed] [Google Scholar]
- 35.Han X., Leroy J.-L., Guéron M. An intramolecular i-motif: the solution structure and base-pair opening kinetics of d(5mCCT3CCT3ACCT3CC) J. Mol. Biol. 1998;278:949–965. doi: 10.1006/jmbi.1998.1740. [DOI] [PubMed] [Google Scholar]
- 36.Nonin-Lecomte S., Leroy J.L. Structure of a C-rich strand fragment of the human centromeric satellite III: a pH-dependent intercalation topology. J. Mol. Biol. 2001;309:491–506. doi: 10.1006/jmbi.2001.4679. [DOI] [PubMed] [Google Scholar]
- 37.Mucha A., Knobloch B., Sigel R.K.O. Comparison of the acid-base properties of ribose and 2′-deoxyribose nucleotides. Chemistry. 2008;14:6663–6671. doi: 10.1002/chem.200800496. [DOI] [PubMed] [Google Scholar]
- 38.Verdolino V., Cammi R., Schlegel H.B. Calculation of pKa values of nucleobases and the guanine oxidation products guanidinohydantoin and spiroiminodihydantoin using density functional theory and a polarizable continuum model. J. Phys. Chem. B. 2008;112:16860–16873. doi: 10.1021/jp8068877. [DOI] [PubMed] [Google Scholar]
- 39.Laisné A., Pompon D., Leroy J.L. [C7GC4]4 association into supra molecular i-motif structures. Nucleic Acids Res. 2010;38:3817–3826. doi: 10.1093/nar/gkq102. [DOI] [PMC free article] [PubMed] [Google Scholar]
- 40.Guittet E., Renciuk D., Leroy J.L. Junctions between i-motif tetramers in supramolecular structures. Nucleic Acids Res. 2012;40:5162–5170. doi: 10.1093/nar/gks161. [DOI] [PMC free article] [PubMed] [Google Scholar]
- 41.Protopopova A.D., Tsvetkov V.B., Pozmogova G.E. The structural diversity of C-rich DNA aggregates: unusual self-assembly of beetle-like nanostructures. Phys. Chem. Chem. Phys. 2018;20:3543–3553. doi: 10.1039/c7cp05380k. [DOI] [PubMed] [Google Scholar]
- 42.Kim B.G., Chalikian T.V. Thermodynamic linkage analysis of pH-induced folding and unfolding transitions of i-motifs. Biophys. Chem. 2016;216:19–22. doi: 10.1016/j.bpc.2016.06.001. [DOI] [PubMed] [Google Scholar]
- 43.Smiatek J., Heuer A. Deprotonation mechanism of a single-stranded DNA i-motif. RSC Advances. 2014;4:17110–17113. [Google Scholar]
- 44.Smiatek J., Chen C., Heuer A. Stable conformations of a single stranded deprotonated DNA i-motif. J. Phys. Chem. B. 2011;115:13788–13795. doi: 10.1021/jp208640a. [DOI] [PubMed] [Google Scholar]
- 45.Guckian K.M., Schweitzer B.A., Kool E.T. Factors contributing to aromatic stacking in water: evaluation in the context of DNA. J. Am. Chem. Soc. 2000;122:2213–2222. doi: 10.1021/ja9934854. [DOI] [PMC free article] [PubMed] [Google Scholar]
- 46.Mergny J.L., Lacroix L., Helene C. Intramolecular folding of pyrimidine oligodeoxynucleotides into an i-DNA motif. J. Am. Chem. Soc. 1995;117:8887–8898. [Google Scholar]
- 47.Largy E., Mergny J.L. Shape matters: size-exclusion HPLC for the study of nucleic acid structural polymorphism. Nucleic Acids Res. 2014;42:e149. doi: 10.1093/nar/gku751. [DOI] [PMC free article] [PubMed] [Google Scholar]
- 48.Dzatko S., Krafcikova M., Trantirek L. Evaluation of the stability of DNA i-motifs in the nuclei of living mammalian cells. Angew. Chem. Int. Engl. 2018;57:2165–2169. doi: 10.1002/anie.201712284. [DOI] [PMC free article] [PubMed] [Google Scholar]
- 49.Kang H.-J., Kendrick S., Hurley L.H. The transcriptional complex between the BCL2 i-motif and hnRNP LL is a molecular switch for control of gene expression that can be modulated by small molecules. J. Am. Chem. Soc. 2014;136:4172–4185. doi: 10.1021/ja4109352. [DOI] [PMC free article] [PubMed] [Google Scholar]
- 50.Kendrick S., Kang H.-J., Hurley L.H. The dynamic character of the BCL2 promoter i-motif provides a mechanism for modulation of gene expression by compounds that bind selectively to the alternative DNA hairpin structure. J. Am. Chem. Soc. 2014;136:4161–4171. doi: 10.1021/ja410934b. [DOI] [PMC free article] [PubMed] [Google Scholar]
- 51.Kendrick S., Akiyama Y., Hurley L.H. The i-motif in the bcl-2 P1 promoter forms an unexpectedly stable structure with a unique 8:5:7 loop folding pattern. J. Am. Chem. Soc. 2009;131:17667–17676. doi: 10.1021/ja9076292. [DOI] [PMC free article] [PubMed] [Google Scholar]
- 52.Dai J., Hatzakis E., Yang D. I-motif structures formed in the human c-MYC promoter are highly dynamic--insights into sequence redundancy and I-motif stability. PLoS One. 2010;5:e11647. doi: 10.1371/journal.pone.0011647. [DOI] [PMC free article] [PubMed] [Google Scholar]
- 53.Lemarteleur T., Gomez D., Riou J.-F. Stabilization of the c-myc gene promoter quadruplex by specific ligands’ inhibitors of telomerase. Biochem. Biophys. Res. Commun. 2004;323:802–808. doi: 10.1016/j.bbrc.2004.08.150. [DOI] [PubMed] [Google Scholar]
Associated Data
This section collects any data citations, data availability statements, or supplementary materials included in this article.