Summary
Locomotion is a fundamental motor function common to the animal kingdom. It is executed episodically and adapted to behavioural needs including exploration, requiring slow locomotion, and escaping behaviour, necessitating faster speeds. The control of these functions originates in brainstem structures although the neuronal substrate(s) supporting them are debated. Here, we show in mice that speed/gait selection are controlled by glutamatergic excitatory neurons (GlutNs) segregated in two distinct midbrain nuclei: the Cuneiform Nucleus (CnF) and the Pedunculopontine Nucleus (PPN). GlutNs in each of those two regions are sufficient for controlling slower alternating locomotor behavior but only GlutNs in the CnF are necessary for high-speed synchronous locomotion. Additionally, PPN- and CnF-GlutNs activation dynamics and their input and output connectivity matrices support explorative and escape locomotion, respectively. Our results identify dual regions in the midbrain that act in common to select context dependent locomotor behaviours.
Keywords: motor behaviour, brainstem, mesencephalic locomotor region, basal ganglia, glutamatergic neurons
Introduction
Activities like exploring the surroundings, searching for food, or escaping from dangers depend on locomotor movements. The episodic nature of locomotion necessitates cycles of initiation and termination. At the same time, during locomotion and depending on behavioural demands, changes of speed are necessary. In quadrupeds, this function is often associated with changes in limb coordination leading to expression of different gaits1. Thus, alternating gaits like walk and trot are present at slower locomotor speeds, while synchronous gaits like gallop or bound evolve at fast locomotor speeds1 and are mostly used during escape-like behaviours. The executive locomotor circuits that control the coordination of muscle activity is localized in the spinal cord2–6. Yet, the commands for initiation and gait selection may originate in different supraspinal structures. The most important neuronal structure that has been implicated in these functions is a region in the midbrain named the mesencephalic locomotor region or MLR7,8,9.
The MLR was first defined functionally in cats as a region localized in or around the Cuneiform nucleus (CnF) where continuous electrical stimulation evoked persistent locomotion10. Analogues of MLR have been observed in many vertebrates including fish, rodents, primates and humans8,9,11,12 but with conflicting results as to its anatomical location. In addition to CnF the more ventrally located pedunculopontine nucleus (PPN) has been implicated. Besides being anatomically separated, each of these regions contains neurons with diverse transmitter phenotypes with excitatory long-range projection neurons –that are glutamatergic in CnF and both glutamatergic and cholinergic in PPN– intermingled with local inhibitory interneurons11,12. Electrical stimulation or lesion studies are therefore unable to distinguish the contribution from the various intermingled neuronal populations present in these areas12,13. Recently, optogenetic manipulations have showed that stimulation of glutamatergic neurons (GlutNs) in and around PPN induced locomotion in mice14. The MLR was regarded as a unity precluding any evaluation of the putative divergent control of locomotion by subpopulations of neurons in CnF and PPN. Hence, the question of whether and how neuronal populations of CnF and PPN control locomotion remains unanswered.
Here, we address this question by using cell-type specific targeting needed to modulate and record the activity of neurotransmitter-defined neurons in either CnF or PPN. Our results reveal that the MLR is defined by glutamatergic subpopulations of neurons in both PPN and CnF that may act in common to control slower alternating locomotion. Furthermore, glutamatergic neurons in PPN favour locomotion for the purpose of explorative behaviour and in CnF for escaping locomotion. Our study identifies circuits that are key actors in the command pathways appropriate for selecting locomotor outputs contingent on behavioural contexts.
Results
Speed control by CnF and PPN cells
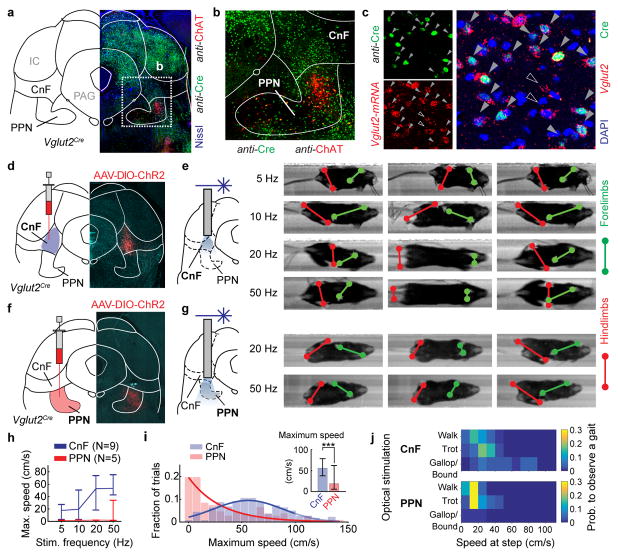
The anatomical locations of the CnF and PPN are shown in figure 1a, b. The glutamatergic cells in CnF and PPN express the vesicular glutamate transporter 2, Vglut2 (Allen Brain Atlas and15). To target glutamatergic neurons in the CnF or PPN we, therefore, used injections of Cre-dependent adeno-associated virus (AAV) carrying channelrhodopsin-2 and fluorescent tags (AAV-DIO-ChR2-eYFP/mCherry) in a Vglut2Cre mouse line (16, Fig. 1c,d,f)(injection sites in Extended Data Fig. 2a,b).
Figure 1. Speed-gait control of locomotion from glutamatergic neurons in cuneiform and pedunculopontine nuclei.
a,b,c, Neurotransmitter identity and localization.
d,e,f,g, Locomotor examples induced by optical stimulation of CnF (d,e) and PPN (f,g).
h, Maximum speed evoked by different stimulations of PPN (red; N=5, n=67) and CnF (blue; N 9, n=148). Error bars indicate the 25th and 75th percentile of the distribution.
i, Fraction of trials at a given maximum speed (inset; ***, p<0.001, two-tailed U-test).
j, Probability of obtaining different gaits (CnF-upper or PPN-lower panel).
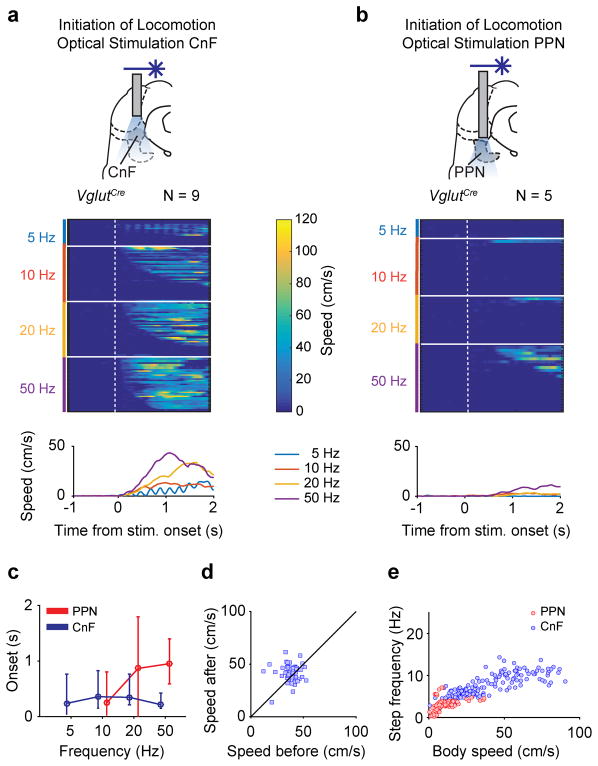
In a linear corridor1, unilateral light activation of Vglut2+/ChR2-expressing CnF neurons (hereafter CnF-Vglut2/ChR2-Ns) led to initiation of full-body locomotion in resting animals (N=9/9; locomotor movements detected in 128/148 trials corresponding to 86 %). Step-wise increasing the stimulation frequencies from threshold values around 5 Hz to maximal frequencies at 50 Hz progressively increased the speed of locomotion (p<0.05, Kruskal-Wallis, post-hoc analysis with Bonferroni correction for multiple comparisons; between speeds at different frequencies Fig. 1e, h –blue line– and Extended Data Fig. 1a, p<0.001, Spearman Correlation r=0.32 between frequency of stimulation and maximum speed, Supplementary Video 1). Activation of CnF-Vglut2/ChR2-Ns produced a wide range of speeds (Fig. 1i, blue) and all gaits including the alternating gaits walk and trot and synchronous gaits like gallop and bound (Fig. 1e, j –upper panel)1,17,18. The onset of locomotion was in the range of 100–150 ms (Extended Data Fig. 1c, blue line) and constant with stimulation frequency (p>0.05, Kruskal-Wallis test).
Light activation of the Vglut2+/ChR2-expressing PPN neurons (referred as PPN-Vglut2/ChR2-Ns) also initiated locomotion from rest (Fig. 1f,g, N=5 out of 7 animals; movements detected in 22/67 trials corresponding to 33 %). Low frequency stimulation (<10 Hz) was not able to induce locomotion (Fig. 1h and Extended Data Fig. 1b). However, increasing the frequency increased the speed of locomotion (p>0.05, Spearman Correlation between frequency of stimulation and speed), but did not induce neither very high-speed locomotion (Fig. 1g,h-red and Extended Data Fig. 1b; maximum speed stimulating CnF-Vglut2/ChR2-Ns 56 cm/s vs. PPN-Vglut2/ChR2-Ns 19 cm/s, p < 0.001, U-Test, Fig. 1i-red) (Supplementary Video 2) nor gallop or bound (Fig. 1g, j –lower panel). In addition, the onset for initiating locomotion was significantly longer (0.2–1.5s) than after CnF-Vglut2/ChR2-Ns stimulation (Extended Data Fig. 1c, red line; p<0.05, U-test). Stimulation of PPN-Vglut2/ChR2-Ns (expression of ChR2 in Extended Data Fig. 2c) during on-going locomotion modulated the speed (p=0.03, sign-rank test) causing an overall increase of 18 % of the speed before light onset (Extended Data Fig. 1d). This stimulation-induced increase of speed never exceeded the walking and trot speed ranges confirming that selective activation of PPN-Vglut2/ChR2-Ns could not drive fast synchronous gaits.
The frequency of stimulation was not directly translated into the actual stepping frequency but had a relationship between stepping frequency and velocity of locomotion (Extended Data Fig. 1e) similar to what is seen during spontaneous locomotion in wild-type mice1 showing that light-stimulation is converted into naturally expressed locomotor activity.
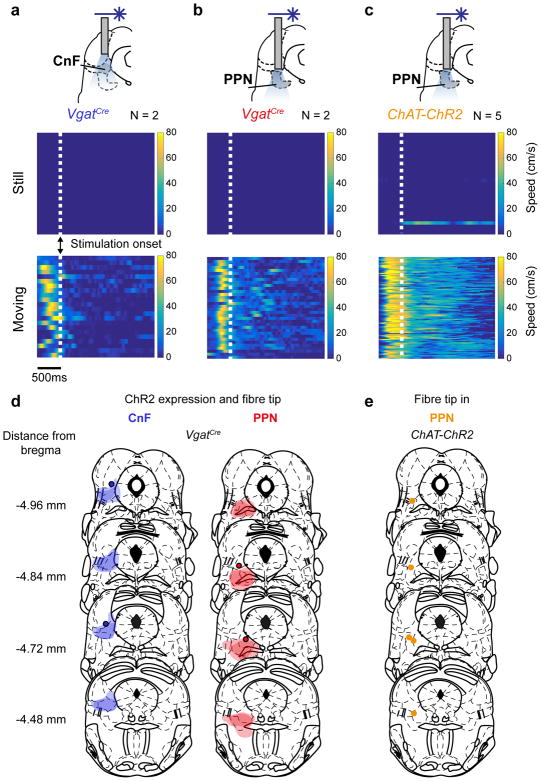
The optogenetically-induced locomotor phenotypes were linked to glutamatergic neurons in PPN or CnF. No locomotion was induced by stimulation of the local inhibitory neurons in PPN and CnF 14 or the cholinergic cells in PPN while their activation slowed or stopped on-going locomotion (Extended data Fig. 3a–c).
Dual and singular control of locomotion
The optogenetically-induced locomotor phenotypes raise the question whether activity in glutamatergic neurons in PPN and CnF together or independently are necessary for maintaining on-going locomotion at different speeds. We therefore performed experiments that selectively dampened the activity of the identified populations using the inhibitory muscarinic designer receptor hM4Di (iDREADD) that are activated by CNO (Clozapine-N-oxide)19,20. Vglut2Cre mice were bilaterally injected with iDREADDs in both structures (CnF: N=9; PPN: N=8; CnF/PPN: N=6; injection sites Extended Data Fig. 4).
Non-viral-injected animals that received CNO i.p. (1 mg/kg) showed no changes in the instantaneous speed that they were able to produce on a treadmill as compared to saline injections (Extended Data Fig. 5a). Test-animals with viral infections that received saline expressed average speeds between 26 to 27 cm/s and maximal speeds between 47 to 55 cm/s (Fig. 2a,b) corresponding to the slow walk/trot and fast trot range of spontaneous locomotion in adult intact mice1. When CnF-Vglut2/iDREADD-Ns were inactivated there was a reduction in both the average and maximum speed (before vs. after CNO, average speed 27 cm/s vs. 20 cm/s, maximum speed 50 cm/s vs. 41 cm/s, U-test p < 0.05, Fig. 2a,b), similar to when PPN-Vglut2/iDREADD-Ns were inhibited (Fig. 2a,b; average speed 27 cm/s vs. 18 cm/s, maximum speed 54 cm/s vs. 43 cm/s, U-test p<0.05). These effects developed over time with maximal effects after 30 min (Extended Fig. Data 5). Interestingly, when the iDREADD virus was injected in both PPN and CnF bilaterally, the animal could only produce very slow forward locomotion (typically single steps with an overall speed in the walking range, Fig. 2a,b).
Figure 2. PPN and CnF provide dual control of slower locomotion.

a,b, Bilateral inhibition with iDREADDs in Vglut2Cre mice in CnF or/and PPN. Average (a) and maximum (b) speed of the animal before vs. after CNO administration (*, p<0.05, two-tailed sign-rank test).
These experiments posit that glutamatergic subpopulations in PPN and CnF together are necessary for maintaining on-going locomotion in the walking/trot range and that both PPN and CnF can independently support the expression of slower alternating locomotion.
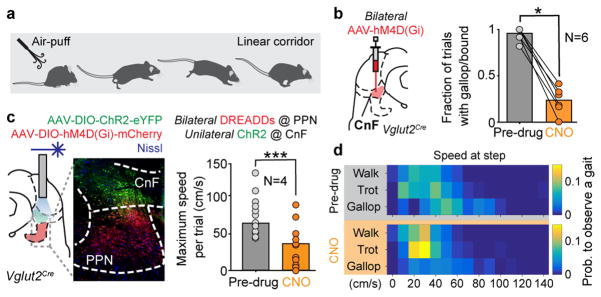
To inspect the capability of CnF-Vglut2-Ns to produce gallop and bound, we first tested inactivation of CnF-Vglut2/iDREADD-Ns in a behavioural assay that allowed the expression of fast escape-like behaviour (Fig. 3a, see Methods). In saline injected animals, this procedure produced reliable high-speed escape-like locomotion supported by gallop or bound in 94 % of the trials (66 of 70, N=6, Fig. 3b). After CNO the same animals were unable to produce high-speed escape-like actions and showed only isolated or no signs of gallop/bound in 23 % of the trials (18 of 79 trials, N=6, Fig. 3b, p<0.05, sign-rank test). We next tested if gallop and bound could be generated with activation of the CnF-Vglut2-Ns independently of a functioning PPN by bilaterally injecting inhibitory DREADDs to PPN-Vglut2-Ns and ChR2 to CnF-Vglut2-Ns (Fig. 3c, N=4). Light activation of CnF-Vglut2-Ns was able to induce a range of locomotor speeds and all gaits including gallop and bound before and after CNO injection with only a reduction in the maximal speeds (Fig. 3c,d, Supplementary Video 3). These results show that glutamatergic neurons in the CnF are necessary for producing gallop and bound and they can drive those gaits independent of glutamatergic neurons in the PPN.
Figure 3. Glutamatergic neurons in the cuneiform nucleus are needed and sufficient for fast synchronous locomotion.
a,b, Injection of DREADDs bilaterally in CnF of Vglut2Cre and probability of evoking gallop/bound before and after inactivation of CnF with CNO during air-puff induced escaping behaviour (p=0.0312, two-tailed sign-rank test, N=6).
c–d, Maximum speeds of locomotion (c) combining inhibitory DREADDs in the PPN, and optogenetic activation of CnF at 50 Hz before (grey, n=13 repetitions, N=4 mice) and after CNO (orange bars, n=12 repetitions, N=4 mice, p<0.05, two-tailed U-test) and their relationship with gaits (d).
Drawing in Fig. 3a reproduced with permission from Mattias Karlen.
Neuronal firing and relationship to speed
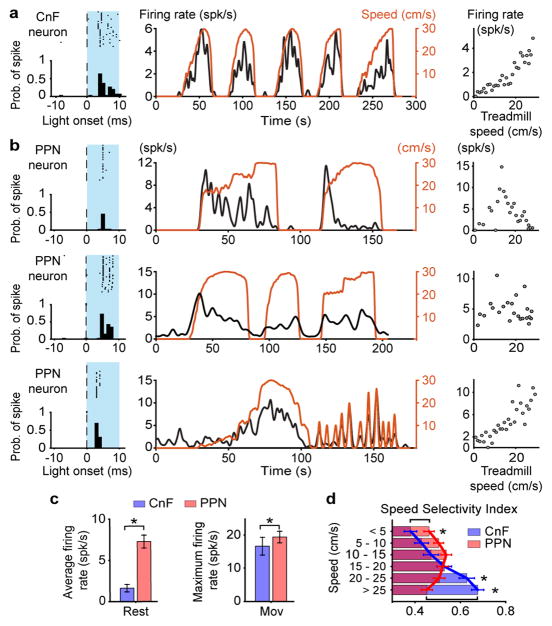
The complementary roles played by glutamatergic neurons in CnF and PPN in locomotor speed regulation of alternating locomotion may be reflected in their firing activity. We, therefore, recorded extracellularly the activity of CnF and PPN neurons when animals were walking/trotting on a treadmill (0–30 cm/s). Glutamatergic neurons were infected with AAV-DIO-ChR2 either in CnF (N=2) or PPN (N=2) and identified as such by short latency (up to 5 ms) and constant jitter responses to brief pulses of blue light (Fig. 4 and Extended Data Fig. 6a). We recorded from a total of 169 CnF-Vglut2-Ns and 493 PPN-Vglut2-Ns. Figures 4a–b show example-neurons in the two structures with a CnF-Vglut2/ChR2-N (Fig. 4a) that had a striking correlation between speed and firing rate and PPN-Vglut2/ChR2-Ns that were either recruited at the beginning of the locomotor bout and then slowly de-recruited (Fig. 4b, top), showed no speed modulation (Fig. 4b, middle) or showed clear modulation with the speed of locomotion (Fig. 4b, bottom).
Figure 4. Coding of speed in glutamatergic neurons in cuneiform and pedunculopontine nuclei.
a,b, Examples of neuronal firing at different speed of treadmill induced locomotion in CnF (a) and PPN (b).
c, Average responses at rest (left) in CnF (n=79) and PPN (n=105, p<0.001, two-tailed U-test) and during movements (right, p<0.001, two-tailed U-test).
d, Speed Selectivity Index (see text and Methods). PPN-Vglut2 neurons were more selective at lower speed while CnF-Vglut2 were more selective at higher speed (*, p<0.05, two-tailed U-test with post-hoc Bonferroni correction). Data are mean ± s.e.m.
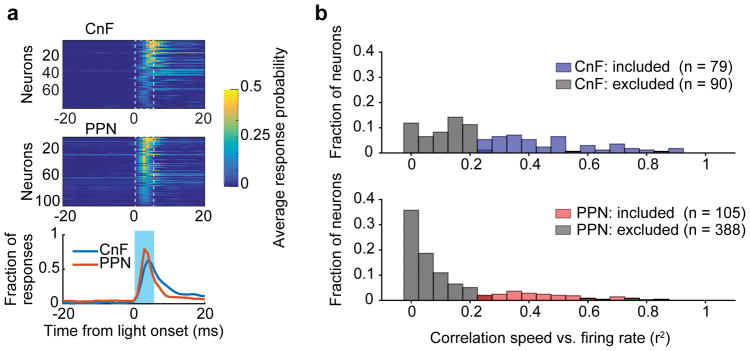
For further quantitative analysis, we only considered glutamatergic neurons in PPN and CnF that modified their firing rate with changes in speed (Spearman correlation test firing rate vs. speed, p<0.01, PPN n=105, median correlation 0.63; CnF n=79, median correlation 0.63)(Extended Data Fig. 6b). Among these speed-related cells, there were differences in the firing distribution of CnF-Vglut2/ChR2-Ns and PPN-Vglut2/ChR2-Ns during rest (Fig. 4c, ‘Rest’, average activity: CnF vs. PPN: 0.45 vs. 4.0, p<0.05, U-Test) and movement (Fig. 4c, ‘Mov’, maximum activity: CnF vs. PPN 5.93 vs. 14.28, p<0.05, U-Test).
We quantified these firing profiles by computing a Speed Selectivity Index (SSI), which weight how much the firing rate at a specific speed is stronger than the activity at rest (Fig. 4d). Neurons in both CnF and PPN showed selectivity with respect to their baselines (Fig. 4d, p<0.05, Sign-rank test against baseline with post-hoc Bonferroni correction). Nevertheless, the selectivity was different: PPN-Vglut2/ChR2-Ns were more selective at the lowest treadmill speed i.e. below 5 cm/s, while CnF-Vglut2/ChR2-Ns were more selective at the highest treadmill speed i.e. above 20 cm/s (p<0.05, U-test with post-hoc Bonferroni correction).
The firing rate versus movement and speed analysis support the notion that glutamatergic CnF/PPN neurons contribute to code speeds of locomotion with a stronger contribution by PPN than by CnF neurons at the lowest speeds and a stronger coding of the higher speeds of locomotion by CnF than PPN neurons.
PPN is involved in exploratory behaviour
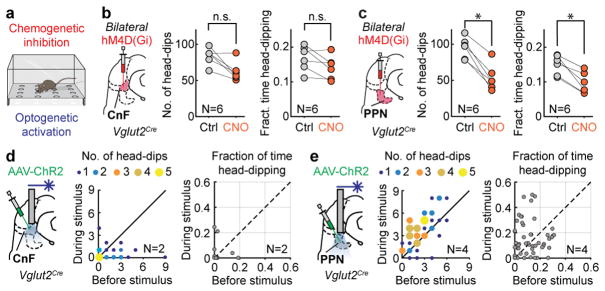
The different firing behaviour of PPN and CnF neurons raises the possibility that they might be mobilized differently to support slow explorative behaviour. We therefore measured explorative behaviour using a context –the hole-board test21,22 (Fig. 5a)– which promotes slow-speed locomotion for exploratory purposes. Mice were injected bilaterally with iDREADDs targeting either Vglut2-Ns in CnF or PPN (Fig. 5b,c). Changes in locomotion induced by CnF-Vglut2/iDREADD-Ns or PPN-Vglut2/iDREADD-Ns were measured as the average speed of locomotion, the distance travelled and ambulation time in the same animal after saline or CNO. CnF injected animals (N=6) did not show any difference in these locomotor parameters (sign-rank saline vs. CNO, p>0.05), while PPN injected animals (N=6) showed significant reduction of the total distance travelled and average speed (sign-rank saline vs. CNO, p<0.05). As a measure of exploration, we measured the number or fraction of head-dips. Before and after CnF-Vglut2/iDREADD-Ns inactivation there was no difference in these parameters (Fig. 5b, N=6; p>0.05, sign-rank test) while both were significantly reduced by PPN-Vglut2/iDREADD-Ns inactivation (see Fig. 5c, N=6; p<0.05, sign-rank test). These results support that glutamatergic PPN activity may facilitate slow explorative locomotor behaviour.
Figure 5. Selection of exploration from PPN.
a,b,c, During exploratory hole-board experiments (a), bilateral inactivation of CnF (b, N = 6) did not reduce either the frequency (left, p > 0.05) or the fraction of time (right, p > 0.05) of head-dips. Bilateral inactivation of PPN (c, N=6) reduced both parameters (left, p=0.031, right, p=0.031, both two-tailed sign-rank tests).
d,e, Optogenetic stimulation of CnF (N=2) induced a decrease in number (d–left, p=0.0023) but not in the fraction of time of head-dipping (d–right, p>0.05) while stimulation of PPN (N=4) increased (e) them (left p<0.001, right p=0.0218, all two-tailed sing-rank tests). Drawing in Fig. 5a reproduced with permission from Mattias Karlen.
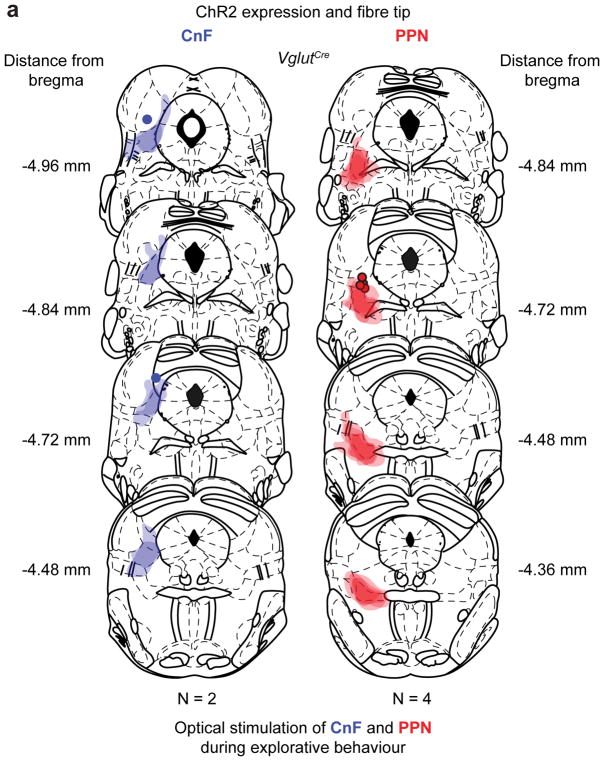
We next tested if PPN activation also could increase exploration. Vglut2 neurons in CnF (N=2, see Extended Data Fig. 7) or PPN (N=4, Extended Data Fig. 7) were infected with ChR2 (Fig. 5d, e) and stimulated for 10 s (40 Hz) at random times throughout the 5 minute exploration period (Supplementary Video 4). There was a significant reduction of head-dipping before and after stimulation of CnF (Fig. 5d, p < 0.05, U-test test, n=40 repetitions in N=2 mice) –due to induction of escaping-like behaviour– but a significant increase in both number and fraction of head-dipping during PPN stimulation (Fig. 5e, p< 0.05, U-test, n=53 repetitions in N=4 mice). These experiments further support the idea that activity in PPN-Vglut2-Ns favours movements at slow speeds for the purpose of explorative behaviour.
Brain-wide inputs to CnF and PPN
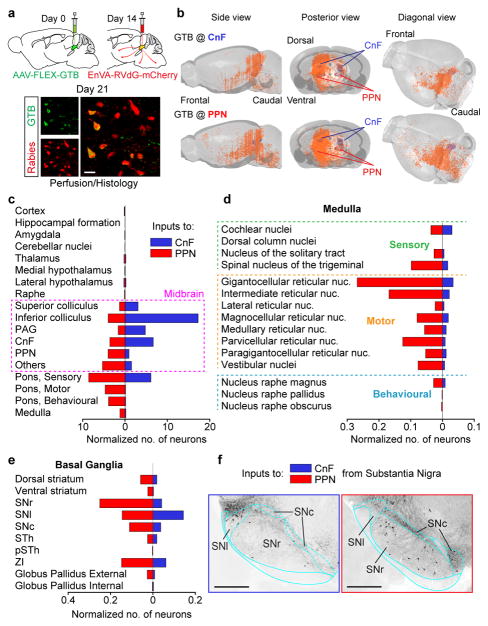
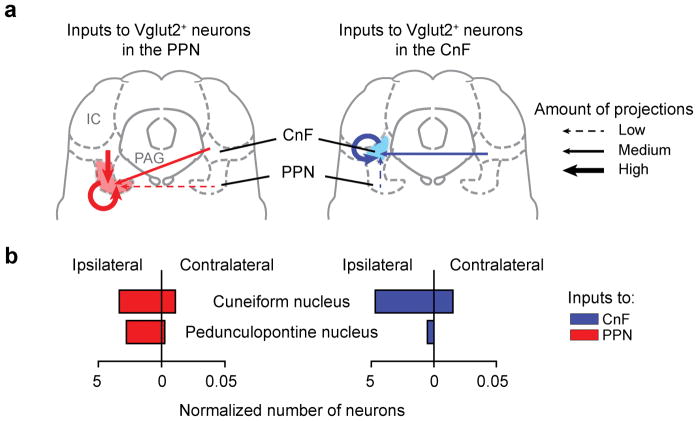
To investigate the regulation of CnF and PPN GlutNs we traced the sources of neuronal inputs to each structure, using the rabies based mono-synaptically restricted retrograde trans-synaptic circuit tracing (23,24 see Methods; Fig. 6). Trans-synaptically labelled are seen as red-only neurons in figure 6a. The overall distribution of projecting-neurons to the CnF-Vglut2-Ns or the PPN-Vglut2-Ns was visibly different (orange dots in Fig. 6b; PPN, N=3; CnF, N=3). Most inputs were ipsilateral to the injection site, and inputs to CnF-Vglut2-Ns were more restricted when compared to the PPN-Vglut2-Ns. The main inputs to PPN-Vglut2-Ns originate in midbrain structures (Fig. 6c) and sensory-motor and raphe nuclei in the brainstem (Fig. 6d). Furthermore, PPN-Vglut2-Ns also receive direct input from the output nuclei in the basal ganglia (Fig. 6e,f). Sparse inputs were found from sensory-motor and frontal cortices or hypothalamus (Fig. 6c). Therefore, PPN-Vglut2-Ns integrates sensory-motor information from many brain structures. Conversely, CnF-Vglut2-Ns receive little inputs from basal ganglia output nuclei (Fig. 6e–f) or from cortices, but stronger projections from midbrain structures (e.g. PAG or IC, Fig. 6c–d) that have been assigned a role in escape responses25,26.
Figure 6. Neurons in cuneiform and pedunculopontine nuclei have differential input matrices.
a,b, Reconstruction of projections to CnF (b, N=3, upper row) or PPN (b, N=3, lower row) as revealed by mono-synaptically restricted trans-synaptic retrograde labelling.
c–e, Regional distribution (median, N=3) of neurons projecting to CnF (blue) and to PPN (red) normalized to the number of primary infected neurons in either structure.
f, Examples of labelled neurons (black) in the substantia nigra projecting onto glutamatergic CnF (left) or PPN (right) neurons. a, Scale bar, 20 μm. f, Scale bars, 500 μm. IC, inferior colliculus; SNc, substantia nigra pars compacta; SNl, substantia nigra pars lateralis; SNr, substantia nigra pars reticulata; PAG, periaqueductal grey; PSTh, parasubthalamic nucleus; STh, subthalamic nucleus; ZI, zona incerta. The mouse brain schematics in this figure have been reproduced with permission from Elsevier 38.
Lastly, Vglut2-Ns in CnF and PPN have reciprocal projections with dominant projections from CnF to PPN (Extended Data Fig. 8) which provide gateways for CnF-Vglut2-Ns to modulate PPN neurons in the range of the slower alternating locomotion.
Convergent and divergent outputs
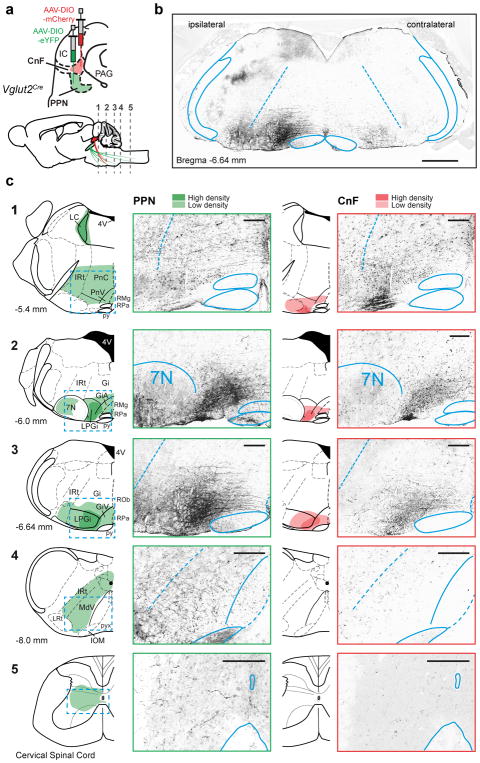
Descending projections from Vglut2-CnF-Ns and Vglut2-PPN-Ns was evaluated with transmitter-specific anterograde tracing (Extended Data Fig. 9a). Few neurons projected directly to cervical and thoracic spinal cord (see also27–29)(Extended Data Fig. 9c5). PPN-Vglut2-Ns have broad –predominantly ipsilateral– projections including to motor related nuclei in pons as well as modulatory nuclei (Extended Data Fig. 9b,c1–4). Most of these brainstem nuclei project to the spinal cord in mice27. In contrast, CnF had more restricted projection and both overlapping and non-overlapping projections with PPN in the medulla (Extended Data Fig. 9c1–4).
Conclusions
Our study shows that two transmitter-defined and spatially-segregated populations of neurons in the mouse midbrain form command pathways that encode speeds of locomotion in complementary ways. Neuronal circuits in PPN and CnF both contribute to the maintenance and speed regulation of slower locomotion while only CnF is able to elicit high-speed synchronous locomotor activity. The functional locomotor signatures are linked to the activity of the glutamatergic neurons in the CnF and PPN. The focus on speed control and selection of gaits provided a combined solution to understanding the functional organization of the midbrain structures involved in locomotor control. The concept of unitary Mesencephalic Locomotor Region (MLR) in mammals is therefore refined by a more advanced model, in which the locomotor control function resides in both PPN and CnF.
The behavioural support of slow explorative and fast escape behaviour by glutamatergic PPN and CnF neurons, respectively, suggest that these neuronal circuits may be recruited in specific behavioural contexts. The differential input matrices to glutamatergic neurons in CnF or PPN also point to the existence of dual functions in addition to the combined control of alternating gaits. The strong inputs to CnF-Vglut2-Ns from PAG (especially the dorsal part), inferior colliculus, and hypothalamus, are in accordance with previous anatomical findings12 and suggest that CnF-mediated fast locomotion may be generated as part of an escape response independent of the PPN. As previously shown, PPN neurons receive rich projection from basal ganglia nuclei12,14, but also from many midbrain and medullary sensory-motor nuclei as well as from motor cortex. This innervation pattern is in accordance with a role of glutamatergic PPN neurons for exploratory locomotor behaviour under the motor action selection of the basal ganglia30,31,32,33,34,7. The strong connection from the basal ganglia also suggests that dysregulation of glutamatergic neurons in PPN may play important roles in Parkinson’s disease related locomotor disability.
The descending projections from glutamatergic CnF and PPN neurons suggest that the speed signal is funnelled through diverse brainstem nuclei, that in turn project to the locomotor networks in the spinal cord. The convergent projections of CnF and PPN to regions that contain excitatory reticulospinal neurons35,36 provides a gateway to support alternating gaits in a speed dependent manner37. This area may also be accessed from CnF independent of PPN since CnF may initiate gallop and bound without activity in PPN. Conversely, neurons in PPN project more broadly to nuclei in pons and medulla which are mostly devoid of CnF projections, and may provide descending pathway(s) involved in slow explorative locomotor behaviour.
Experimental Procedures
Animals
All experiments were approved by the local ethical committee (Stockholm Norra Djuretiska nämn). For most experiments adult (3 – 5 months old of both sexes) Vglut2Cre transgenic mice16 were used. In some experiments adult (8 – 14 weeks old of both sexes) VgatCre and ChATCre (ChAT-IRES-Cre knock-in, Jackson Laboratory) transgenic mice were used. ChATCre mice were crossed with Rosa26-CAG-LSL-ChR2-EYFP-WPRE (Jackson Laboratory). Animals were genotyped before the experiments.
In vivo optogenetic experiments
Viral injections and ferrule implantation
For viral transfection of Vglut2 expressing neurons, Vglut2Cre animals aged 3 – 5 months were anaesthetized with isoflurane. For activation experiments a total of 100 – 300 nl of an AAVdj-EF1a-DIO-hChR2-p2A-mCherry-WPRE virus was pressure-injected by a glass micropipette into the CnF (anteroposterior angle 15 degrees, from Bregma: antero-posterior −5.7 mm, medio-lateral 1.2 mm, depth 2.9 mm) or PPN (anteroposterior angle 20 degrees, from bregma: anteroposterior −5.9 mm, medio-lateral 1.2 mm, depth 4.2 mm). In the same surgery, an optical fibre (200 μm core, 0.22 NA, Thorlabs) held in a 1.25 mm ferrule was implanted (500 μm above the injected site) for stimulation of the transfected cells. For reducing firing in Vglut2 expressing neurons, 100 – 200 nl of an AAV-hSyn-DIO-hM4D(Gi)-mCherry virus (UNC vector core) was bilaterally injected in either CnF or PPN or both structures.
Great care was taken to not damage the CnF on the way to PPN by adjusting the angle to 20 degrees. By measuring the response evoked from stimulation of CnF in animals (N = 2) expressing ChR2 in both CnF and PPN we confirmed that acutely lowering the optical fibre to stimulate first the CnF and then the PPN did not damage CnF. Thus, the same activation of both CnF and PPN was obtained both when lowering and retracting the probe demonstrating that CnF damage did not account for PPN findings.
Some animals were bilaterally injected with AAV-hSyn-DIO-hM4D(Gi)-mCherry virus in the PPN, and unilaterally with AAVdj-EF1a-DIO-hChR2-p2A-eYFP-WRPE and implanted for optical stimulation of the CnF. For the first week after surgery, all animals were treated daily with painkillers and monitored for any sign of discomfort.
Optogenetic stimulation
A 473 nm laser (Optoduet, Ikecool Corporation, CA) was connected to the ferrule chronically implanted on the animals through a ceramic mating sleeve. For light-activation of ChR2-transfected neurons, we used trains of light pulses (Master-8 pulse generator, AMPI or custom-made Matlab scripts) with variable pulse durations and frequencies. When the frequency was changed the pulse duration was also changed to obtain the same intensity of stimulation with constant laser power. The intensity of the laser was between 5 and 30 mW.
Drugs
Clozapine-N-oxide (CNO, Sigma-Aldrich) was dissolved in physiological saline to obtain a final dose of 1 mg/kg, before being injected intraperitoneally.
Behavioural test in a corridor
Locomotor behaviour was recorded with the TSE MotoRater system with the animals running spontaneously on a 1.2 m long runway as previously described1,39. Videos were acquired via a high-speed camera at 300 frames per second and analysed offline.
For induction of fast escape-like locomotion (gallop and bound) we used standardized air puffs (50 psi; 500 ms long) applied to the back of the animal when it was situated at the beginning of the corridor. The test was repeated 10 times with several minutes of rest between trials both before and after i.p. injection of CNO.
Behavioural test on a treadmill
Locomotion was analysed using a motorized transparent treadmill with adjustable speed range (Exer Gait XL, Columbus Instruments, USA). The animal was conditioned to locomote on the treadmill set at constant speed, in bouts of 20 seconds separated by 1–2 min inter-trial periods. Ventral plane videography was recorded at 100 frames per second. Each animal was tested at three different speeds: 0 – 4 cm/s, 4 – 20 cm/s, and > 20 cm/s before and after i.p. injection of CNO. The animal’s instantaneous speed was measured throughout the experiments by custom-made Matlab scripts with foot placement monitored from below.
Hole-board behavioural test
Exploratory behaviour was analysed using a modified version of the hole-board apparatus, consisting of test boxes made of transparent Plexiglas (45 cm × 45 cm × 41 cm) and a hole-board frame with 16 holes in a grid-pattern (2 cm diameter, 9 cm apart), placed 4 cm above the floor of the testing box. The apparatus was located in a testing room with dimmed illumination (40 lux). Odour-impregnated bedding from cages of the same gender, which is strong exploratory motivators, was placed below the hole-board frame. To reduce habituation due to multiple trials, new social odour sources were placed under the hole-board platform for every new trial. During the experimental sessions, the experimenters knew whether he/she injected saline or CNO but was blind to whether the animal had virus or not –and the experimenter did not know the site of injection i.e. either CnF or PPN.
To induce exploration with stimulation of channelrhodopsin expressing Vglut2+ neurons the same hole-board set-up was used. Animals were first tested with the MotoRater and light activated responders were pre-selected for exploration tests. On test day, they were placed in the open field and stimulus parameters were adjusted for each mouse in order to produce a locomotor response (typically 30 – 40 Hz, pulse duration 10 ms). The animals were then stimulated with trains of stimuli lasting 10 s and delivered at random intervals every 20 to 40 s, during the full length of the test.
Monosynaptically restricted trans-synaptic labelling
We used a glycoprotein (G)-deleted rabies virus (RVdG)23 pseudotyped with the envelope glycoprotein EnvA to allow selective infection of glutamatergic cells via the TVA receptor. The TVA receptor was delivered together with the Rabies glycoprotein conditionally to glutamatergic cells, by injecting 200 – 300 nl AAVdj-EF1a-FLEX-GTB virus (helper virus, Salk Institute, visualized in green in Fig. 6a) in either CnF or PPN in Vglut2Cre mice. Two weeks after the helper virus injection, 200 – 300 nl of an EnvA G-Deleted Rabies-mCherry (Salk Institute) was injected at the same location. Finally, one week after injection of the rabies virus animals were transcardially perfused and the tissue analysed (see below).
Anterograde labelling
For anterograde labelling, 50 – 100 nl of cell-filling AAVdj-EF1a-DIO-hChR2-p2A-mCherry-WPRE and AAVdj-Ef1a-DIO-hChR2-p2A-eYFP were injected in CnF and PPN, respectively. The animals were sacrificed 6 weeks after the injection.
Sectioning, histology, and imaging
Adult animals were anaesthetized with pentobarbital and perfused with 4 % (wg/vol) paraformaldehyde (PFA) in Phosphate-Buffered-Saline (PBS). Brains and spinal cords were dissected out and post-fixed for 3 hours in 4 % PFA. After fixation, tissues were rinsed in PBS, cryoprotected in 25 % (wg/vol) sucrose in PBS overnight and frozen in Neg-50™ embedding medium. Coronal sections (30 – 40 μm-thick) were cut on a cryostat.
Sections were permeabilised with PBS and 0.5 % (wg/vol) Triton X-100 (PBST) and blocked in PBST supplemented with 5 % (vol/vol) Normal Donkey Serum (NDS) (Jackson Immunoresearch) before being incubated for 24 to 48 hours at 4° C with one or several of the following primary antibodies diluted in PBST supplemented with 1 % NDS: chicken anti-GFP (1:1000, Abcam, ab13970), rabbit anti-mCherry (1:1000, Clontech 632496), goat anti-ChAT (1:100, Millipore AB144P), rabbit anti-Cre (1:8000, kind gift from Dr. G. Shutz –see Borgius et al.16). Secondary antibodies [F(ab′)2fragments] were obtained from Jackson Immunoresearch or Invitrogen, used at 1:500 and incubated for 3 h at room temperature in PBST 1 % NDS. A fluorescent Nissl stain (NeuroTrace Blue 435/455, 1:200, Life Technologies) was added during the primary antibody incubation. No antibody was required to detect the rabies-mCherry labelling. Slides were rinsed, mounted in Prolong Diamond Antifade mounting medium (Life Technologies) and scanned on LSM510 or LMS700 confocal laser scanning microscopes (Zeiss Microsystems) using 10x, 20x and 40x objectives.
Fluorescent in situ hybridization combined with immunofluorescence labelling was performed as previously described16 using a Vglut2 probe spanning the base pairs 540–983 (produced by Dr. L. Borgius).
Assessment of fibre placement and viral expression pattern
The assessment of the position of the optical fibre tip was based on the visible tract in the tissue. The extent of the virus expression in Vglut2Cre or VgatCre was evaluated by outlining the area of expression on sections from individual animals redrawn form a mouse brain atlas, and then by superimposing all animals at 30 % transparency to highlight the average expression in each group (see40). Mice with no successful bilateral injections in the DREADD experiments were excluded from the analysis.
Trans-synaptic labelling experiments
For trans-synaptic labelling experiments, all sections were serially collected spanning the whole brain, from the C1 vertebral level to the olfactory bulbs. Every third section was scanned for analysis. Each slice was captured with at least 2 channels: one for the Nissl staining and the other for the mCherry that allows detection of rabies infected neurons. In addition, a third channel was used to detect the GTB in primary infected neurons at the site of injection. The analysis consisted of two parts. First, anatomical landmarks were identified based on the Nissl staining and matched (affine transformation followed by cubic bi-spline transformation) to the Coordinate Framework (CCF v3) of the Allen Mouse Brain Atlas at 25 μm resolution with custom-made Matlab scripts. Second, single neurons were automatically detected based on pixel values above the first of 8 thresholds computed with the Otsu’s method. Then, the sections were manually checked to remove fluorescent counts that were inaccurately detected as neurons or to add neurons that were not detected automatically. Projection to the standardized Allen Mouse Brain Atlas was performed via the bi-spline maps computed in the first step. A contrast enhancement and a noise reduction filter were applied in ImageJ for publication images.
Gait data analysis
Videos were analysed using scripts written in Matlab (Mathworks Inc.). The speed of mice was detected by colour segmentation with respect to the background and compensated for the movement of the camera in the corridor, using the Lucas-Kanade method. Locomotor initiation was defined as mouse displacement with speeds greater than 3 cm/s. Gait analysis was performed with the same methods previously described 1,39. A step cycle was defined as a complete cycle of leg movement from the beginning of the stance phase (foot touch down) to the end of the swing phase (foot touch down again). The step frequency was defined as the inverse of the step cycle duration. All steps were divided into four main gaits based on footprint analysis. The classification of steps involved visual expectation followed by quantitative evaluation of limb coordination. For quantification, we identified the beginning of the stance phase (touch-down of the foot with the ground) and the beginning of the swing phase (lift-off of the foot from the ground) for all limbs in each step. Walk is defined as a pattern of limb movement where three or four feet are simultaneously on the ground (speed < 25 – 30 cm/s)1. Trot is characterized by a pattern of movement where diagonal pairs of limbs (e.g., left forelimb and right hindlimb) move forward simultaneously and homologous pairs of limbs (e.g., hindlimbs) are in alternation (speed 30 – 70 cm/s)1. Bound is a pattern of movement of the limbs where the animal move the forelimbs and hindlimbs in synchrony throughout the movement but with the fore and hindlimb moving out of phase (speed 80 – 150 m/s)1. Gallop is characterized by synchronized hindlimb movement and out of phase forelimb movement (speed 60 – 120 cm/s) 1.
Neuronal recordings and analysis
Linear arrays (NeuroNexus multi-site electrode - A1-X16-5 mm-100-413) were inserted in the CnF or PPN through a microscope. The animal was placed on a custom-built treadmill where the speed could be continuously changed. Movement of the treadmill, laser stimulation and array data were stored at 25 kHz on a TDT logger and analysed offline. The maximal speed of the treadmill that the animal could reliably follow in a head fixed experimental set-up was 30 cm/s. Spike sorting was performed offline by adjusting energy level in a superparamagnetic clustering algorithm (wave_clus41, https://github.com/csn-le/wave_clus). Spike trains were aligned either to the speed of the treadmill or to the onset of the optical stimulation. Neurons infected with ChR2 were detected by their fast and reproducible response to 20 ms pulses of blue light. The neuronal activity was quantified in a window from 10 ms before light onset to 5 ms after light onset. Neurons that showed a significant increase in the instantaneous frequency of firing in the ‘after-light-onset-period’ compared to ‘before-light-onset-period’ (p < 0.05, Sign-rank test) and had a short-latency response were considered CnF or PPN-Vglut2-ChR2-Ns. We calculated the instantaneous frequency of firing and speed of locomotion in 500 ms bins and quantified the relationship between firing rate and speed of treadmill by averaging the firing rate each 1 cm/s. A neuron was included as speed-related when it showed a significant correlation of the firing rate with respect to the speed of the treadmill (p < 0.01, Spearman correlation). A Speed Selectivity Index (SSI) was calculated as the absolute value of the average binned neuronal activity in specific speed ranges (e.g. up to 5 cm/s, from 5 to 10 cm/s, etc.) minus the average neuronal activity at rest, and then divided by their sum. This index weights how much the firing rate at a specific speed is stronger than the activity at rest. It is close to 1 when the firing rate at that given speed is highly different than baseline.
Tracking in hole-board
Head-dipping behaviour was recorded by a camera (30 frames/s) placed above the test box. Average speed, distance moved and duration of the head dips were measured using Ethovision software (Noldus Information Technology Inc.). The total number of head dips (hole visits) for each single hole was corrected by visual inspection of an experimenter blind to group and treatment. For optogenetically induced exploration data were collected in 10 s stimulus periods. Only trials where before light stimulation mice were exploring for less than 25 % of the time were included for the analysis to avoid adaptation of the behaviour.
Data availability
The data sets generated and/or analysed during the current study are available from the corresponding author on reasonable request.
Code availability
Code used for analysis is available from the corresponding author on reasonable request.
Statistics
Throughout the paper the level of significance is indicated as * for P < 0.05, ** for P < 0.01, *** P < 0.005. All statistical tests used were two-tailed. Exact statistical value less than P < 0.001 was reported as P < 0.001. We used non-parametric Kruskal-Wallis test for non-matched data or Friedman test for repeated measurements. Correction for multiple comparisons was performed with Bonferroni method. Custom scripts in MATLAB or R were used for the generation of graphs and statistical measurements. Whenever reported, data are medians and error bars indicate the 25th and 75th percentile of the distribution or otherwise specified.
Extended Data
Extended Data Figure 1. Speed control of locomotion from glutamatergic neurons in cuneiform and pedunculopontine nuclei.
a, b, Upper panels: Experimental set-ups. Middle panels: Colour plot of individual trails following stimulation of CnF- or PPN-Vglut2/ChR2-Ns (Figure 1). The x-axis represents time and the y-axis represents different trials obtained with different frequencies of stimulation. Data are aligned to onset of stimulation. The colour gradient illustrates speed, with dark blue representing no movement and colours towards yellow representing increase of speed (up to 120 cm/s) of the animal in the linear corridor. Lower panels: Speed profiles obtained as average of the movements at each stimulation frequency.
c, Latencies to onset of locomotion from stimulation of PPN- (red) and CnF-Vglut2/ChR2-Ns (blue) as a function of the stimulation frequency. Error bars indicate the 25th and 75th percentile of the distribution.
d, Post-stimulus locomotor speed plotted against pre-stimulus locomotor speed in Vglut2Cre mice injected with AAV-DIO-ChR2-mCherry in PPN (n = 50 from 4 mice).
e, Step frequency plotted against speed of locomotion for stimulation of PPN-Vglut2/ChR2-Ns (red circles, n = 84 from 5 mice) or CnF-Vglut2/ChR2-Ns (blue circles, n = 173 from 9 mice).
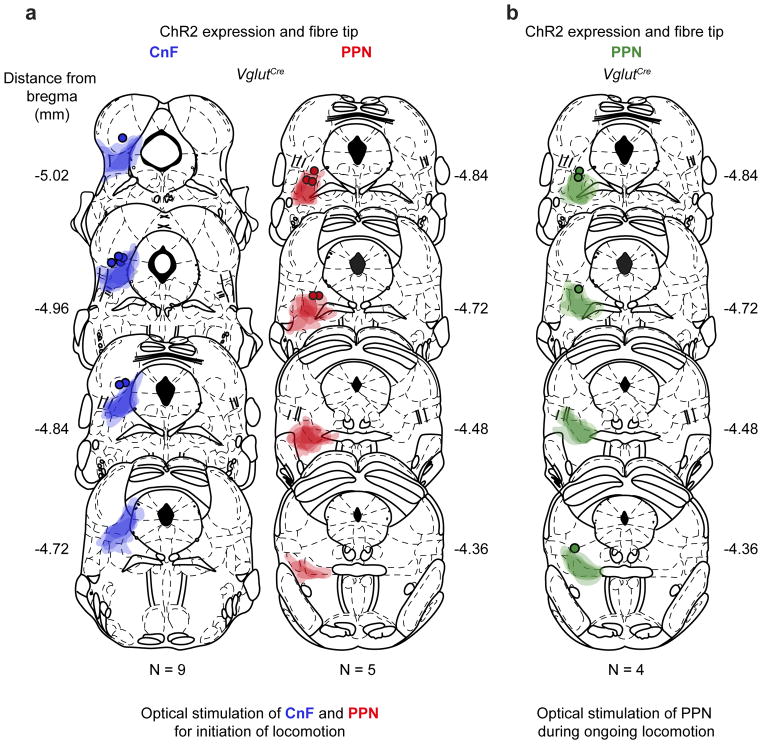
Extended Data Figure 2. Summary of ChR2 expression in CnF and PPN for behavioural data in Figure 1 and Extended Data Figure 1ab.
a, Expression of ChR2 and fibre tip positions in CnF (left) and PPN (right) for data in Figure 1 and Extended Figure 1a,b,c,e. Coronal brain sections with viral expression from injected Vglut2Cre mice where superimposed on sections redrawn from a mouse brain atlas 38. The dark contour colour indicates centre of expression while the lighter contour colour indicates the border of the most extended expression. Round dot indicates tip of the fibre.
b, Expression of ChR2 and fibre tip positions in PPN data in Extended Figure 1d.
The mouse brain schematics in this figure have been reproduced with permission from Elsevier 38.
Extended Data Figure 3. Activation of inhibitory neurons in CnF or PPN and cholinergic neurons in PPN does not initiate locomotion but may modulate on-going locomotion.
a–c, Top panels: Schematics showing the implantation of the optical fibre to stimulate inhibitory cells in CnF (a) and PPN (b), and cholinergic cells in PPN (c). AAV-DIO-ChR2 virus was injected in VgatCre mice to target inhibitory cells while cholinergic neurons expressed ChR2 transgenetically by crossing ChATCre with RC26-ChR2flx/flx mice. Experiments where performed 3 – 4 weeks after injection of virus with animals was locomoting spontaneously in a linear corridor. Middle and lower panels show colour plots where the x-axis represents time and the y-axis represents different trials of stimulation, when the animals were not locomoting (middle panels, “Still”) or when they were locomoting (lower panels, “Moving”) before the stimulation. Data are aligned to the onset of stimulation (dotted lines). The colour gradient illustrates speed, with dark blue representing no movement and colours towards yellow representing increase of speed (up to 60 – 80 cm/s) of the animal in the linear corridor.
Speed before vs after stimulation. CnF-Vgat-INs: from still, p > 0.05, Sign-rank test (two sided) (n = 18, N =2); when moving, from 27.9 cm/s to 4.2 cm/s p<0.05, Sign-rank test (n = 22, N = 2). PPN-Vgat-INs: from still, p > 0.05 (n = 5, N = 2); when moving from 27.6 cm/s vs. to 8.6 cm/s, p < 0.05 Sign-rank test (two sided) (n = 34, N = 2). Stimulation of long-projecting cholinergic cells in PPN: from still, p > 0.05, Sign-rank test (n = 102, N = 5); when moving: before 47.3 cm/s vs. after 22.9 cm/s, p < 0.05, Sign-rank test (two-sided) (n = 88, N = 5). Number of trials, n and animals, N.
d, Summary diagram of viral injection sites and fibre positions in VgatCre mice in CnF (left) and PPN (right).
e, Summary diagram for fibre positions in ChATCre mice.
The mouse brain schematics in this figure have been reproduced with permission from Elsevier 38.
Extended Data Figure 4. Summary diagram of iDREADD injection sites in CnF and PPN.
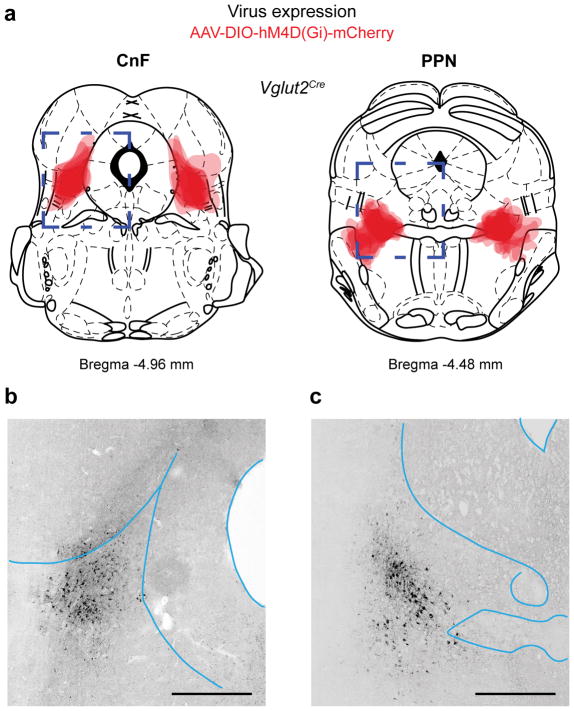
a, Expression of iDREADD in CnF (left – N = 9) or PPN-Vglut2-Ns (right, N = 9) for animals used in Figure 2.
b, Example of Coronal section showing expression pattern of iDREADD in CnF-Vglut2-Ns. Scale bar: 500 μm.
c, Coronal section showing expression pattern of iDREADD in PPN-Vglut2-Ns.
Scale bar: 500 μm.
The mouse brain schematics in this figure have been reproduced with permission from Elsevier 38.
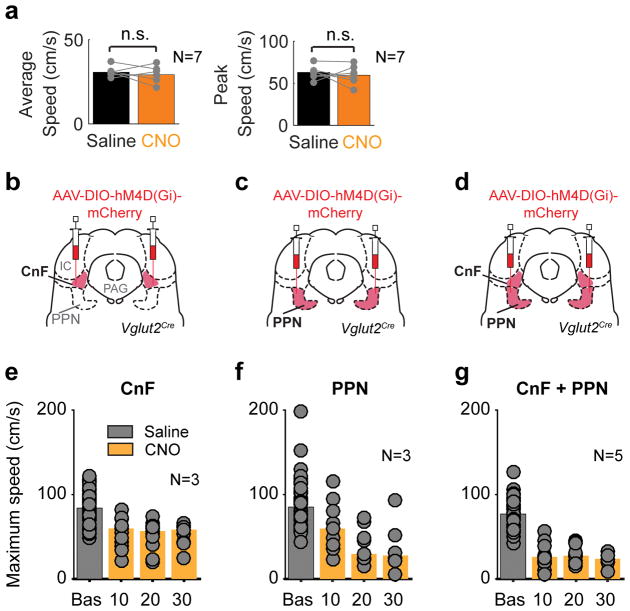
Extended Data Figure 5. Control for CNO injection and time course of silencing effect of glutamatergic neurons in the cuneiform and pedunculopontine nuclei.
a, Treadmill experiments with saline (black bar) and Clozapine-N-oxide (CNO) (orange bar) (1mg/kg) (right) injected i.p. in wild-type animals (N = 7). Average speeds to the left and peak speeds to the right. There was no significant difference in these parameters between saline and CNO sign-rank, two-sided (p > 0.45).
b–d, Diagrams of injections of AAV-DIO-hM4D(Gi)-mCherry in Vglut2Cre mice in CnF (b), PPN (c) or CnF+PPN (d). Clozapine-N-oxide (CNO) was injected i.p. and locomotor performance was tested on a treadmill.
e–g, Graphs show the development of the effect of the inhibition of glutamatergic cells in CnF (e, N=3), PPN (f, N=3) or CnF+PPN (g, N=5) on maximal locomotor speed over time. Grey bars, baseline. Orange bars, different time points after CNO administration. Points shows individual trials.
Extended Data Figure 6. Latencies for light-activation of PPN and CnF neurons and fractions of CnF and PPN-Vglut2/ChR2-Ns with speed related activity.
a, Latencies for light-activation of all cells included in the analysis.
b, Distribution of CnF-Vglut2/ChR2-Ns (blue bars, n=79/169) and PPN-Vglut2/ChR2-Ns (red bars, n=105/493) showing correlation of firing activity with locomotor speed of the animal. Grey bars show, in both panels, neurons with no significant correlation with the speed (Spearman correlation test p > 0.05).
Extended Data Figure 7. Summary of injection in PPN and CnF for hole-board stimulation experiments.
a, Expression of ChR2 and fibre tip positions in CnF (left) or PPN (right) for animals used in figure 5 d,e. The mouse brain schematics in this figure have been reproduced with permission from Elsevier 38.
Extended Data Figure 8. Connectivity between PPN and CnF.
a, b, AAV-EF1a-FLEX-GTB helper virus followed by EnvA G-deleted-Rabies-mCherry virus were unilaterally injected in the PPN (left, red) or the CnF (right, blue) in Vglut2Cre mice to trace inputs to glutamatergic neurons. a, Schematics summarising the inputs to PPN- Vglut2-Ns (red) and CnF-Vglut2-Ns (blue) neurons. The thickness of the arrows indicates the amount of connectivity based on the counts of the normalized number of neurons (b). Dashed arrows indicate sparse connectivity. CnF, cuneiform nucleus; IC, inferior colliculus; PAG, periaqueductal grey; PPN, pedunculopontine nucleus.
Extended Data Figure 9. The cuneiform and pedunculopontine nuclei have different descending output matrices.
a, Simultaneous unilateral injection (left) of AAV-DIO-ChR2 virus in the CnF (mCherry, red) and the PPN (eYFP, green) in Vglut2Cre animals (N = 3). Sagittal view of the brain (right) displaying the location in the brainstem (1 – 4) and spinal cord (5) of the coronal sections shown in c.
b, Coronal section showing ipsilateral (left side) and contralateral projection areas from glutamatergic CnF and PPN neurons.
c1–5, Schematics and coronal sections showing projection areas from glutamatergic PPN (left, green) and CnF (right, red) neurons onto nuclei in the pons, medulla and spinal cord. In the schematics, the darker shades delineate the areas with the highest density of projections. In coronal sections labelled processes are seen in black. Anatomical landmarks are indicated in the schematics. 4V, fourth ventricle; 7N, facial motor nucleus; IOM, inferior olive, medial nucleus; IRt, intermediate reticular nucleus; Gi, gigantocellular nucleus; GiA, gigantocellular reticular nucleus, alpha part; GiV, gigantocellular reticular nucleus, ventral part; IRt, intermediate reticular nucleus; LC, locus coeruleus; LPGi, lateral paragigantocellular nucleus; LRt, lateral reticular nucleus; MdV, medullary reticular nucleus, ventral part; PnC, pontine reticular nucleus, caudal part; PnV, pontine reticular nucleus, ventral part; py, pyramidal tract; pyx, pyramidal decussation; RMg, raphe magnus; RPa, raphe pallidus; ROb, raphe obscurus. The mouse brain schematics in this figure have been reproduced with permission from Elsevier 38. Scale bars, 200 μm.
Supplementary Material
Acknowledgments
The Research was supported by ERC-693030 grant (OK), NINDs NS 090919 (OK), The Swedish Medical Research Council (OK, GF), StratNeuro (OK) and Novo Nordisk Foundation Laureate Research grant NNF 15OC0014186 (OK). We would like to thank Peter Löw for assistance with viral work and Karl Deisseroth for providing viral ChR2 vectors.
Footnotes
Author Contributions
O.K. initiated the project. V. Caggiano, R.L., H.G.E. and O.K. designed the experiments with contribution from all authors. V. Caggiano and R.L. performed optogenetic experiments, in vivo recordings and analysis. C.B. and H.G.E. contributed to locomotor gait analysis and J.B. to initial optogenetic experiments. H.G.E. and D.M. were responsible for chemogenetic inactivation experiments together with R.L. and V. Caggiano and all analysed the data together with OK. H.G.E. and R.L. performed anatomical analysis together with V. Caggiano. V. Caldeira carried out in situ hybridizations. V. Caggiano and O.K. wrote the paper with contributions from all authors. O.K. supervised all aspects of the work.
The authors declare no competing financial interests.
References
- 1.Bellardita C, Kiehn O. Phenotypic characterization of speed-associated gait changes in mice reveals modular organization of locomotor networks. Current biology: CB. 2015;25:1426–1436. doi: 10.1016/j.cub.2015.04.005. [DOI] [PMC free article] [PubMed] [Google Scholar]
- 2.Grillner S. The motor infrastructure: from ion channels to neuronal networks. Nature reviews. Neuroscience. 2003;4:573–586. doi: 10.1038/nrn1137. [DOI] [PubMed] [Google Scholar]
- 3.Kiehn O. Decoding the organization of spinal circuits that control locomotion. Nature reviews. Neuroscience. 2016;17:224–238. doi: 10.1038/nrn.2016.9. [DOI] [PMC free article] [PubMed] [Google Scholar]
- 4.Grillner S, Jessell TM. Measured motion: searching for simplicity in spinal locomotor networks. Curr Opin Neurobiol. 2009;19:572–586. doi: 10.1016/j.conb.2009.10.011. [DOI] [PMC free article] [PubMed] [Google Scholar]
- 5.Brownstone RM, Wilson JM. Strategies for delineating spinal locomotor rhythm-generating networks and the possible role of Hb9 interneurones in rhythmogenesis. Brain research reviews. 2008;57:64–76. doi: 10.1016/j.brainresrev.2007.06.025. [DOI] [PMC free article] [PubMed] [Google Scholar]
- 6.Goulding M. Circuits controlling vertebrate locomotion: moving in a new direction. Nature reviews. Neuroscience. 2009;10:507–518. doi: 10.1038/nrn2608. [DOI] [PMC free article] [PubMed] [Google Scholar]
- 7.Jordan LM, Liu J, Hedlund PB, Akay T, Pearson KG. Descending command systems for the initiation of locomotion in mammals. Brain research reviews. 2008;57:183–191. doi: 10.1016/j.brainresrev.2007.07.019. [DOI] [PubMed] [Google Scholar]
- 8.Dubuc R, et al. Initiation of locomotion in lampreys. Brain research reviews. 2008;57:172–182. doi: 10.1016/j.brainresrev.2007.07.016. [DOI] [PubMed] [Google Scholar]
- 9.Takakusaki K, Chiba R, Nozu T, Okumura T. Brainstem control of locomotion and muscle tone with special reference to the role of the mesopontine tegmentum and medullary reticulospinal systems. Journal of neural transmission. 2016;123:695–729. doi: 10.1007/s00702-015-1475-4. [DOI] [PMC free article] [PubMed] [Google Scholar]
- 10.Shik ML, Severin FV, Orlovsky GN. Control of walking and running by means of electrical stimulation of the mesencephalon. Electroencephalography and clinical neurophysiology. 1969;26:549. [PubMed] [Google Scholar]
- 11.Garcia-Rill E, Hyde J, Kezunovic N, Urbano FJ, Petersen E. The physiology of the pedunculopontine nucleus: implications for deep brain stimulation. Journal of neural transmission (Vienna, Austria: 1996) 2015;122:225–235. doi: 10.1007/s00702-014-1243-x. [DOI] [PMC free article] [PubMed] [Google Scholar]
- 12.Ryczko D, Dubuc R. The multifunctional mesencephalic locomotor region. Current pharmaceutical design. 2013;19:4448–4470. doi: 10.2174/1381612811319240011. [DOI] [PubMed] [Google Scholar]
- 13.Martinez-Gonzalez C, Bolam JP, Mena-Segovia J. Topographical organization of the pedunculopontine nucleus. Frontiers in neuroanatomy. 2011;5:22. doi: 10.3389/fnana.2011.00022. [DOI] [PMC free article] [PubMed] [Google Scholar]
- 14.Roseberry TK, et al. Cell-Type-Specific Control of Brainstem Locomotor Circuits by Basal Ganglia. Cell. 2016;164:526–537. doi: 10.1016/j.cell.2015.12.037. [DOI] [PMC free article] [PubMed] [Google Scholar]
- 15.Wang HL, Morales M. Pedunculopontine and laterodorsal tegmental nuclei contain distinct populations of cholinergic, glutamatergic and GABAergic neurons in the rat. The European journal of neuroscience. 2009;29:340–358. doi: 10.1111/j.1460-9568.2008.06576.x. [DOI] [PMC free article] [PubMed] [Google Scholar]
- 16.Borgius L, Restrepo CE, Leao RN, Saleh N, Kiehn O. A transgenic mouse line for molecular genetic analysis of excitatory glutamatergic neurons. Molecular and cellular neurosciences. 2010;45:245–257. doi: 10.1016/j.mcn.2010.06.016. [DOI] [PubMed] [Google Scholar]
- 17.Machado AS, Darmohray DM, Fayad J, Marques HG, Carey MR. A quantitative framework for whole-body coordination reveals specific deficits in freely walking ataxic mice. 2015;4 doi: 10.7554/eLife.07892. [DOI] [PMC free article] [PubMed] [Google Scholar]
- 18.Lemieux M, Josset N, Roussel M, Couraud S, Bretzner F. Speed-Dependent Modulation of the Locomotor Behavior in Adult Mice Reveals Attractor and Transitional Gaits. Frontiers in neuroscience. 2016;10:42. doi: 10.3389/fnins.2016.00042. [DOI] [PMC free article] [PubMed] [Google Scholar]
- 19.Roth BL. DREADDs for Neuroscientists. Neuron. 2016;89:683–694. doi: 10.1016/j.neuron.2016.01.040. [DOI] [PMC free article] [PubMed] [Google Scholar]
- 20.Sternson SM, Roth BL. Chemogenetic tools to interrogate brain functions. Annual review of neuroscience. 2014;37:387–407. doi: 10.1146/annurev-neuro-071013-014048. [DOI] [PubMed] [Google Scholar]
- 21.Kliethermes CL, Crabbe JC. Pharmacological and genetic influences on hole-board behaviors in mice. Pharmacology, biochemistry, and behavior. 2006;85:57–65. doi: 10.1016/j.pbb.2006.07.007. [DOI] [PubMed] [Google Scholar]
- 22.File SE, Wardill AG. Validity of head-dipping as a measure of exploration in a modified hole-board. Psychopharmacologia. 1975;44:53–59. doi: 10.1007/BF00421184. [DOI] [PubMed] [Google Scholar]
- 23.Callaway EM, Luo L. Monosynaptic Circuit Tracing with Glycoprotein-Deleted Rabies Viruses. The Journal of neuroscience: the official journal of the Society for Neuroscience. 2015;35:8979–8985. doi: 10.1523/JNEUROSCI.0409-15.2015. [DOI] [PMC free article] [PubMed] [Google Scholar]
- 24.Wall NR, Wickersham IR, Cetin A, De La Parra M, Callaway EM. Monosynaptic circuit tracing in vivo through Cre-dependent targeting and complementation of modified rabies virus. Proceedings of the National Academy of Sciences of the United States of America. 2010;107:21848–21853. doi: 10.1073/pnas.1011756107. [DOI] [PMC free article] [PubMed] [Google Scholar]
- 25.Brandao ML, Anseloni VZ, Pandossio JE, De Araujo JE, Castilho VM. Neurochemical mechanisms of the defensive behavior in the dorsal midbrain. Neuroscience and biobehavioral reviews. 1999;23:863–875. doi: 10.1016/s0149-7634(99)00038-x. [DOI] [PubMed] [Google Scholar]
- 26.Lovick TA. The periaqueductal gray-rostral medulla connection in the defence reaction: efferent pathways and descending control mechanisms. Behavioural brain research. 1993;58:19–25. doi: 10.1016/0166-4328(93)90087-7. [DOI] [PubMed] [Google Scholar]
- 27.Liang H, Paxinos G, Watson C. Spinal projections from the presumptive midbrain locomotor region in the mouse. Brain structure & function. 2012;217:211–219. doi: 10.1007/s00429-011-0337-6. [DOI] [PubMed] [Google Scholar]
- 28.Ryczko D, et al. Forebrain dopamine neurons project down to a brainstem region controlling locomotion. Proceedings of the National Academy of Sciences of the United States of America. 2013;110:E3235–3242. doi: 10.1073/pnas.1301125110. [DOI] [PMC free article] [PubMed] [Google Scholar]
- 29.Skinner RD, Kinjo N, Ishikawa Y, Biedermann JA, Garcia-Rill E. Locomotor projections from the pedunculopontine nucleus to the medioventral medulla. Neuroreport. 1990;1:207–210. doi: 10.1097/00001756-199011000-00008. [DOI] [PubMed] [Google Scholar]
- 30.Costa RM. Plastic corticostriatal circuits for action learning: what’s dopamine got to do with it? Annals of the New York Academy of Sciences. 2007;1104:172–191. doi: 10.1196/annals.1390.015. [DOI] [PubMed] [Google Scholar]
- 31.Grillner S, Robertson B, Stephenson-Jones M. The evolutionary origin of the vertebrate basal ganglia and its role in action selection. The Journal of physiology. 2013;591:5425–5431. doi: 10.1113/jphysiol.2012.246660. [DOI] [PMC free article] [PubMed] [Google Scholar]
- 32.Friend DM, Kravitz AV. Working together: basal ganglia pathways in action selection. Trends in neurosciences. 2014;37:301–303. doi: 10.1016/j.tins.2014.04.004. [DOI] [PMC free article] [PubMed] [Google Scholar]
- 33.Sinnamon HM. Preoptic and hypothalamic neurons and the initiation of locomotion in the anesthetized rat. Progress in neurobiology. 1993;41:323–344. doi: 10.1016/0301-0082(93)90003-b. [DOI] [PubMed] [Google Scholar]
- 34.Graybiel AM, Grafton ST. The striatum: where skills and habits meet. Cold Spring Harbor perspectives in biology. 2015;7:a021691. doi: 10.1101/cshperspect.a021691. [DOI] [PMC free article] [PubMed] [Google Scholar]
- 35.Noga BR, Kriellaars DJ, Brownstone RM, Jordan LM. Mechanism for activation of locomotor centers in the spinal cord by stimulation of the mesencephalic locomotor region. Journal of neurophysiology. 2003;90:1464–1478. doi: 10.1152/jn.00034.2003. [DOI] [PubMed] [Google Scholar]
- 36.Drew T, Dubuc R, Rossignol S. Discharge patterns of reticulospinal and other reticular neurons in chronic, unrestrained cats walking on a treadmill. Journal of neurophysiology. 1986;55:375–401. doi: 10.1152/jn.1986.55.2.375. [DOI] [PubMed] [Google Scholar]
- 37.Capelli P, Pivetta C, Soledad Esposito M, Arber S. Locomotor speed control circuits in the caudal brainstem. Nature. 2017;551:373–377. doi: 10.1038/nature24064. [DOI] [PubMed] [Google Scholar]
- 38.Franklin KBJ, Paxinos G. Academic Press; Amsterdam; Boston: 2008. [Google Scholar]
- 39.Bouvier J, et al. Descending Command Neurons in the Brainstem that Halt Locomotion. Cell. 2015;163:1191–1203. doi: 10.1016/j.cell.2015.10.074. [DOI] [PMC free article] [PubMed] [Google Scholar]
- 40.Tovote P, et al. Midbrain circuits for defensive behaviour. Nature. 2016;534:206–212. doi: 10.1038/nature17996. [DOI] [PubMed] [Google Scholar]
- 41.Quiroga RQ, Nadasdy Z, Ben-Shaul Y. Unsupervised spike detection and sorting with wavelets and superparamagnetic clustering. Neural computation. 2004;16:1661–1687. doi: 10.1162/089976604774201631. [DOI] [PubMed] [Google Scholar]
Associated Data
This section collects any data citations, data availability statements, or supplementary materials included in this article.
Supplementary Materials
Data Availability Statement
The data sets generated and/or analysed during the current study are available from the corresponding author on reasonable request.


