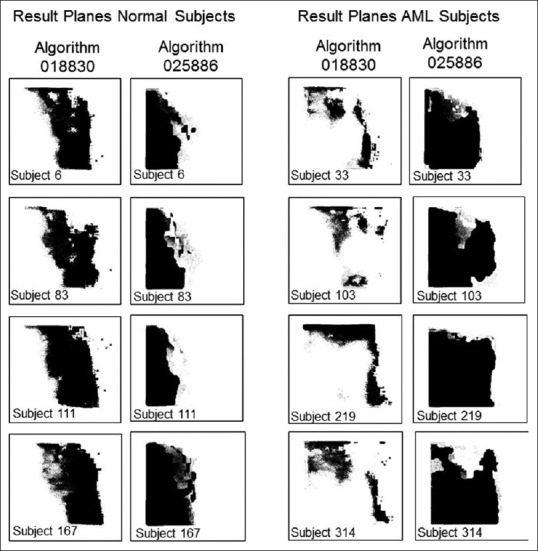
Figure 2.

Representative result planes obtained by applying mathematical algorithms 018330 and 025886 to flow cytometry Flexible Image Transport System files from normal subjects #6, #83, #11 and #167 (left) and acute myeloid subjects #33, #103, #219 and #314. Result planes from all normal and acute myeloid leukemia subjects are shown in Supplementary Figures 1 (3.6MB, pdf) and 2 (3.2MB, pdf) , respectively
