

Abstract
Background:
As a major complication after orthotopic liver transplantation (OLT), the occurrence of acute kidney injury (AKI) is frequently defined by serum creatinine (Cr); however, the accuracy of commonly used blood urea nitrogen (BUN), uric acid (UA), and β2-microglobulin (β2-MG) remains to be explored. This retrospective study compared the accuracy of these parameters for post-OLT AKI evaluation.
Methods:
Patients who underwent OLT in three centers between July 2003 and December 2013 were enrolled. The postoperative AKI group was diagnosed by the Kidney Disease Improving Global Outcomes (KDIGO) criteria and classified by stage. Measurement data were analyzed using the t-test or Wilcoxon rank-sum test; enumerated data were analyzed using the Chi-square test or Fisher's exact test. Diagnostic reliability and predictive accuracy were evaluated using receiver operating characteristic (ROC) curve analysis.
Results:
This study excluded 976 cases and analyzed 697 patients (578 men and 119 women); the post-OLT AKI incidence was 0.409. Compared with the no-AKI group, the AKI group showed very significant differences in Model for End-stage Liver Disease score (14.74 ± 9.91 vs. 11.07 ± 9.54, Z = 5.404; P < 0.001), hepatic encephalopathy (45 [15.8%] vs. 30 [7.3%], χ2 = 12.699; P < 0.001), hemofiltration (28 [9.8%] vs. 0 [0.0%], χ2 = 42.171; P < 0.001), and 28-day mortality (23 [8.1%] vs. 9 [2.2%], χ2 = 13.323; P <0.001). Moreover, mean values of Cr, BUN, UA, and β2-MG in the AKI group differed significantly at postoperative days 1, 3, and 7 (all P < 0.001). ROC curve area was 0.847 of Cr for the detection of AKI Stage 1 (sensitivity 80.1%, specificity 75.7%, cutoff value 88.23 μmol/L), 0.916 for Stage 2 (sensitivity 87.6%, specificity 82.6%, cutoff value 99.9 μmol/L), and 0.972 for Stage 3 (sensitivity 94.1%, specificity 88.2%, cutoff value 122.90 μmol/L).
Conclusion:
The sensitivity and specificity of serum Cr might be a high-value indicator for the diagnosis and grading of post-OLT AKI.
Keywords: Acute Kidney Injury, Blood Urea Nitrogen, Creatinine, Liver Transplantation, Uric Acid, β2-Microglobulin
摘要
目的:
急性肾损伤(AKI)是原位肝移植(OLT)术后的主要并发症之一,目前多按血清肌酐(Cr)定义。然而,常用的尿 素氮(BUN),尿酸(UA)和β2-微球蛋白(β2-MG)的准确性也有待探讨。本研究通过回顾性比较,评价这些指标在OLT 术后AKI的准确性价值。
方法:
收集2003年7月至2013年12月在三家医疗中心行肝移植手术患者的病例。根据改善全球肾脏病预后组织(KDIGO)标准 对术后AKI进行定义和分级。组间比较时,计量资料采用t检验或Wilcoxon秩和检验,计数资料采用卡方检验或Fisher检验。根 据受试者工作特征曲线(ROC),分析其诊断可靠性和预测准确性。
结果:
排除976例后,697例(男578例,女119例)资料纳入研究。其中,术后AKI的总体发生率为40.9%。与非AKI组比 较,AKI组在MELD评分(14.74 ± 9.91 vs. 11.07 ± 9.54,Z= 5.404;P <0.001),肝昏迷 [45 (15.8%) vs. 30 (7.3%), χ2 = 12.699, P <0.001],血液滤过[28 (9.8%) vs. 0 (0.0%), χ2 = 42.171, P <0.001] 和28天死亡率[23 (8.1%) vs. 9 (2.2%), χ2 = 13.323, P <0.001] 方面均明显增高。AKI组Cr、BUN、UA和β2-MG的均值在术后1、3和7天也显著增高(P均< 0.001)。Cr 评价AKI-1级的曲线下面积为0.847(敏感性80.1%,特异性75.7%,临界值88.23 μmol/L),AKI-2级为0.916(敏感性87.6%,特 异性82.6%,最佳截点99.91 μmol/L),AKI-3级为0.972(敏感性94.1%,特异性88.2%,最佳截点122.90 μmol/L)。
结论:
在原位肝移植术后AKI分级诊断中,血清Cr是一个敏感性和特异性均较高得指标。
INTRODUCTION
Acute kidney injury (AKI) is a potentially serious complication of orthotopic liver transplantation (OLT). Rahman et al.[1] and Hilmi et al.[2] reported the incidence of AKI as 0.500 (n = 116) and 0.521 (n = 424) at 24 h and 72 h after OLT, respectively. Klaus et al.[3] found an AKI rate of 0.566 (n = 113) during hospitalization. Serum creatinine (Cr) is the main predictor for AKI. However, Modi et al.[4] demonstrated that Cr was not significantly altered when the estimated glomerular filtration rate (eGFR) varied between 40 and 70 ml·min−1·1.73 m−2. Overreliance on GFR or Cr may lead to a delay or hinder an earlier intervention for AKI.[5,6] Besides Cr, blood urea nitrogen (BUN) can be a common indicator of AKI, as BUN >26.78 mmol/L (750 mg/L) was shown to be an independent risk factor of postoperative mortality in AKI patients underwent to dialysis.[7] Uric acid (UA) also showed potential as an early predictor of AKI.[8,9] β2-microglobulin (β2-MG) could effectively predict the long-term mortality and graft loss in renal transplant recipients[10] and accurately predicted eGFR reduction after transplantation (area under the curve [AUC] = 0.910).[11] Moreover, β2-MG was significantly elevated at 24 h after liver transplantation, which could be an effective predictor of early acute renal failure.[12] Although Cr is considered the gold standard for evaluating AKI, it remains undetermined whether Cr offers advantages in the assessment of AKI patients who undergo OLT or if there are prominent aspects of BUN, UA, or β2-MG as sensitive and specific biomarkers for the determination of post-OLT AKI. Therefore, this retrospective study aimed to identify the reference values of Cr, BUN, UA, and β2-MG for the evaluation of post-OLT AKI.
METHODS
Ethical approval
The study was conducted in accordance with the Declaration of Helsinki and was approved by the local ethics committee of the institute. As a retrospective study, the institutional ethics review board waived the requirement for written informed consent.
Patients
Between July 2003 and December 2013, patients who underwent OLT in Beijing Chao-Yang Hospital, Capital Medical University, the General Hospital of the Chinese People's Armed Police Forces, and Beijing You An Hospital, Capital Medical University, were collected. The inclusion criteria were patients undergoing OLT with end-stage liver disease (ESLD); men or women; 18 years of age and older; serum values of Cr, BUN, UA, and β2-MG measured pre- (baseline) and postoperative days (PODs) 1, 3, and 7. Cases with too-short a survival time (death within 3 days), patients who underwent simultaneous liver and kidney transplantation, and incomplete serum values were excluded. Age, gender, weight, hemoglobin (Hb), Model for End-Stage Liver Disease (MELD) score, causes of OLT, comorbidities, surgical type, renal replacement therapy (RRT), 28-day mortality, incidence of AKI, and serum characteristics were described.
Acute kidney injury definition
The current Kidney Disease Improving Global Outcomes (KDIGO, 2012) diagnostic criteria propose a diagnostic definition and classification of AKI on the basis of the Risk, Injury, Failure, Loss of Kidney Function, and End-Stage Renal Failure, 2002 and Acute Kidney Injury Network, 2004 criteria.[13] Hence, the discriminatory improvement of KDIGO classification could be significantly improved the early judgment of AKI through a reduction in the rate of misdiagnosis.[14,15]
Postoperative AKI was diagnosed based on the KDIGO Cr-AKI standard as follows: Cr increase of ≥26.5 μmol/L (3 mg/L) within 48 h or 50–99% Cr rise from baseline (1.50–1.99 higher), which was known or presumed to have occurred within the previous 7 days (AKI Stage 1); 100–199% Cr rise from baseline within 7 days (2.00–2.99 higher, AKI Stage 2); Cr ≥353.6 μmol/L (40 mg/L) or an increase in Cr to three times higher than baseline, or the initiation of RRT (AKI Stage 3); if these criteria were not met, the patients were defined as normal and classified into the no-AKI group. The baseline serum values were defined as the data on the last day of surgery, or within 7 days before the operation, if there were no values available at admission.[16] The AKI and no-AKI groups were determined from the occurrence of AKI. In accordance with the highest level of ascending Cr, each patient corresponded to one AKI grade on each day. Three groups were defined by the occurrence and classification of AKI: Stage 1, Stage 2, and Stage 3. Moreover, the diagnostic sensitivities and specificities of Cr, BUN, UA, and β2-MG were described based on the analysis of receiver operating characteristic (ROC) curves.
Statistical analysis
The EpiData software (version 3.0, The EpiData Association, DK5230 Odense M, Denmark) was used for data management, and the SAS statistical software (version 9.4, SAS Institute, Cary, NC, USA) was used to compute the statistical analyses to compare the baseline situation, postoperative characteristics, and AKI stages.
Categorical variables were described by the frequency and percentile. Continuous variables with a normal distribution were presented as the mean ± standard deviation (SD); otherwise, they were expressed as the median with 25th–75th percentiles (Q1, Q3). Measurement data were analyzed using the t-test or Wilcoxon rank-sum test; enumerated data were analyzed by the Chi-square test or Fisher's exact test. MedCalc software (version 11.4.2.0; Mariakerke, Belgium) was used to compare the diagnostic accuracy by ROC curve analysis. This analysis compared the values of Cr, BUN, UA, and β2-MG in each AKI stage by the Hanley and McNeil (1982) methodology with plotted AUC values. Sensitivities, specificities, 95% confidence intervals (95% CI), positive predictive value (PPV), negative predictive value (NPV), and cutoff value (the point of highest average of sensitivity and specificity) were calculated. The ROC curve analysis indicated that a 95% CI lower limit of an AUC >0.8 was acceptable. Statistical significance was defined as P < 0.05 (two-tailed).
RESULTS
After the excluding of 976 cases, a total of 697 patients were enrolled. For those excluded cases, 952 contained incomplete or missing serum values, 21 cases were for patients younger than 18 years old, and three cases were simultaneous liver and kidney transplantation [Figure 1].
Figure 1.
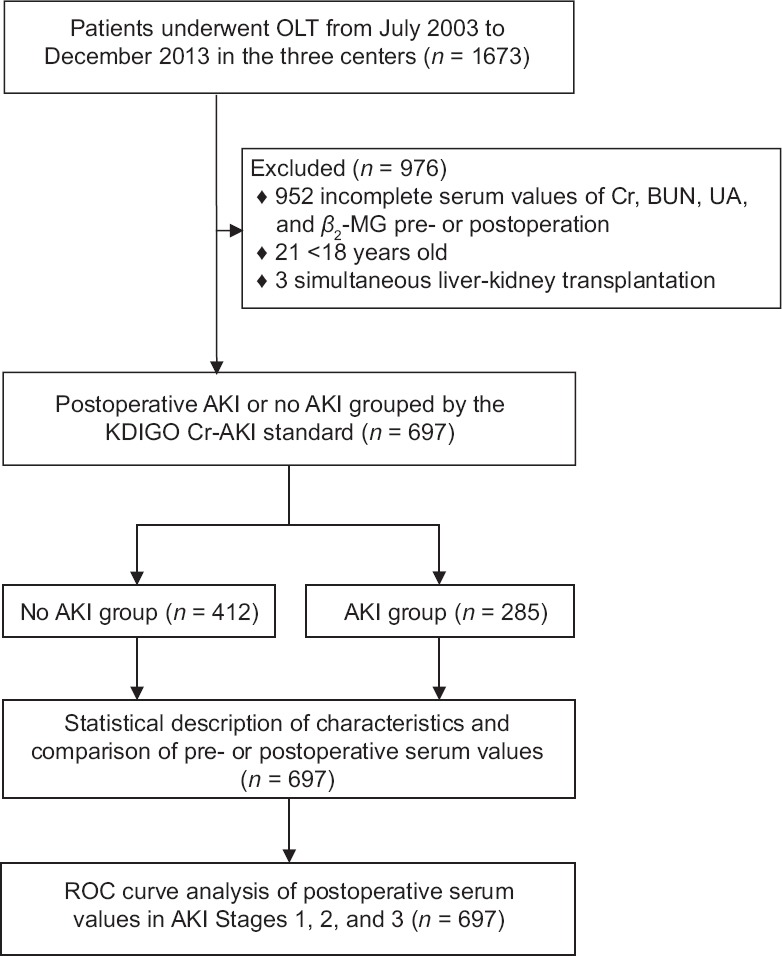
Study flowchart outlining enrollment, group division, and data analysis procedure. OLT: Orthotopic liver transplantation; Cr: Creatinine; BUN: Blood urea nitrogen; UA: Uric acid; β2-MG: β2-microglobulin; AKI: Acute kidney injury; ROC: Receiver operating characteristic.
The preoperative characteristics are shown in Table 1. The study included 578 (82.9%) men and 119 (17.1%) women; the mean age of patients was 48.2 ± 11.4 years; the mean weight was 68.42 ± 14.29 kg; the mean Hb was 105.86 ± 24.62 g/L; and the mean MELD score was 12.57 ± 9.69. Moreover, the mean incidence of HBV-related cirrhosis, anemia, ascites, and classic OLT was 71.2%, 67.3%, 67.6% and 88.1%, respectively. The overall incidence of post-OLT AKI was 40.9% (285 of 697), of which Stages 1, 2, and 3 accounted for 150 (21.5%), 61 (8.8%), and 74 (10.6%), respectively. Compared with the no-AKI group, the AKI group showed statistically significant differences in body weight (70.31 ± 14.53 kg vs. 67.12 ± 13.99 kg, Z = 2.537; P = 0.011), Hb (102.60 ± 24.37 g/L vs. 108.11 ± 24.79 g/L, Z = −2.962, P = 0.003), hepatitis C (27 [9.5%] vs. 21 [5.1%], χ2 = 5.032, P = 0.025), liver cancer (15 [5.3%] vs. 48 [11.6%], χ2 = 8.360, P = 0.004), liver failure (18 [6.3%] vs. 10 [2.4%]), χ2 = 6.607, P = 0.010), anemia (212 [74.4%] vs. 257 [62.4%]; P = 0.002), hypoalbuminemia (111 [38.9%] vs. 123 [29.9%], χ2 = 6.255, P = 0.044), hypertension (26 [9.1%] vs. 16 [3.9%], χ2 = 8.166, P = 0.004), diabetes (18 [6.3%] vs. 13 [3.2%], χ2 = 3.959, P = 0.047), hepatorenal syndrome (14 [4.9%] vs. 8 [1.9%], χ2 = 4.863, P = 0.027), classic-OLT (241 [84.6%] vs. 373 [90.5%], χ2 = 5.729, P = 0.017), and hemodialysis (4 [1.4%] vs. 0 [0.0%], P = 0.028). In contrast, very significant differences were observed in MELD score (14.74 ± 9.91 vs. 11.07 ± 9.54, Z = 5.404, P < 0.001), hepatic encephalopathy (45 [15.8%] vs. 30 [7.3%], χ2 = 12.699, P < 0.001), hemofiltration (28 [9.8%] vs. 0 [0.0%], χ2 = 42.171, P < 0.001), and 28-day mortality (23 [8.1%] vs. 9 [2.2%], χ2 = 13.323, P < 0.001).
Table 1.
Comparison of baseline characteristics among all patients before and after OLT
| Variables | No AKI (n = 412) | AKI (n = 285) | Statistics | P |
|---|---|---|---|---|
| Demography | ||||
| Gender | 0.296* | 0.586 | ||
| Male | 339 (82.3) | 239 (83.9) | ||
| Female | 73 (17.7) | 46 (16.1) | ||
| Age (years) | 48.05 ± 11.55 | 48.44 ± 11.20 | 0.457† | 0.648 |
| Weight (kg) | 67.12 ± 13.99 | 70.31 ± 14.53 | 2.537† | 0.011 |
| Hb (g/L) | 108.11 ± 24.79 | 102.60 ± 24.37 | −2.962† | 0.003 |
| MELD score | 11.07 ± 9.54 | 14.74 ± 9.91 | 5.404† | <0.001 |
| Causes of OLT | ||||
| HBV-related cirrhosis | 283 (68.7) | 213 (74.7) | 3.002* | 0.083 |
| Chronic severe hepatitis | 40 (9.7) | 40 (14.0) | 3.103* | 0.078 |
| Hepatitis C | 21 (5.1) | 27 (9.5) | 5.032* | 0.025 |
| Liver cancer | 48 (11.7) | 15 (5.3) | 8.360* | 0.004 |
| Alcoholic cirrhosis | 14 (3.4) | 10 (3.5) | 0.006* | 0.937 |
| Liver failure (acute and chronic) | 10 (2.4) | 18 (6.3) | 6.607* | 0.010 |
| Comorbidities | ||||
| Anemia | 257 (62.4) | 212 (74.4) | – | 0.002 |
| Ascites | 268 (65.1) | 203 (71.2) | 2.936* | 0.087 |
| Hypoalbuminemia | 123 (29.9) | 111 (39.0) | 6.255* | 0.044 |
| Upper gastrointestinal bleeding | 82 (19.9) | 58 (20.4) | 0.021* | 0.885 |
| Hypertension | 16 (3.9) | 26 (9.1) | 8.166* | 0.004 |
| Diabetes | 13 (3.2) | 18 (6.3) | 3.959* | 0.047 |
| Lung infection | 30 (7.3) | 30 (10.5) | 2.254* | 0.133 |
| Hepatorenal syndrome | 8 (1.9) | 14 (4.9) | 4.863* | 0.027 |
| Hepatic encephalopathy | 30 (7.3) | 45 (15.8) | 12.699* | <0.001 |
| Types of OLT | ||||
| Classic | 373 (90.5) | 241 (84.6) | 5.729* | 0.017 |
| Piggyback | 39 (9.5) | 44 (15.4) | ||
| RRT | ||||
| Hemodialysis | 0 (0.0) | 4 (1.4) | – | 0.028 |
| Hemofiltration | 0 (0.0) | 28 (9.8) | 42.171* | <0.001 |
| 28-day mortality | 9 (2.2) | 23 (8.1) | 13.323* | <0.001 |
Data are presented as n (%), mean ± SD. * χ2 values; †Z values. –: Not applicable; OLT: Orthotopic liver transplantation; AKI: Acute kidney injury (defined by the KDIGO Clinical Practice Guideline and classified stages); Hb: Hemoglobin; MELD: Model for end-stage liver disease; HBV: Hepatitis B virus; Anemia: Hb <130 g/L (male) or <120 g/L (female); Hypoalbuminemia: Serum albumin <35 g/L or total protein <60 g/L; RRT: Renal replacement therapy; SD: Standard deviation; KDIGO: Kidney Disease Improving Global Outcomes.
Compared with baseline, the mean values of Cr, BUN, UA, and β2-MG in the AKI or no-AKI groups at PODs 1, 3, and 7 showed statistically significant differences (all P < 0.001), except for Cr in the no-AKI group at POD 1 (68.90 ± 27.56 μmol/L vs. 71.46 ± 51.31 μmol/L, t = 2149.00; P = 0.283) and β2-MG in the no-AKI group at POD 3 (23.56 ± 12.88 μmol/L vs. 25.00 ± 14.24 μmol/L, t = −4185.00; P = 0.011) and POD 7 (25.59 ± 14.15 μmol/L vs. 25.00 ± 14.24 μmol/L, t = 3089.00; P = 0.050). The mean values in the AKI group showed an increasing trend from baseline. The highest mean value of Cr occurred at POD 1, and BUN at POD 3, and UA or β2-MG at POD 7. In contrast, the mean values in the no-AKI group decreased initially and recovered to near baseline values at POD 7 (Cr, UA, and β2-MG), except for BUN, which first increased and then decreased very obviously. There were no statistically significant differences in baseline values between the AKI and no-AKI groups for Cr (63.0 [19.0, 82.7] μmol/L vs. 71.46 ± 51.31 μmol/L, Z = −0.579; P = 0.562), UA (262.01 ± 144.26 μmol/L vs. 268.43 ± 117.36 μmol/L, t = −1.645; P = 0.100), and β2-MG (29.49 ± 21.86 μmol/L vs. 25.00 ± 14.24 μmol/L, t = 1.689; P = 0.091); however, a significant difference was observed for BUN (6.90 ± 4.88 mmol/L vs. 6.19 ± 4.81 mmol/L, t = 2.029; P = 0.043). In addition, Cr, BUN, UA, and β2-MG were very significantly different at PODs 1, 3, and 7 (all P < 0.001, Table 2).
Table 2.
Comparison of serum values among all patients before and after OLT
| Values | Time points | No AKI (n = 412) | AKI (n = 285) | t/Z | P |
|---|---|---|---|---|---|
| Cr (µmol/L) | Baseline | 71.46 ± 51.31 | 63.0 (19.0, 82.7) | −0.579* | 0.562 |
| POD 1 | 68.90 ± 27.56 | 123.99 ± 79.32 | 12.871 | <0.001 | |
| POD 3 | 64.04 ± 24.91 | 122.15 ± 106.32 | 11.936 | <0.001 | |
| POD 7 | 60.96 ± 22.79 | 108.27 ± 96.78 | 10.222 | <0.001 | |
| BUN (mmol/L) | Baseline | 6.19 ± 4.81 | 6.90 ± 4.88 | 2.029 | 0.043 |
| POD 1 | 10.78 ± 5.41 | 16.95 ± 9.35 | 9.522 | <0.001 | |
| POD 3 | 13.85 ± 8.12 | 22.45 ± 11.54 | 11.369 | <0.001 | |
| POD 7 | 10.52 ± 7.05 | 18.36 ± 11.92 | 10.360 | <0.001 | |
| UA (µmol/L) | Baseline | 268.43 ± 117.36 | 262.01 ± 144.26 | −1.645 | 0.100 |
| POD 1 | 223.32 ± 94.80 | 300.12 ± 134.09 | 7.293 | <0.001 | |
| POD 3 | 223.62 ± 128.80 | 301.94 ± 146.42 | 7.222 | <0.001 | |
| POD 7 | 240.02 ± 111.26 | 311.39 ± 162.44 | 5.387 | <0.001 | |
| β2-MG (µmol/L) | Baseline | 25.00 ± 14.24 | 29.49 ± 21.86 | 1.689 | 0.091 |
| POD 1 | 23.39 ± 14.41 | 38.47 ± 28.14 | 8.682 | <0.001 | |
| POD 3 | 23.56 ± 12.88 | 38.81 ± 30.42 | 7.483 | <0.001 | |
| POD 7 | 25.59 ± 14.15 | 40.42 ± 31.69 | 7.492 | <0.001 |
Data are presented as mean ± SD or median (Q1,Q3). *Z values, otherwise t values. OLT: Orthotopic liver transplantation; AKI: Acute kidney injury; Cr: Creatinine; BUN: Blood urea nitrogen; UA: Urea acid; β2-MG: β2-microglobulin; POD: Postoperative day; SD: Standard deviation.
Table 3 and Figures 2–4 show the data of the ROC curve analysis. When Cr was used as a predictor for AKI Stage 1, the AUC was 0.847 (sensitivity 80.1%, specificity 75.7%, and cutoff value 88.23 μmol/L) and increased to 0.916 (sensitivity 87.6%, specificity 82.6%, and cutoff value 99.91 μmol/L) and 0.972 (sensitivity 94.1%, specificity 88.2%, and cutoff value 122.90 μmol/L) for AKI Stages 2 and 3, respectively. For BUN, the AUC was 0.713 for AKI Stage 1 and 0.799 for AKI Stage 2, but increased to 0.864 for AKI Stage 3 (sensitivity 82.9%, specificity 75.2%, and cutoff value 17.19 mmol/L). The AUCs were not sufficient for UA prediction, which were calculated as 0.703, 0.723, and 0.755 for AKI Stages 1, 2, and 3, respectively. When predicted by β2-MG, the AUC was as low as 0.686 for AKI Stage 1, and 0.775 for AKI Stage 2, but increased to 0.848 for AKI Stage 3 (sensitivity 81.1%, specificity 82.8%, and cutoff value 43.90 μmol/L). Overall, the PPV and the NPV of Cr in AKI stages were better than other three indicators. The PPV was shown to have a large range; as the prevalence decreased from AKI Stage 1 (150 [21.5%]) to Stage 3 (74 [10.6%]), the value of PPV for Cr decreased from 0.503 to 0.227. In contrast, the NPV was slightly increased by the prevalence, with a lower prevalence leading to a higher value of NPV, such as 0.925 for Cr in AKI Stage 1 or 0.998 in Stage 3.
Table 3.
Criterion values of the ROC curve in the three groups defined by AKI stages
| Groups | Variables | AUC (SE) | 95% CI | Sensitivity (%) | Specificity (%) | Cutoff value | PPV | NPV |
|---|---|---|---|---|---|---|---|---|
| AKI Stage 1 | Cr | 0.847 (0.010) | 0.832–0.861 | 80.1 | 75.7 | 88.23 | 50.3 | 92.5 |
| BUN* | 0.713 (0.014) | 0.695–0.731 | 54.2 | 77.5 | 16.11 | 42.6 | 84.6 | |
| UA | 0.703 (0.013) | 0.684–0.721 | 64.8 | 67.3 | 258.16 | 38.4 | 85.9 | |
| β2-MG | 0.686 (0.014) | 0.666–0.704 | 60.8 | 69.6 | 28.73 | 35.7 | 86.5 | |
| AKI Stage 2 | Cr | 0.916 (0.012) | 0.905–0.927 | 87.6 | 82.6 | 99.91 | 32.6 | 98.6 |
| BUN* | 0.799 (0.017) | 0.782–0.815 | 71.7 | 76.0 | 16.76 | 22.4 | 96.5 | |
| UA | 0.723 (0.021) | 0.704–0.741 | 65.0 | 71.1 | 285.53 | 18.8 | 95.2 | |
| β2-MG | 0.775 (0.019) | 0.758–0.792 | 79.6 | 65.0 | 27.88 | 16.7 | 97.3 | |
| AKI Stage 3 | Cr | 0.972 (0.008) | 0.965–0.978 | 94.1 | 88.2 | 122.90 | 22.7 | 99.8 |
| BUN* | 0.864 (0.021) | 0.850–0.878 | 82.9 | 75.2 | 17.19 | 11.0 | 99.2 | |
| UA | 0.755 (0.032) | 0.737–0.772 | 55.9 | 85.8 | 374.75 | 12.8 | 98.1 | |
| β2-MG | 0.848 (0.030) | 0.832–0.862 | 81.1 | 82.8 | 43.90 | 12.9 | 99.3 |
*The unit of BUN concentration is mmol/L, others are µmol/L. AKI: Acute kidney injury (defined by the KDIGO Clinical Practice Guideline and classified stages); ROC: Receiver operating characteristic; AUC: Area under the curve; Cr: Creatinine; BUN: Blood urea nitrogen; UA: Uric acid; β2-MG: β2-microglobulin. SE: Standard error; CI: Confidence interval; Cutoff value: The point of highest average of sensitivity and specificity; PPV: Positive predictive value; NPV: Negative predictive value; KDIGO: Kidney Disease Improving Global Outcomes.
Figure 2.
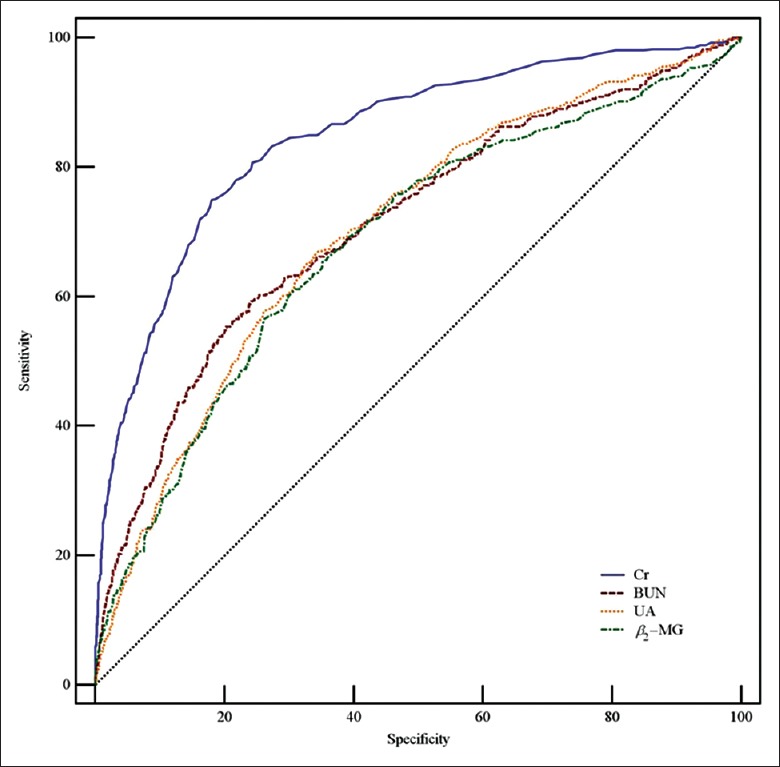
ROC curves of serum Cr, BUN, UA, and β2-MG in AKI Stage 1. AUCs of Cr, BUN, UA, and β2-MG were 0.847, 0.713, 0.703, and 0.686, respectively. ROC: Receiver operating characteristic; AUC: Area under the ROC curve; Cr: Creatinine; BUN: Blood urea nitrogen; UA: Uric acid; β2-MG: β2-microglobulin; AKI: Acute kidney injury.
Figure 4.
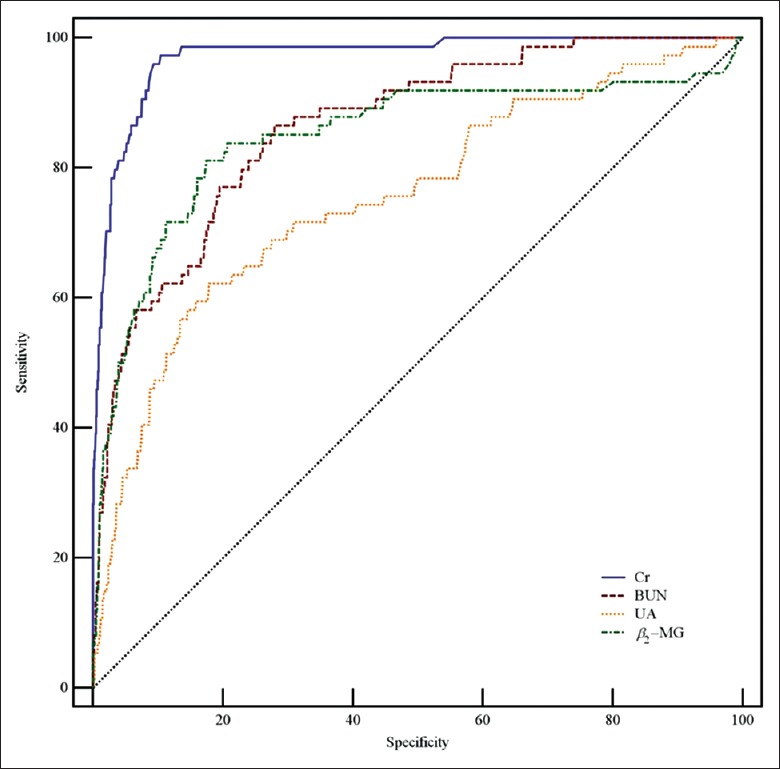
ROC curves of serum Cr, BUN, UA, and β2-MG in AKI Stage 3. AUCs of Cr, BUN, UA, and β2-MG were 0.972, 0.864, 0.755, and 0.848, respectively. ROC: Receiver operating characteristic; AUC: Area under the ROC curve; Cr: Creatinine; BUN: Blood urea nitrogen; UA: Uric acid; β2-MG: β2-microglobulin; AKI: Acute kidney injury.
Figure 3.
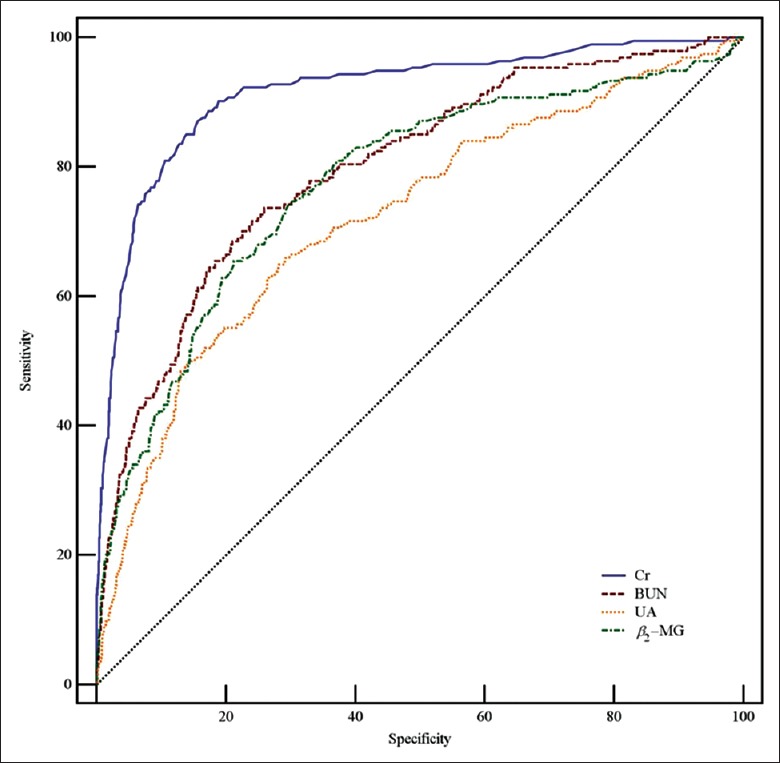
ROC curves of serum Cr, BUN, UA, and β2-MG in AKI Stage 2. AUCs of Cr, BUN, UA, and β2-MG were 0.916, 0.799, 0.723, and 0.775, respectively. ROC: Receiver operating characteristic; AUC: Area under the ROC curve; Cr: Creatinine; BUN: Blood urea nitrogen; UA: Uric acid; β2-MG: β2-microglobulin; AKI: Acute kidney injury.
DISCUSSION
AKI is one of the most common complications of critically ill patients. A study of 32,045 critically ill patients reported an incidence of AKI as high as 0.745.[17] AKI significantly increased hospitalization, especially in patients with one-year mortality.[18,19] The mechanism may be associated with a decline in renal function, such as the abrupt loss of kidney excretion of medium or low-molecular-weight serum products. Severe hypotension, renal insufficiency, ischemia, and hypoxia-induced AKI may be factors in renal dysfunction after liver transplantation.[20,21,22] In this study, the incidence of AKI was 40.9% (n = 697), which confirmed the prevalence of AKI after liver transplantation. Furthermore, hemofiltration was used very significantly in AKI patients with an incidence of 9.8% (28 of 285). Moreover, 75 (10.8%) patients were observed of hepatic encephalopathy. The development of hepatic encephalopathy, which is the debilitating complication of cirrhosis, is often unpredictable. However, the plasma ammonia levels and brain MRI findings could be used for early detection to avoid the most serious complication of widespread brain edema.[23] Zhu et al.[24] found that MELD score was very closely associated with AKI stages and the 28-day mortality of AKI patients was 15.5%. The MELD score and 28-day mortality were also found significantly higher in the AKI group in this study. Cr, BUN, UA, and β2-MG increased in the AKI group at PODs 1, 3, and 7, especially for BUN, which might reflect renal function with its highly variable value. However, this trend was not apparent in the no-AKI group [Table 2].
The value of Cr was increased immediately after OLT, with the peak mean occurring at POD 1 in the AKI group, confirming its suitability for the diagnosis of post-OLT AKI. Maiwall et al.[25] suggested that patients with acute or chronic liver failure with AKI had greater potential for prevention and early detection (48 h) and that Cr as low as 100.80 μmol/L (11.4 mg/L) should be considered of clinical intervention. In this study, the baseline level of Cr was 76.92 ± 67.20 μmol/L, which was lower than the value stated above. This can be advantageous for AKI evaluation with a lower Cr value at a high sensitivity, indicating that Cr provided a meaningful judgment at a sensitive value and was conducive to the evaluation of AKI. The AUC values demonstrated good performance for the sensitivity and specificity of Cr for distinguishing AKI stages. A better AUC index was found at higher AKI stages. Zongyi et al.[26] concluded that the elevation of preoperative Cr (>353.6 μmol/L [40 mg/L]) was an independent risk factor for post-OLT AKI.
BUN was increased significantly in the AKI and no-AKI groups at PODs 1 and 3. Izumi et al.[27] found that the elevation of BUN in adults to be greater than 4.98 mmol/L (140 mg/L) after living-donor liver transplantation was an independent risk factor for postoperative complications. Elgend et al.[28] analyzed child living-donor liver transplantation and reported that preoperative high BUN was an independent predictor of graft loss and death (hazard ratio: 1.046, 95% CI: 1.014–1.079; P = 0.005). High postoperative BUN might be related to protein metabolism, as liver transplantation patients usually had preoperative hypoalbuminemia (234 [33.6%]), and large amounts of albumins were infused intra- or postoperation, which would result in the production of more BUN by protein metabolism in the body. do Nascimento et al.[7] proposed that patients should be administered earlier dialysis treatment when BUN exceeded 26.78 mmol/L (750 mg/L). Palazzuoli et al.[29] indicated that BUN was a sensitive index for the prediction of AKI occurrence during hospitalization, with a threshold of 35.71 mmol/L (1000 mg/L; AUC = 0.77, sensitivity 65.0%, specificity 85.0%). In this study, the mean value of BUN was significantly lower than the above results, which suggests that BUN might not be a sensitive value for the determination of the broad changes that occur in AKI. The arrest time and the sensitive range of BUN in post-OLT patients should be discussed by more studies. Although the AUC analysis showed the good judgment of BUN for the discrimination of AKI Stage 3 (AUC = 0.864, sensibility 82.9%, specificity 75.2%, and cutoff value 17.2 mmol/L), the preoperative values of BUN were different at the baseline between the AKI and no-AKI groups (P < 0.05). Therefore, the use of BUN for the judgment of post-OLT AKI requires further confirmation by clinical data. In addition, the value of BUN was concluded to be as a neurotransmitter-activated biomarker rather than as a specific indicator of renal dysfunction.[30]
Significant differences in UA were found in the AKI and no-AKI groups, but the AUC analysis resulted in very ordinary accuracy for UA in distinguishing AKI grades. It should be mentioned that the cutoff value of UA for the distinction of AKI Stage 3 was 374.75 μmol/L, which was close to the result of Joung et al.[31] or Liang et al.,[32] who concluded that UA ≥386.65 μmol/L (65.0 mg/L) was an independent risk factor for postoperative AKI after cardiovascular surgery or 375.50 μmol/L for predicting AKI after severe burns. UA may have been increased before or during the operation and no sensitive postoperative changes were found. Cheungpasitporn et al.[9] believed that UA had already elevated when the patients were diagnosed with AKI at admission. The results of Gaipov et al.[8] and Liang et al.[32] validated the clinical significance of UA in the early evaluation of AKI. Hence, UA might have increased at a very early period and its value might not be able to show any significant change in the diagnosis of post-OLT AKI.
Compared with the no-AKI group, postoperative β2-MG significantly increased in the AKI group, with an increasing trend over time. Saito et al.[33] suggested that β2-MG might be a useful biomarker for the diagnosis of liver cirrhosis in patients with hepatocellular carcinoma, suggesting its utility in patients with liver dysfunction. Nozue et al.[34] found that baseline β2-MG was a useful predictor of contrast-induced nephropathy. Dong et al.[35] also confirmed that β2-MG positively correlated with Cr, BUN, and UA, and that it was closely related to liver and kidney function in healthy people. As can be seen from the AUC calculation, β2-MG was an accurate measure for the classification of AKI Stage 3 (AUC = 0.848, sensibility 81.1%, specificity 82.8%, and cutoff value 43.90 μmol/L). It was suggested that β2-MG might be a certain reference for the judgment of AKI Stage 3 after liver transplantation. However, the study of β2-MG was limited to special stage disease or specific range population. Foster et al.[36] proposed that β2-MG was a more valuable predictor of end-stage renal disease (ESRD) in patients with chronic renal failure than the eGFR converted by Cr. Herrero-Morin et al.[37] considered that the reference value of β2-MG was higher than that of Cr in the treatment of AKI and hemofiltration in critically ill children. Ashida et al.[38] believed that β2-MG was increased before Cr, which could be useful for the diagnosis of renal dysfunction after allogeneic bone marrow transplantation. Moreover, β2-MG was an independent risk factor for patients with type 2 diabetes and ESRD.[39] Collectively, this suggested that β2-MG offered advantages for the specific diagnosis for a certain subset of patients with critical nephropathy. However, clinical data will still be needed to support the value of judgment and the feasibility of β2-MG use in clinical applications.
In general, Cr is freely filtered at the glomerulus and secreted to varying degrees by the tubules, which is excreted mainly depending on the kidney. Kidney damage is asymptomatic in its early stages, but early detection by laboratory tests, such as Cr to GFR, can be commonly available. In the case of AKI, Cr might also backleak through the damaged renal tubular epithelium to the systemic circulation, and as Cr increased, glomerular secretion also increased. Therefore, renal dysfunction could be fairly well reflected by the elevated Cr level. For AKI definition, Cr was also very useful in the diagnosis of AKI owing to increased accuracy as the severity of postoperative AKI increased. This demonstrated the potential for prevention, accurate detection, and clear judgment of AKI stage classification or risk stratification. BUN can pass freely through the glomerulus, 40–70% is tubular reabsorption, and excludes mostly across membrane by kidney. However, BUN mainly from the protein, its concentration changed in a large range of values under the influence of liver function. Hence, there might be difficult to effectively reflect the glomerular function. In this study, postoperative BUN values increased to a particularly high level, which was good for clinical distinction and judgment; however, its sensitivity and specificity exhibited only a good reference in the diagnosis of post-OLT AKI Stage 3, might limit its clinical practicality. UA was considered as one of the causes of kidney damage and renal function progression. For kidney plays a major role in the regulation of UA level, hyperuricemia is mainly caused by the increase of its intake or its secretory defect due to the excessive deposition of crystals in the proximal tubular tubules. However, hyperuricemia was associated with renal injury, metabolic syndrome, diabetes, hypertension, and cardiovascular disease. The mechanisms of UA leading directly to kidney damage and values of the preoperative changes were not yet fully understood, and the underlying pathophysiological mechanisms are needed to be further studied and explained.[40] As a low-molecular-weight protein, β2-MG freely passes through the glomerular filtration membrane which is absorbed and degraded almost completely by the proximal tubules, without secretion by the tubules and return to the blood. Although a small amount of β2-MG might be filtered by the glomerular, the most were catabolized in the tubules, differenced from the secretion of Cr. Moreover, its blood concentration was great individually impacted by the body condition; therefore, it had a diagnostic population-specific limitation for the determination of kidney function.
The study however has limitations: only KDIGO Cr-AKI criteria, but not urine output criteria, were used to define the occurrence of postoperative AKI, which could affect the accuracy of the diagnosis; moreover, the serum Cr levels used for diagnosis of postoperative AKI were not corrected for postoperative fluid balance.
Owing to the test conditions, there was a lack of good and specific diagnostic biomarkers. Some renal biology markers had limited application, subject to the deficiency of serum measurements in past OLT, such as cystatin C, neutrophil gelatinase-associated lipocalin (NGAL), and kidney injury molecule-1 (KIM-1). It was reported that the use of a combination of biomarkers failed to significantly improve the risk classification of AKI compared with a single biomarker model.[41] Therefore, further studies are required on the issue of combined biomarker labeling.
In conclusion, compared with these commonly used biomarkers, there are sensitive and specific limitations for the use of BUN, UA, and β2-MG. The statistical analysis confirms the significance of Cr as a high-value indicator for the diagnosis and grading of post-OLT AKI.
Financial support and sponsorship
Nil.
Conflicts of interest
There are no conflicts of interest.
Footnotes
Edited by: Peng Lyu
REFERENCES
- 1.Rahman S, Davidson BR, Mallett SV. Early acute kidney injury after liver transplantation: Predisposing factors and clinical implications. World J Hepatol. 2017;9:823–32. doi: 10.4254/wjh.v9.i18.823. doi: 10.4254/wjh.v9.i18.823. [DOI] [PMC free article] [PubMed] [Google Scholar]
- 2.Hilmi IA, Damian D, Al-Khafaji A, Planinsic R, Boucek C, Sakai T, et al. Acute kidney injury following orthotopic liver transplantation: Incidence, risk factors, and effects on patient and graft outcomes. Br J Anaesth. 2015;114:919–26. doi: 10.1093/bja/aeu556. doi: 10.1093/bja/aeu556. [DOI] [PubMed] [Google Scholar]
- 3.Klaus F, Keitel da Silva C, Meinerz G, Carvalho LM, Goldani JC, Cantisani G, et al. Acute kidney injury after liver transplantation: Incidence and mortality. Transplant Proc. 2014;46:1819–21. doi: 10.1016/j.transproceed.2014.05.053. doi: 10.1016/j.transproceed.2014.05.053. [DOI] [PubMed] [Google Scholar]
- 4.Modi RM, Patel N, Metwally SN, Mumtaz K. Outcomes of liver transplantation in patients with hepatorenal syndrome. World J Hepatol. 2016;8:999–1011. doi: 10.4254/wjh.v8.i24.999. doi: 10.4254/wjh.v8.i24.999. [DOI] [PMC free article] [PubMed] [Google Scholar]
- 5.Krawczeski CD, Goldstein SL, Woo JG, Wang Y, Piyaphanee N, Ma Q, et al. Temporal relationship and predictive value of urinary acute kidney injury biomarkers after pediatric cardiopulmonary bypass. J Am Coll Cardiol. 2011;58:2301–9. doi: 10.1016/j.jacc.2011.08.017. doi: 10.1016/j.jacc.2011.08.017. [DOI] [PMC free article] [PubMed] [Google Scholar]
- 6.Endre ZH, Pickering JW, Walker RJ. Clearance and beyond: The complementary roles of GFR measurement and injury biomarkers in acute kidney injury (AKI) Am J Physiol Renal Physiol. 2011;301:F697–707. doi: 10.1152/ajprenal.00448.2010. doi: 10.1152/ajprenal.00448.2010. [DOI] [PubMed] [Google Scholar]
- 7.do Nascimento GV, Balbi AL, Ponce D, Abrão JM. Early initiation of dialysis: Mortality and renal function recovery in acute kidney injury patients. J Bras Nefrol. 2012;34:337–42. doi: 10.5935/0101-2800.20120022. doi: 10.5935/0101-2800.20120022. [DOI] [PubMed] [Google Scholar]
- 8.Gaipov A, Solak Y, Turkmen K, Toker A, Baysal AN, Cicekler H, et al. Serum uric acid may predict development of progressive acute kidney injury after open heart surgery. Ren Fail. 2015;37:96–102. doi: 10.3109/0886022X.2014.976130. doi: 10.3109/0886022X.2014.976130. [DOI] [PubMed] [Google Scholar]
- 9.Cheungpasitporn W, Thongprayoon C, Harrison AM, Erickson SB. Admission hyperuricemia increases the risk of acute kidney injury in hospitalized patients(.) Clin Kidney J. 2016;9:51–6. doi: 10.1093/ckj/sfv086. doi: 10.1093/ckj/sfv086. [DOI] [PMC free article] [PubMed] [Google Scholar]
- 10.Astor BC, Muth B, Kaufman DB, Pirsch JD, Michael Hofmann R, Djamali A, et al. Serum β2-microglobulin at discharge predicts mortality and graft loss following kidney transplantation. Kidney Int. 2013;84:810–7. doi: 10.1038/ki.2013.172. doi: 10.1038/ki.2013.172. [DOI] [PubMed] [Google Scholar]
- 11.Trailin AV, Pleten MV, Ostapenko TI, Iefimenko NF, Nikonenko OS. High serum level of β2-microglobulin in late posttransplant period predicts subsequent decline in kidney allograft function: A Preliminary study. Dis Markers. 2015;2015:562580. doi: 10.1155/2015/562580. doi: 10.1155/2015/ [DOI] [PMC free article] [PubMed] [Google Scholar]
- 12.Hei ZQ, Li XY, Shen N, Pang HY, Zhou SL, Guan JQ, et al. Prognostic values of serum cystatin C and beta2 microglobulin, urinary beta2 microglobulin and N-acetyl-beta-D-glucosaminidase in early acute renal failure after liver transplantation. Chin Med J. 2008;121:1251–6. [PubMed] [Google Scholar]
- 13.Palevsky PM, Liu KD, Brophy PD, Chawla LS, Parikh CR, Thakar CV, et al. KDOQI US commentary on the 2012 KDIGO clinical practice guideline for acute kidney injury. Am J Kidney Dis. 2013;61:649–72. doi: 10.1053/j.ajkd.2013.02.349. doi: 10.1053/j.ajkd.2013.02.349. [DOI] [PubMed] [Google Scholar]
- 14.Pan HC, Chien YS, Jenq CC, Tsai MH, Fan PC, Chang CH, et al. Acute kidney injury classification for critically ill cirrhotic patients: A Comparison of the KDIGO, AKIN, and RIFLE classifications. Sci Rep. 2016;6:23022. doi: 10.1038/srep23022. doi: 10.1038/srep. [DOI] [PMC free article] [PubMed] [Google Scholar]
- 15.Erdost HA, Ozkardesler S, Akan M, Iyilikci L, Unek T, Ocmen E, et al. Comparison of the RIFLE, AKIN, and KDIGO diagnostic classifications for acute renal injury in patients undergoing liver transplantation. Transplant Proc. 2016;48:2112–8. doi: 10.1016/j.transproceed.2016.03.044. doi: 10.1016/j.transproceed.2016.03.044. [DOI] [PubMed] [Google Scholar]
- 16.Thomas ME, Blaine C, Dawnay A, Devonald MA, Ftouh S, Laing C, et al. The definition of acute kidney injury and its use in practice. Kidney Int. 2015;87:62–73. doi: 10.1038/ki.2014.328. doi: 10.1038/ki.2014.328. [DOI] [PubMed] [Google Scholar]
- 17.Kellum JA, Sileanu FE, Murugan R, Lucko N, Shaw AD, Clermont G, et al. Classifying AKI by urine output versus serum creatinine level. J Am Soc Nephrol. 2015;26:2231–8. doi: 10.1681/ASN.2014070724. doi: 10.1681/ASN.2014070724. [DOI] [PMC free article] [PubMed] [Google Scholar]
- 18.Thalji SZ, Kothari AN, Kuo PC, Mosier MJ. Acute kidney injury in burn patients: Clinically significant over the initial hospitalization and 1 year after injury: An original retrospective cohort study. Ann Surg. 2017;266:376–82. doi: 10.1097/SLA.0000000000001979. doi: 10.1097/SLA.0000000000001979. [DOI] [PMC free article] [PubMed] [Google Scholar]
- 19.Carrabba N, Valenti R, Migliorini A, Vergara R, Parodi G, Antoniucci D, et al. Prognostic value of myocardial injury following transcatheter aortic valve implantation. Am J Cardiol. 2013;111:1475–81. doi: 10.1016/j.amjcard.2013.01.301. doi: 10.1016/j.amjcard.2013.01.301. [DOI] [PubMed] [Google Scholar]
- 20.Mizota T, Hamada M, Matsukawa S, Seo H, Tanaka T, Segawa H, et al. Relationship between intraoperative hypotension and acute kidney injury after living donor liver transplantation: A Retrospective analysis. J Cardiothorac Vasc Anesth. 2017;31:582–9. doi: 10.1053/j.jvca.2016.12.002. doi: 10.1053/j.jvca.2016.12.002. [DOI] [PubMed] [Google Scholar]
- 21.Iglesias JI, DePalma JA, Levine JS. Risk factors for acute kidney injury following orthotopic liver transplantation: The impact of changes in renal function while patients await transplantation. BMC Nephrol. 2010;11:30. doi: 10.1186/1471-2369-11-30. doi: 10.1186/1471-2369-11- [DOI] [PMC free article] [PubMed] [Google Scholar]
- 22.Wong BT, Chan MJ, Glassford NJ, Mårtensson J, Bion V, Chai SY, et al. Mean arterial pressure and mean perfusion pressure deficit in septic acute kidney injury. J Crit Care. 2015;30:975–81. doi: 10.1016/j.jcrc.2015.05.003. doi: 10.1016/j.jcrc.2015.05.003. [DOI] [PubMed] [Google Scholar]
- 23.Guo RM, Li QL, Zhong LR, Guo Y, Jiao J, Chen SQ, et al. Brain MRI findings in acute hepatic encephalopathy in liver transplant recipients. Acta Neurol Belg. 2017 doi: 10.1007/s13760-017-0875-7. doi: 10.1007/s13760-017-0875-7. Epub ahead of print. [DOI] [PubMed] [Google Scholar]
- 24.Zhu M, Li Y, Xia Q, Wang S, Qiu Y, Che M, et al. Strong impact of acute kidney injury on survival after liver transplantation. Transplant Proc. 2010;42:3634–8. doi: 10.1016/j.transproceed.2010.08.059. doi: 10.1016/j.transproceed2010.08.059. [DOI] [PubMed] [Google Scholar]
- 25.Maiwall R, Kumar G, Bharadwaj A, Jamwal K, Bhadoria AS, Jain P, et al. AKI persistence at 48 h predicts mortality in patients with acute on chronic liver failure. Hepatol Int. 2017;11:529–39. doi: 10.1007/s12072-017-9822-1. doi: 10.1007/s12072-017-9822-1. [DOI] [PubMed] [Google Scholar]
- 26.Zongyi Y, Baifeng L, Funian Z, Hao L, Xin W. Risk factors of acute kidney injury after orthotopic liver transplantation in China. Sci Rep. 2017;7:41555. doi: 10.1038/srep41555. doi: 10.1038/srep. [DOI] [PMC free article] [PubMed] [Google Scholar]
- 27.Izumi T, Watanabe J, Tohyama T, Takada Y. Impact of psoas muscle index on short-term outcome after living donor liver transplantation. Turk J Gastroenterol. 2016;27:382–8. doi: 10.5152/tjg.2016.16201. doi: 10.5152/tjg.2016.16201. [DOI] [PubMed] [Google Scholar]
- 28.Elgend HM, El Moghazy WM, Uemoto S, Fukuda K. Pre transplant serum magnesium level predicts outcome after pediatric living donor liver transplantation. Ann Transplant. 2012;17:29–37. doi: 10.12659/aot.883220. [DOI] [PubMed] [Google Scholar]
- 29.Palazzuoli A, Ruocco G, Pellegrini M, De Gori C, Del Castillo G, Franci B, et al. Comparison of neutrophil gelatinase-associated lipocalin versus B-type natriuretic peptide and cystatin C to predict early acute kidney injury and outcome in patients with acute heart failure. Am J Cardiol. 2015;116:104–11. doi: 10.1016/j.amjcard.2015.03.043. doi: 10.1016/j.amjcard.2015.03.043. [DOI] [PubMed] [Google Scholar]
- 30.Kazory A. Emergence of blood urea nitrogen as a biomarker of neurohormonal activation in heart failure. Am J Cardiol. 2010;106:694–700. doi: 10.1016/j.amjcard.2010.04.024. doi: 10.1016/j.amjcard.2010.04.024. [DOI] [PubMed] [Google Scholar]
- 31.Joung KW, Jo JY, Kim WJ, Choi DK, Chin JH, Lee EH, et al. Association of preoperative uric acid and acute kidney injury following cardiovascular surgery. J Cardiothorac Vasc Anesth. 2014;28:1440–7. doi: 10.1053/j.jvca.2014.04.020. doi: 10.1053/j.jvca.2014.04.020. [DOI] [PubMed] [Google Scholar]
- 32.Liang J, Zhang P, Hu X, Zhi L. Elevated serum uric acid after injury correlates with the early acute kidney in severe burns. Burns. 2015;41:1724–31. doi: 10.1016/j.burns.2015.09.001. doi: 10.1016/j.burns.2015.09.001. [DOI] [PubMed] [Google Scholar]
- 33.Saito Y, Oba N, Nishinakagawa S, Mizuguchi Y, Kojima T, Nomura K, et al. Identification of beta2-microgloblin as a candidate for early diagnosis of imaging-invisible hepatocellular carcinoma in patient with liver cirrhosis. Oncol Rep. 2010;23:1325–30. doi: 10.3892/or_00000767. doi: 10.3892/or_00000767. [DOI] [PubMed] [Google Scholar]
- 34.Nozue T, Michishita I, Mizuguchi I. Predictive value of serum cystatin C, β2-microglobulin, and urinary liver-type fatty acid-binding protein on the development of contrast-induced nephropathy. Cardiovasc Interv Ther. 2010;25:85–90. doi: 10.1007/s12928-010-0014-3. doi: 10.1007/s12928-010-0014-3. [DOI] [PubMed] [Google Scholar]
- 35.Dong XM, Cai R, Yang F, Zhang YY, Wang XG, Fu SL, et al. Predictive value of plasma β2-microglobulin on human body function and senescence. Eur Rev Med Pharmacol Sci. 2016;20:2350–6. [PubMed] [Google Scholar]
- 36.Foster MC, Coresh J, Hsu CY, Xie D, Levey AS, Nelson RG, et al. Serum β-trace protein and β2-microglobulin as predictors of ESRD, mortality, and cardiovascular disease in adults with CKD in the chronic renal insufficiency cohort (CRIC) study. Am J Kidney Dis. 2016;68:68–76. doi: 10.1053/j.ajkd.2016.01.015. doi: 10.1053/j.ajkd.2016.01.015. [DOI] [PMC free article] [PubMed] [Google Scholar]
- 37.Herrero-Morín JD, Málaga S, Fernández N, Rey C, Diéguez MA, Solís G, et al. Cystatin C and beta2-microglobulin: Markers of glomerular filtration in critically ill children. Crit Care. 2007;11:R59. doi: 10.1186/cc5923. doi: 10.1186/cc5923. [DOI] [PMC free article] [PubMed] [Google Scholar]
- 38.Ashida T, Tsubaki K, Urase F, Ishikawa H, Tsuji K, Hazu S, et al. Change of serum alpha-1 microglobulin and beta-2 microglobulin following allogeneic bone marrow transplantation. Bone Marrow Transplant. 1994;14:579–82. [PubMed] [Google Scholar]
- 39.Kim MK, Yun KJ, Chun HJ, Jang EH, Han KD, Park YM, et al. Clinical utility of serum beta-2-microglobulin as a predictor of diabetic complications in patients with type 2 diabetes without renal impairment. Diabetes Metab. 2014;40:459–65. doi: 10.1016/j.diabet.2014.08.002. doi: 10.1016/j.diabet.2014.08.002. [DOI] [PubMed] [Google Scholar]
- 40.Méndez Landa CE. Kidney effect of hyperuricemia. Contrib Nephrol. 2018;192:8–16. doi: 10.1159/000484273. doi: 10.1159/000484273. [DOI] [PubMed] [Google Scholar]
- 41.Prowle JR, Calzavacca P, Licari E, Ligabo EV, Echeverri JE, Bagshaw SM, et al. Combination of biomarkers for diagnosis of acute kidney injury after cardiopulmonary bypass. Ren Fail. 2015;37:408–16. doi: 10.3109/0886022X.2014.1001303. doi: 10.3109/0886022X.2014.1001303. [DOI] [PMC free article] [PubMed] [Google Scholar]