Abstract
Introduction
Current prostate cancer risk calculators are limited in impact because only a probability of having prostate cancer is provided. We developed the next generation of prostate cancer risk calculator that incorporates life expectancy in order to better evaluate prostate cancer risk in context to a patient’s age and comorbidity.
Methods
We combined two cohorts to develop the new risk calculator. The first was 5638 subjects who all underwent a prostate biopsy for prostate cancer detection. The second was 979 men diagnosed with prostate cancer with long-term survival data. Two regression models were used to create multivariable nomograms and an online prostate cancer risk calculator was developed.
Results
Of the 5638 patients who underwent a prostate biopsy, 629 (11%) were diagnosed with aggressive prostate cancer (Gleason Score 7[4+3] or more). Of the 979 patients who underwent treatment for prostate cancer, the 10-year overall survival (OS) was 49.6% (95% confidence interval [CI] 46.6–52.9). The first multivariable nomogram for cancer risk had a concordance index of 0.74 (95% CI 0.72, 0.76), and the second nomogram to predict survival had a concordance index of 0.71 (95% CI 0.69–0.72). The next-generation prostate cancer risk calculator was developed online and is available at: http://riskcalc.org/ProstateCA_Screen_Tool.
Conclusions
We have developed the next-generation prostate cancer risk calculator that incorporates a patient’s life expectancy based on age and comorbidity. This approach will better evaluate prostate cancer risk. Future studies examining other populations will be needed for validation.
Introduction
Screening for prostate cancer with the prostate-specific antigen (PSA) test alone has identified a high number of patients with indolent forms of prostate cancer, which has reduced the efficacy of screening for prostate cancer from randomized trials.1,2 Based on these results, the U.S. Preventative Services Task Force initially recommended against using the PSA test for prostate cancer screening,3 but have now reversed this decision.4 In contrast, the American Society of Clinical Oncology (ASCO) reviewed the same body of evidence and concluded that prostate cancer screening with the PSA test should be considered among men with at least a 10-year life expectancy.5 Thus, the practice of prostate cancer screening continues to be controversial between primary care physicians (PCPs) and cancer specialists.
To improve the positive and negative predictive value of the PSA test, prostate cancer risk calculators have been developed internationally.6–8 These online instruments account for risk factors and other tumour markers for prostate cancer to improve the predictive ability of the PSA test. A key limitation of current prostate cancer risk calculators is that they provide a probability estimate for having prostate cancer and no thresholds for these estimates have been established. This makes it difficult to manage prostate cancer risk in the context of a patient’s other potential competing comorbidities, which can affect life expectancy. This is particularly true for PCPs.
To improve the clinical utility of prostate cancer risk calculators, we developed the next generation of risk calculators, incorporating life expectancy based on comorbidity and 10-year survival rates of prostate cancer, and providing specific recommendations to physicians on what action is necessary for any given level of the PSA test.
Methods
Study subjects
The study subjects consisted of two cohorts. The first included 5638 subjects who all underwent a prostate biopsy for prostate cancer detection from several different institutions. The second included 979 men diagnosed with prostate cancer in the early PSA era with long-term survival data.
The biopsy cohort was initially accrued from a multi-institutional prospective study evaluating the predictive accuracy of the Sunnybrook Prostate Cancer Risk Calculator.6 Patients were eligible for inclusion if they had an abnormal PSA level (>2.6 ng/mL) or an abnormal digital rectal examination (DRE). From 2009–2014, patients were continually prospectively accrued from a single tertiary centre (Sunnybrook Health Sciences Centre) for further prostate cancer risk evaluation, including men with normal PSA levels. All patients underwent transrectal ultrasound-guided needle core biopsy (10–12 needle core samples). Patients were excluded if their PSA level was more than 50 ng/mL (n=109), if they had incomplete risk factor information (n=47), or if they were unable to provide consent (n=35).
The second prostate cancer cohort was based on an initial cohort of 979 men described in detail by Cowen et al.9 In short, patients diagnosed with stage 1 or 2 prostate cancer between 1987 and 1989 were followed for at least 13 years of followup. Baseline demographic information, including age, comorbidity, tumour-related factors, and treatment details, were well-described. For this study, missing data was imputed in order to use all of the 979 patients. The dataset was imputed using multivariate imputation by chained equations (MICE) established and validated by Van Buuren et al.10 This method approximates the posterior predicted distribution of each variable by regressing it on all other remaining variables. The first variable with missing observations, x1, is regressed on all remaining variables within the cohort, x2,…,xk, where k is the total number of variables in the cohort. The missing values for the variable x1 are replaced with the predicted values produced by the regression model. The imputation process is continued by creating regression models for each variable sequentially and inserting predicted values into the missing data slots until all missing values have been imputed exactly once for the first iteration. It should be noted that imputed data are included in the regression equations for subsequent imputations. Successive iterations are performed to re-impute and replace imputed values from previous iterations in order to obtain a stable estimate for each missing data point. As long as a sufficient number of iterations have been performed, the order in which the variables are imputed is irrelevant.11 The MICE package in R uses five iterations for each imputation according to its default setting. This whole process is then repeated m times to give you m imputed data sets.
Primary endpoint and baseline information
The two endpoints used were the histological presence of high-grade, aggressive adenocarcinoma of the prostate biopsy specimen and OS. This was defined as patients with Gleason 7 (4+3) score or more. Patients with Gleason Score 7 (3+4) or less were defined as non-aggressive cancer. All grading was based on the Gleason scoring system. Patient age at time of biopsy, urological voiding history (American Urological Association [AUA] symptom score), ethnic background, family history of prostate cancer, PSA level, free:total PSA ratio, and DRE results were obtained by questionnaires and medical chart review.
Data analysis
Two regression models were created to determine prostate cancer treatment methods, risk of high-grade prostate cancer, and 10-year OS. Descriptive and univariate analysis was performed using medians and interquartile ranges (IQR) for continuous variables and counts and percentages for categorical variables for the high-grade cancer cohort. Significance testing between our two outcomes of high-grade cancer was performed using Wilcoxon rank sum test for continuous variables and chi-square test for categorical ones. The risk of high-grade prostate cancer (grade Gleason Score 7 [4+3] or more) is created using multiple logistic regression modeling; seven candidate variables were under consideration for the full model build. These variables included age at diagnosis, PSA, free:total PSA ratio, family history of prostate cancer, AUA symptom score, ethnicity, and DRE. The 10-year OS was a modified model from Cowen et al.1 The model was fit using Cox proportional hazard modeling and contained 17 candidate covariates in the full model. These covariates include age, race, marital status, employment status, smoking status, systolic blood pressure, diastolic blood pressure, cholesterol, body mass index (BMI), PSA, lung cancer, hypertension, angina, coronary artery bypass graft surgery, CABG, and the Charlson Comorbidity Index (CCI). All variables and covariates were measured at baseline, which was the diagnosis or treatment of prostate cancer. The full model for each outcome was assessed for collinearity using the variance inflation factor (VIF), which measures how much inflation exists within each variable when compared to all other predictors. Once the full models have been identified, a reduced model was created using a stepdown model reduction technique that identifies the best parsimonious model using the concordance index as a stopping criterion. The model reduction process identifies the variable that has the smallest reduction in R2 and then removes it from the model; this process is continued until all variables are removed from the model. At each removal the concordance index is calculated and the process is stopped when the change is the concordance index is less than 0.001. Both models’ performances are measured using the concordance index and calibration. The concordance index measures the models’ ability to discriminate between those who are at higher risk by assigning a higher predicted probability than those who are at lower risk. The index ranges from 0–1, where 1 indicates a perfect discrimination and 0.5 indicates that the model is no better than chance. Calibration measures how close predicted probability is to the observed probability, where the 45° line indicates a perfect calibration. All calculations of the concordance index and calibration are corrected for optimism with bootstrapping. All statistical analysis was performed in R version 3.1.2 (R Core Team [2014]. R: A language and environment for statistical computing. R Foundation for Statistical Computing, Vienna, Austria. http://www.R-project.org/).
Results
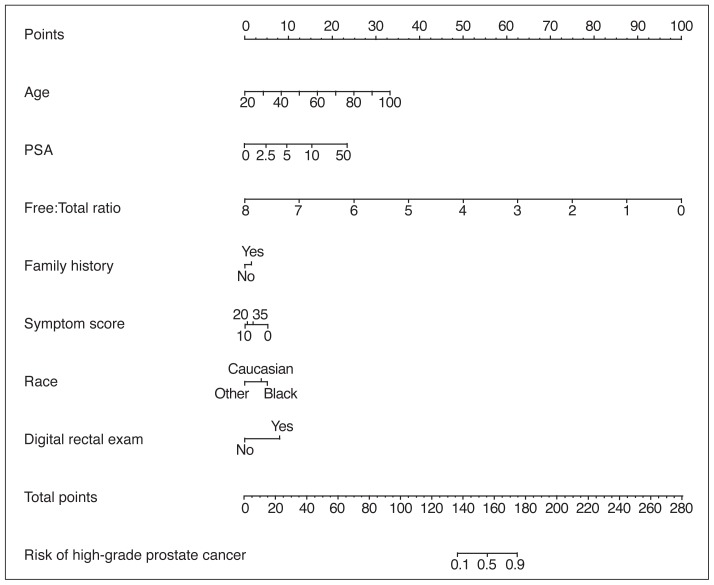
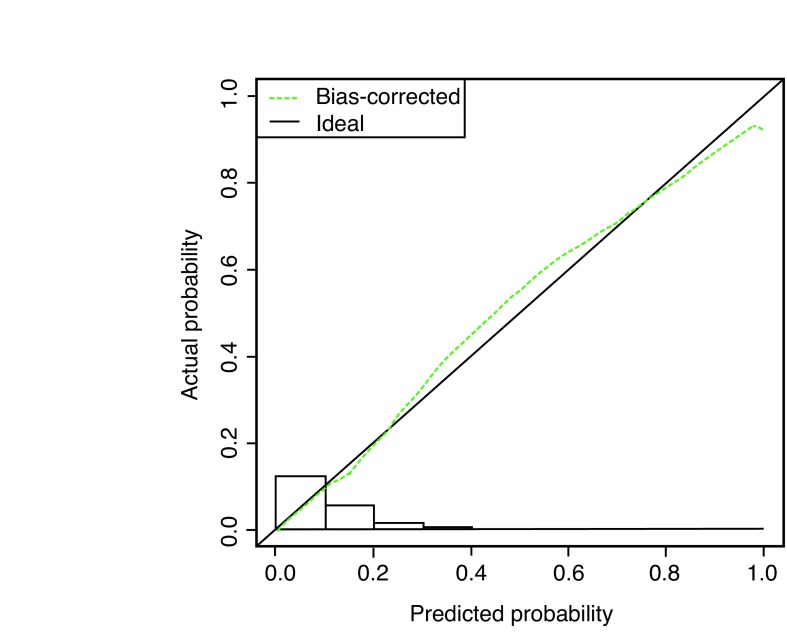
Of the 5638 patients who underwent a prostate biopsy, 629 (11%) were diagnosed with aggressive prostate cancer (Gleason Score 7[4+3] or more). Age, race, PSA level, free:PSA ratio, urinary symptoms, and DRE were predictive for aggressive prostate cancer (Table 1). Within a multivariate model, the same variables were significantly predictive for aggressive prostate cancer (Table 2) and a nomogram was constructed with a concordance index of 0.74 (95% confidence interval [CI] 0.72, 0.76) (Fig. 1A) with a high degree of calibration (Fig. 1B).
Table 1.
Baseline characteristics for patients undergoing prostate biopsy
| High-grade cancer | Non-high-grade cancer | |||
|---|---|---|---|---|
|
|
||||
| 629 (11%) | 5009 (89%) | |||
|
| ||||
| Variable | n (%) or median (IQR) | n (%) or median (IQR) | n (%) or median (IQR) | p |
| Age | 63 (58, 69) | 67 (61, 67) | 63 (58, 69) | <0.0001 |
| PSA | 6.42 (4.63, 9.62) | 8.72 (6.03, 15.91) | 6.22 (4.51, 9.04) | <0.0001 |
| Free:total ratio | 0.15 (0.10, 0.21) | 0.11 (0.07, 0.15) | 0.12 (0.10, 0.18) | <0.0001 |
| Family history | ||||
| Yes | 1001 (18%) | 113 (18%) | 888 (18%) | 0.8835 |
| No | 4637 (82%) | 516 (82%) | 4121 (82%) | |
| AUA symptoms score | 7 (3, 12) | 6 (1, 11) | 7 (3, 12) | 0.0105 |
| Race | ||||
| Caucasian | 4726 (84%) | 536 (86%) | 4190 (84%) | 0.0151 |
| Black | 421 (7%) | 56 (9%) | 365 (7%) | |
| Other | 445 (8%) | 33 (5%) | 412 (8%) | |
| Missing | 46 (1%) | |||
| Digital rectal exam | ||||
| Yes | 1067 (19%) | 211 (33%) | 856 (17%) | <0.0001 |
| No | 4571 (81%) | 418 (67%) | 4153 (83%) | |
AUA: American Urological Association; IQR: interquartile range; PSA: prostate-specific antigen.
Table 2.
Multivariable analysis for prediction of high-grade prostate cancer
| Variable | Estimate | p |
|---|---|---|
| Intercept | −6.1732 | <0.0001 |
| Age | 0.0478 | <0.0001 |
| PSA | 0.2224 | <0.0001 |
| PSA* | −0.2309 | <0.0001 |
| Free:total ratio | −1.4367 | 0.0034 |
| Family history (Yes) | 0.1629 | 0.1662 |
| AUA symptoms score | −0.0860 | <0.0001 |
| AUA symptoms score* | 0.0865 | 0.0004 |
| Race | ||
| Caucasian | −0.1459 | 0.3604 |
| Black | Reference | Reference |
| Other | −0.5789 | 0.0186 |
| Digital rectal exam (Yes) | 0.9149 | <0.0001 |
The second PSA and Symptom Score term represent cubic spline terms to allow for the model to not force a linear relationship with those variables.
AUA: American Urological Association; PSA: prostate-specific antigen.
Fig. 1A.
Nomogram prediction model for predicting high-grade (Gleason score 7 [4+3] or more) prostate cancer at the time of biopsy. The nomogram is used by first locating a patient’s position for each predictor variable on its horizontal scale and then a point value is assigned according to the points scale (top axis). Point values are summed for each variable and the total points is located on the total points scale (bottom axis). This corresponds to a probability value for having prostate cancer or aggressive prostate cancer. Symptom score is measured by total American Urological Association (AUA) symptom score. Prostate-specific antigen (PSA) is measured in ng/mL. Free:total PSA is measured by ratios.
Fig. 1B.
Calibration of the nomogram model when predicting high-grade cancer. A histogram of the calculated probabilities for the testing dataset is shown along the horizontal axis. The vertical axis represents the actual, observed incidence (actual probability), and the horizontal axis represents the probability calculated by the nomogram (predicted probability). If the model were perfect, all triangles would lie on the dotted line with a slope of 1.
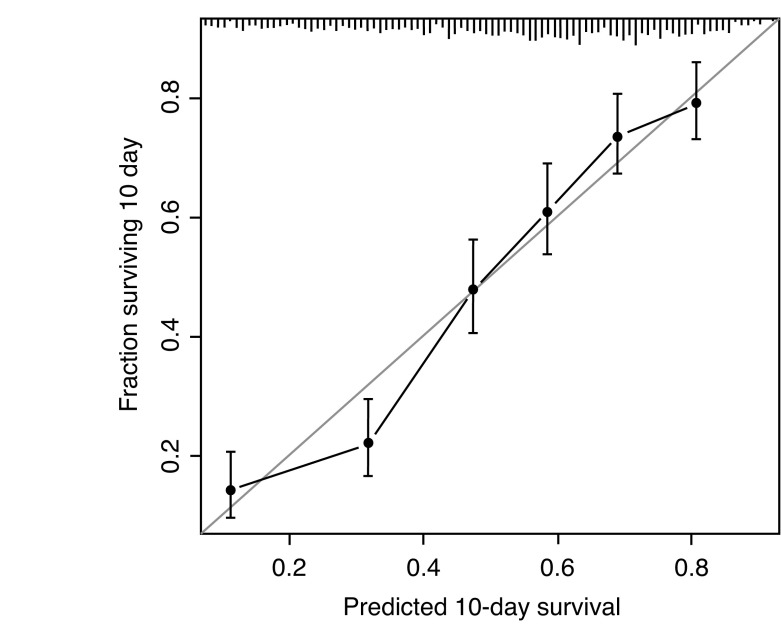
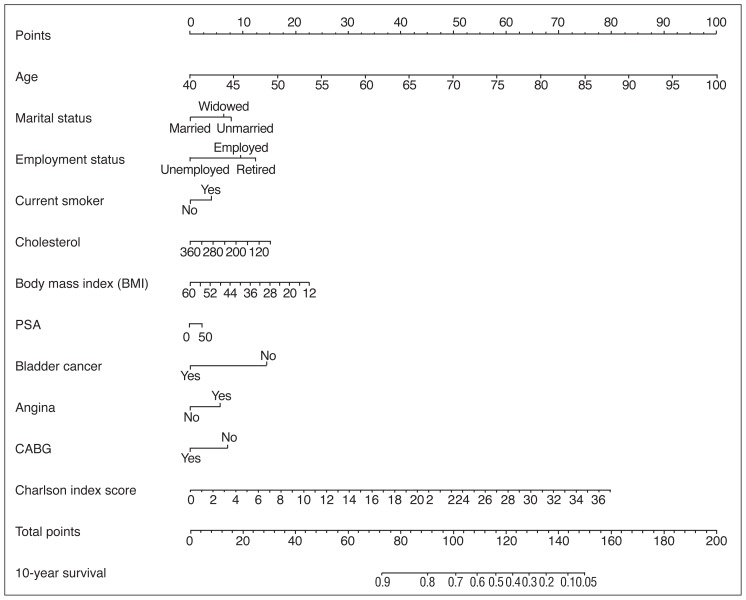
Of the 979 patients who underwent treatment for prostate cancer, the 10-year OS was 49.6% (95% CI 46.6–52.9%). Patients were treated with watchful waiting, surgery, or radio-therapy. Within a multivariate model, age, marital status, smoking history, cholesterol, BMI, PSA level at diagnosis, bladder cancer, cardiac history, and CCI were all predictive of survival (Table 3). A nomogram was constructed to predict 10-year OS with a concordance index of 0.71 (95% CI 0.69–0.72) (Fig. 2A) with a high degree of calibration (Fig. 2B).
Table 3.
Multivariable model for overall survival
| Variable | Estimate | p |
|---|---|---|
| Age | 0.0729 | <0.0001 |
| Marital status | ||
| Married | Reference | Reference |
| Unmarried | 0.3389 | 0.0162 |
| Widowed | 0.2768 | 0.0347 |
| Employment status | ||
| Employed | Reference | Reference |
| Retired | 0.1271 | 0.2815 |
| Unemployed | −0.4185 | 0.0663 |
| Current smoker (Yes) | 0.1772 | 0.0294 |
| Cholesterol | −0.0024 | 0.0122 |
| BMI | −0.0206 | 0.0675 |
| PSA | 0.0018 | <0.0001 |
| Bladder cancer (Yes) | −0.6341 | 0.0003 |
| Angina (Yes) | 0.2454 | 0.0323 |
| CABG (Yes) | −0.3024 | 0.0804 |
| Charlson Comorbidity Index | 0.0943 | <0.0001 |
BMI: body mass index; CABG: coronary artery bypass graft; PSA: prostate-specific antigen.
Fig. 2A.
Nomogram prediction model for predicting 10-year overall survival (OS) based on all treatments for prostate cancer.
Fig. 2B.
Calibration of the nomogram model when predicting overall survival. CABG: coronary artery bypass graft; PSA: prostate-specific antigen.
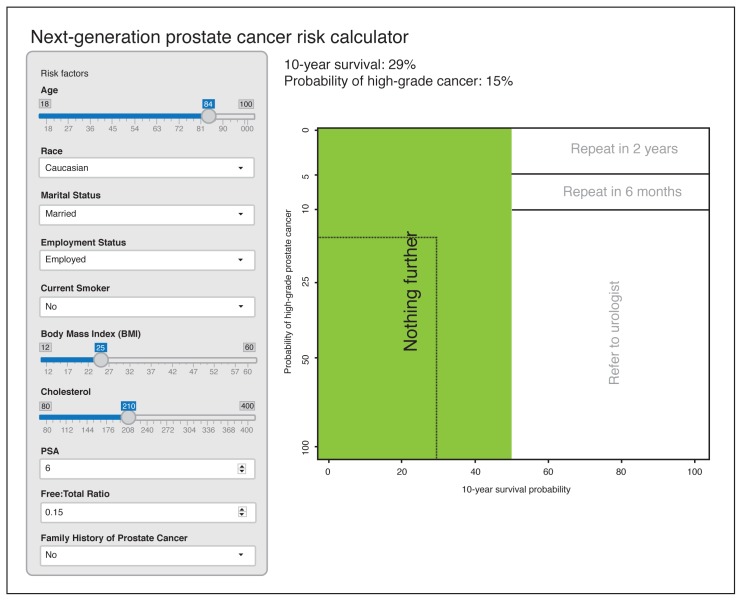
We then combined the two nomogram models to develop the next-generation prostate cancer risk calculator, which provides the risk of having aggressive, high-grade prostate cancer along with 10-year life expectancy. This new risk calculator also makes recommendations to PCPs based on the patient’s risk factors, PSA level, and comorbidity to do “nothing further,” “refer to a urologist,” or repeat the PSA test in either two or six months (Fig. 3). These recommendations and the threshold probabilities for having aggressive, high-grade prostate cancer and the survival rates were based on a consensus developed by the Prostate Cancer United Kingdom Prostate Risk Working Group. An expert panel of prostate cancer specialists were formed and a round table discussion based on consensus was used to develop the threshold probabilities.12 The next generation prostate cancer risk calculator is available online (http://riskcalc.org/ProstateCA_Screen_Tool.)
Fig. 3.
Next-generation, online nomogram that instructs physicians on what further action to take based on the risk factors and comorbidity information entered for any given patient. The image is a snapshot photo of what the online risk calculator. This can be accessed at: http://riskcalc.org/ProstateCA_Screen_Tool/
Discussion
We have developed the next generation of prostate cancer risk calculators that incorporates both the probability of having aggressive, high-grade prostate cancer and life expectancy as a decision tool for PCPs for prostate cancer screening. This risk calculator also makes recommendations to assist PCPs as to what action should be taken based on the PSA test within the context of a patient’s comorbidity and other factors.
To our knowledge, this is the first prostate cancer risk calculator that incorporates a patient’s life expectancy based on age and comorbidity information. Several prostate cancer risk calculators have developed newer versions that increase prostate cancer risk accuracy and that incorporate additional patient-specific information. Strobl et al updated the use of the Prostate Cancer Risk Calculator (PCPT) by applying advanced statistical methods to re-calibrate the risk calculator based on individual hospital datasets in order to optimize its accuracy.13 Chen et al further added genetic risk scores based on host DNA single nucleotide polymorphisms of putative genes to the PCPT and found a higher rate of prostate cancer detection.14 Vedder et al examined the addition of new serological markers for the European-based risk calculator and found an increase in predictive ability.15 However, none of these updated calculators can specifically determine the potential number of life years lost from prostate cancer based on age and comorbidity.
Also, no risk calculators to date make any specific recommendations as to which action to take based on the results, because only a percentage risk for having any or aggressive prostate cancer is provided. The decision to proceed with a prostate biopsy is left with the patient and physician based on the risk provided. This has limited the impact of risk calculators in prostate cancer assessment. A limitation is the arbitrary nature to determine these thresholds, and future studies in validating these thresholds or developing new thresholds will be required.
We used the CCI to measure comorbidity for our prostate cancer cohort. Because long-term followup is needed among our prostate cancer cohort, it was necessary to use the CCI, which was used at the time of study inception. Current contemporary studies continue to use the CCI score and have shown its prognostic ability to predict survival for patients with prostate cancer.16–18
A limitation of our study is the relatively small size (n=979) of the prostate cancer cohort. Although the cohort was derived from the PSA era, a proportion of patients did not undergo PSA testing, as it was early in its adoption. It is well-known that many larger datasets are available, but lack key data elements required for an effective prediction of life expectancy for patients with prostate cancer who are followed for all management strategies, including surgery, radiation, or conservative management. Data from large clinical trials, such as the Prostate, Lung, Colorectal and Ovarian (PLCO) Cancer Screening Trial and the European Randomized Study of Screening for Prostate Cancer (ERSPC) would be ideal, but are not readily available. From the 979 patients, Cowen et al used only 506 patients who had complete data and followup to estimate survival endpoints.9 We were able to use the full dataset of 979 patients using new imputational methods. Nevertheless, larger datasets will be necessary to improve study power.
Also, other populations from the U.S. and Europe will be needed to further validate the predictive accuracy for prostate cancer risk and life expectancy models. Large population-based datasets, such as the Surveillance, Epidemiology, and End-Results (SEER) program will be required. We have previously shown that the Sunnybrook risk calculator performed better than the Prostate Cancer Prevention Trial (PCPT) risk calculator. Other investigators will need to develop their own population cohort prostate cancer risk profile and survival in order to implement this approach. In this current study, we provide a systematic, methodological approach that can be applied and validated to a given population.
Conclusion
We have developed a next-generation prostate cancer risk calculator for PCPs that incorporates a patient’s life expectancy based on age and comorbidity. This approach will better evaluate prostate cancer risk than current risk calculators; however, future studies examining other populations will be needed for validation.
Acknowledgements
The authors thank the Prostate Cancer United Kingdom charity for developing a working group to help develop prostate cancer risk calculators to improve methods for prostate cancer detection.
Footnotes
Competing interests: Dr. Chin has been an advisor for Janssen, Profound Medical Inc., and Sanofi; has received honoraria from Profound Medical Inc.; and has participated in clinical trials supported by Abbvie, Amgen, Janssen, Profound Medical Inc., and US HIFU. Dr. Izawa has received speaker honoraria from Astellas, AstraZeneca, Janssen, and Sanofi. Dr. Rendon has been an advisor and speaker for Amgen, Astellas, Ferring, and Janssen. Dr. Bell has been an advisor for Astellas; has received consultant honoraria from Astellas, Paladin, and Pfizer; and holds shares in Pfizer. Dr. Singal has been an advisor for Endoluxe Inc, Hybridyne, and Marion Surgical; has received payment from Marion Surgical; and holds investments in Hybridyne and Marion Surgical. The remaining authors report no competing personal or financial interests related to this work.
This paper has been peer-reviewed.
References
- 1.Andriole GL, Grubb RL, 3rd, Buys SS, et al. Mortality results from a randomized prostate-cancer screening trial. N Engl J Med. 2009;360:1310–9. doi: 10.1056/NEJMoa0810696. https://doi.org/10.1056/NEJMoa0810696. [DOI] [PMC free article] [PubMed] [Google Scholar]
- 2.Schroder FH, Hugosson J, Roobol MJ, et al. Screening and prostate-cancer mortality in a randomized European study. N Engl J Med. 2009;360:1320–8. doi: 10.1056/NEJMoa0810084. https://doi.org/10.1056/NEJMoa0810084. [DOI] [PubMed] [Google Scholar]
- 3.Force USPST. Prostate Cancer Screening 2012. [Accessed Jan. 16, 2018]. Available at http://www.uspreventiveservicestaskforce.org/Page/Topic/recommendation-summary/prostate-cancer-screening.
- 4.Bibbins-Domingo K, Grossman DC, Curry SJ. The US Preventive Services Task Force 2017 draft recommendation statement on screening for prostate cancer: An invitation to review and comment. JAMA. 2017;317:1949–50. doi: 10.1001/jama.2017.4413. https://doi.org/10.1001/jama.2017.4413. [DOI] [PubMed] [Google Scholar]
- 5.Basch E, Oliver TK, Vickers A, et al. Screening for prostate cancer with prostate-specific antigen testing: American Society of Clinical Oncology provisional clinical opinion. J Clin Oncol. 2012;30:3020–5. doi: 10.1200/JCO.2012.43.3441. https://doi.org/10.1200/JCO.2012.43.3441. [DOI] [PMC free article] [PubMed] [Google Scholar]
- 6.Nam RK, Kattan MW, Chin JL, et al. Prospective multi-institutional study evaluating the performance of prostate cancer risk calculators. J Clin Oncol. 2011;29:2959–64. doi: 10.1200/JCO.2010.32.6371. https://doi.org/10.1200/JCO.2010.32.6371. [DOI] [PubMed] [Google Scholar]
- 7.Thompson IM, Ankerst DP, Chi C, et al. Assessing prostate cancer risk: Results from the Prostate Cancer Prevention Trial. J Natl Cancer Inst. 2006;98:529–34. doi: 10.1093/jnci/djj131. https://doi.org/10.1093/jnci/djj131. [DOI] [PubMed] [Google Scholar]
- 8.van Vugt HA, Roobol MJ, Kranse R, et al. Prediction of prostate cancer in unscreened men: External validation of a risk calculator. Eur J Cancer. 2011;47:903–9. doi: 10.1016/j.ejca.2010.11.012. https://doi.org/10.1016/j.ejca.2010.11.012. [DOI] [PubMed] [Google Scholar]
- 9.Cowen ME, Halasyamani LK, Kattan MW. Predicting life expectancy in men with clinically localized prostate cancer. J Urol. 2006;175:99–103. doi: 10.1016/S0022-5347(05)00018-2. https://doi.org/10.1016/S0022-5347(05)00018-2. [DOI] [PubMed] [Google Scholar]
- 10.van Buuren S, Groothuis-Oudshoorn K. MICE: Multivariate Imputation by Chained Equations. R Journal of Statistical Software. 2011;45:1–67. https://doi.org/10.18637/jss.v045.i03. [Google Scholar]
- 11.van Buuren S. Flexible Imputation of Missing Data. Boca Raton, Florida: Chapman and Hall/CRC Press; 2012. https://doi.org/10.1201/b11826. [Google Scholar]
- 12.Kingdom PCU. [Accessed Jan. 16, 2018]. Available at https://prostatecanceruk.org/research/research-we-fund/pg15-001-rk.
- 13.Strobl AN, Thompson IM, Vickers AJ, et al. The next generation of clinical decision-making tools: Development of a real-time prediction tool for outcome of prostate biopsy in response to a continuously evolving prostate cancer landscape. J Urol. 2015;194:58–64. doi: 10.1016/j.juro.2015.01.092. https://doi.org/10.1016/j.juro.2015.01.092. [DOI] [PMC free article] [PubMed] [Google Scholar]
- 14.Chen H, Liu X, Brendler CB, et al. Adding genetic risk score to family history identifies twice as many high-risk men for prostate cancer: Results from the prostate cancer prevention trial. Prostate. 2016;76:1120–9. doi: 10.1002/pros.23200. https://doi.org/10.1002/pros.23200. [DOI] [PMC free article] [PubMed] [Google Scholar]
- 15.Vedder MM, de Bekker-Grob EW, Lilja HG, et al. The added value of percentage of free to total prostate-specific antigen, PCA3, and a kallikrein panel to the ERSPC risk calculator for prostate cancer in prescreened men. Eur Urol. 2014;66:1109–15. doi: 10.1016/j.eururo.2014.08.011. https://doi.org/10.1016/j.eururo.2014.08.011. [DOI] [PMC free article] [PubMed] [Google Scholar]
- 16.Pearce SM, Pariser JJ, Karrison T, et al. Comparison of perioperative and early oncologic outcomes between open and robotic-assisted laparoscopic prostatectomy in a contemporary population-based cohort. J Urol. 2016;196:76–81. doi: 10.1016/j.juro.2016.01.105. https://doi.org/10.1016/j.juro.2016.01.105. [DOI] [PubMed] [Google Scholar]
- 17.Dell’Oglio P, Abou-Haidar H, Leyh-Bannurah SR, et al. Assessment of the rate of adherence to international guidelines for androgen-deprivation therapy with external-beam radiation therapy: A population-based study. Eur Urol. 2016;70:429–35. doi: 10.1016/j.eururo.2016.02.057. https://doi.org/10.1016/j.eururo.2016.02.057. [DOI] [PubMed] [Google Scholar]
- 18.Loppenberg B, Dalela D, Karabon P, et al. The impact of local treatment on overall survival in patients with metastatic prostate cancer on diagnosis: A national cancer data base analysis. Eur Urol. 2017;72:14–9. doi: 10.1016/j.eururo.2016.04.031. https://doi.org/10.1016/j.eururo.2016.04.031. [DOI] [PubMed] [Google Scholar]


