Abstract
After reproduction is initiated in plants, subsequent reproductive development is sometimes interrupted, which decreases the final number of seeds and fruits. We subjected maize (Zea mays L.) to low water potentials (ψw) that frequently cause this kind of failure. We observed metabolite pools and enzyme activities in the developing ovaries while we manipulated the sugar stream by feeding sucrose (Suc) to the stems. Low ψw imposed for 5 d around pollination allowed embryos to form, but abortion occurred and kernel number decreased markedly. The ovary contained starch that nearly disappeared during this abortion. Analyses showed that all of the intermediates in starch synthesis were depleted. However, when labeled Suc was fed to the stems, label arrived at the ovaries. Solute accumulated and caused osmotic adjustment. Suc accumulated, but other intermediates did not, showing that a partial block in starch synthesis occurred at the first step in Suc utilization. This step was mediated by invertase, which had low activity. Because of the block, Suc feeding only partially prevented starch disappearance and abortion. These results indicate that young embryos abort when the sugar stream is interrupted sufficiently to deplete starch during early ovary development, and this abortion results in a loss of mature seeds and fruits. At low ψw, maintaining the sugar stream partially prevented the abortion, but invertase regulated the synthesis of ovary starch and partially prevented full recovery.
In plants, reproduction involves intense biosynthetic activity. Anthesis is generally rapid, and large amounts of photosynthate are deposited in the developing reproductive structures. An example is maize (Zea mays L.), which deposits about one-half of its aboveground dry mass in the mature kernels (McPherson and Boyer, 1977; Jurgens et al., 1978). This deposition depends on the number of reproductive structures, which is initially determined by the conversion of vegetative shoot apices to reproductive ones. Photoperiod and other triggers are signals for the conversion, but the succeeding environment can also have an effect by changing floral development, altering pollination, or preventing fruit growth. The mechanisms for the latter changes are generally unknown, but have a large impact on agriculture because they decrease the number of seeds and fruits.
In maize, these later effects occur frequently and losses in kernel development are especially important. Factors such as low water potential (ψw) can arrest ovary growth, especially if young embryos abort (Westgate and Boyer, 1986). The abortion blocks kernel development despite the successful completion of all of the earlier steps in reproduction, and kernel number is permanently reduced. Many of the embryos can be rescued by feeding Suc to the stem in substrate quantities at the time of low ψw (Boyle et al., 1991b; Zinselmeier et al., 1995a). The Suc must be fed in a quantity that replaces the photosynthetic products missing because of inhibited photosynthesis (Boyle et al., 1991b; Zinselmeier et al., 1995a). However, full recovery has not yet been achieved by this method. Low ψw affects many enzymes and metabolic activities (Kramer and Boyer, 1995), and it is possible that Suc cannot be fully utilized by the embryos. Because so many factors can change, those that limit embryo development remain unidentified.
Little is known about the fate of incoming carbon during the early phases of reproductive development. Starch was correlated with early pod development in soybean (Fader and Koller, 1985), and was responsive to low ψw (Zinselmeier et al., 1995a, 1995b) and Suc feeding in maize (Zinselmeier et al., 1995a), but its location and involvement in ovary development appear otherwise unexplored. Schussler and Westgate (1991) showed that sugars are absorbed less rapidly in embryos at low ψw than in controls, and Zinselmeier et al. (1995b) showed that invertase loses activity, but other activities were not explored. To identify rate-limiting enzyme steps in metabolism, it is necessary to alter the metabolite flow and determine where the flow might be restricted. Mutations that alter enzyme activities and therefore carbon flow have been used successfully to study starch metabolism during late reproduction in maize (Shannon and Garwood, 1984; Caspar, 1994), but no mutations are available for comparable studies during early reproduction around the time of pollination.
To alter carbon flow by a different means, we adapted the method of Boyle et al. (1991b) and Zinselmeier et al. (1995a) for feeding Suc to the intact plant. Supplying Suc increased the carbon flowing through pathways otherwise depleted by the effects of low ψw. It was sufficient to observe only whether intermediary metabolites accumulated or were depleted in these pools. A pool showing accumulation was considered to be upstream of the rate-limiting step, and pools showing depletion were considered to be downstream. The enzyme mediating the transition step was considered to be rate-limiting and thus to regulate flow through the metabolic pathway. Compared with the mutant approach, this method did not otherwise manipulate enzyme activity, but it had the advantage that specific changes could be made in intact plants, thus permitting ready interpretation.
MATERIALS AND METHODS
Growth Conditions
Maize (Zea mays L. cv Pioneer Hi-Bred 3732) plants were grown in 22-L pots containing 11 kg of Evesboro loamy sand, loamy substratum (coated, mesic, Typic Quartzipsamments) amended by mixing peat:sand:soil in volumes of 1:1:1, and dolomitic limestone (275 g per pot) to adjust the soil pH to 6.9. Ten seeds were planted in each pot and the soil mix was saturated with a nutrient solution (Hoagland and Arnon, 1950) and allowed to drain. The solution consisted of 4 mm KNO3, 6 mm Ca(NO3)2·4H2O, 2 mm MgSO4·7H2O, 2 mm KH2PO4, 0.5 μm CuSO4·5H2O, 10 μm MnSO4·H2O, 2 μm ZnSO4·7H2O, 25 μm H3BO3, 0.5 μm H2MoO4, and 50 μm iron citrate. The pots were placed in a controlled-environment chamber with day/night temperatures and RH of 30°C/20°C ± 1°C and 40%/95% ± 5%, respectively. Cool-white fluorescent lamps provided a 14-h photoperiod with an irradiance of 850 to 1,000 μmol PAR m−2 s−1 throughout the day at the top of the canopy.
After two-and-a-half weeks, seedlings were thinned to two plants per pot and supplied with the same nutrient solution until drainage. One week later, seedlings were thinned to one plant per pot and were similarly supplied with nutrient solution twice weekly. Supplemental KNO3 (12 mm) was supplied during rapid stem elongation (21–50 d after planting). All nutrient additions were terminated at silking, and water was supplied as required. Planting density was approximately six plants per square meter, which is equivalent to field densities for this genotype.
Low ψw Treatments
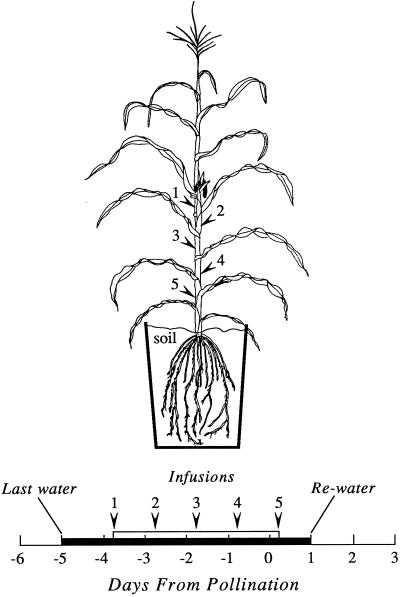
Plants were maintained at high ψw, except for a period of 6 d during flowering (Fig. 1). When silks first appeared (d −5 from pollination), the soil was brought to field capacity by supplying 4 L of water to each pot. Water was then withheld and was not fully resupplied until d 1. The silks fully emerged and the plants were pollinated on d 0. By rewatering on d 1, there was 1 d between pollination and rewatering to allow time for fertilization to occur when ψw was at its lowest. To minimize leaf senescence at low ψw, a small amount of water was supplied on d −1 and d 0 to replace the water lost the previous day (100–150 mL d−1). For the high ψw controls, the plants were maintained by watering to drainage daily throughout the flowering period (about 1,500 mL d−1).
Figure 1.
Schedule of watering and infusions for the low ψw treatment. Water was withheld at the times shown by the black bar. Infusions were made at the end of the dark periods, as shown by the white bar. Arrowheads 1 through 5 on the plant show infusion sites at each internode and correspond with arrowheads 1 through 5 on the white bar. A single infusion was made at sites 1 and 2. Two infusions were made at sites 3 to 5 to ensure uptake of 6.8 g of Suc.
Net photosynthesis was measured on the unshaded third leaf from the top of the plant, usually 3 h into the photoperiod, using a clamp-on cuvette in a closed system (Sheoran and Boyer, 1989). The ψw was determined on the same leaf using isopiestic thermocouple psychrometry according to the method of Boyer (1995). The ψw was also measured in the ovaries, which we defined as the lower, swollen part of the pistillate flower after the stigma and style were removed, and the glumes and lemmae were detached where possible (Kiesselbach, 1949). For the measurement, five to six pistils were excised from the ear, the silks and other structures were removed quickly, the ovaries were placed in a psychrometer cup, and the ψw was measured in an isopiestic thermocouple psychrometer (Boyer, 1995). After this measurement, the ovaries were removed from the cup, placed in a syringe barrel, frozen, thawed, and the cell solution was extracted by pressing on the syringe plunger. The osmotic potential (ψs) of the solution was determined in the isopiestic psychrometer according to the method of Boyer (1995). The turgor pressure (ψp) was determined with the following equation: ψp = ψw − ψs.
Stem Infusions
Suc solution from sugarcane (0.438 m, ψs = −1.1 MPa) was infused into some of the stems at low ψw using the method of Boyle et al. (1991a), except that the infusions were begun in the dark at the end of the night period, and the cavity was quickly filled with deionized water and sealed with a pre-assembled rubber septum/needle/syringe that acted as a reservoir. The Suc solution was decanted into the reservoir, the reservoir was covered with the rubber plunger of the syringe, and the air was vented using a 20-gauge needle. Infusions were usually installed within 30 s and sterile techniques were used when possible. There was a single infusion site per internode on d −4 and d −3, and two infusion sites per internode on d −2 to d 0 (Fig. 1). The ear internode and four additional internodes (one above and three below the ear internode) were used for the infusions. Each day, 45 mL of infusion medium (6.8 g of Suc) was supplied to every infused plant. This provided sufficient Suc to completely replace that normally produced by photosynthesis (Jurgens, et al., 1978; Westgate and Boyer, 1985a). Plants at high ψw were not infused, because a previous study (Zinselmeier et al., 1995a) found no effect of infusion at high ψw.
Pollination
Tassels were excised from each plant 1 to 2 d before the first silks appeared and stored at 4°C in a refrigerator with their bases in a nutrient solution (30 mm Suc, 0.02 m KNO3, 0.02 m NH4NO3, 1.25 mm KH2PO4, 3.0 mm CaCl2·2H2O, and 1.5 mm MgSO4·7H2O). The evening before pollination, tassels were brought to room temperature, and pollen was collected the next morning by shaking the tassels in a bag. The plants were immediately hand-pollinated by inverting the bag over the silks and shaking.
Metabolite Assays
Ovary samples were obtained from plants in each treatment and were immediately frozen in liquid N2, freeze-dried, and ground to a fine powder using a mortar and pestle. Suc and reducing sugars were analyzed on powder samples of 50 mg dry weight according to the method of Singletary and Below (1990) with slight modifications. Suc and reducing sugars were extracted three times using 80% (v/v) ethanol at 60°C. The supernatants were pooled and evaporated to dryness using forced air at 40°C. Suc and reducing sugars were resolubilized in 1 to 3 mL of water, sonicated, and mixed thoroughly. An aliquot was assayed in triplicate using the method of Handel (1968) for Suc and the method of Nelson (1944) for reducing sugars. Starch was analyzed in the insoluble pellet using a modified procedure from Hanft and Jones (1986). The pellet was washed with water, boiled to gelatinize the starch, and allowed to cool to room temperature. The starch was enzymatically degraded using a mixture of amyloglucosidase (2 mg mL−1) and amylase (1 mg mL−1) in 50 mm sodium acetate buffer (pH 4.5). Samples were incubated at 55°C for 2 h. An aliquot was removed and reducing sugars were quantified in triplicate according to the method of Nelson (1944).
Phosphorylated intermediates were extracted by the method of Jelitto et al. (1992) with a few modifications. Powder samples of 50 mg dry weight were transferred to 1.5-mL microcentrifuge tubes and 0.5 mL of 10% (v/v) TCA was added to each. After leaving the mixture on ice for 1 h, the tubes were centrifuged at 1,300g for 5 min, and the supernatant was collected. The pellet was resuspended twice in 0.3 mL of water, centrifuged, and the supernatant collected and combined with the first supernatant. The pellet was discarded. The extract was transferred to a 10-mL glass test tube and 1 mL of ethylether was added to extract the lipids. After vortexing, the mixture was centrifuged at 1,500g and the ethylether phase was discarded. The TCA extract was washed three more times with ethylether. After the final wash, the TCA extract was carefully transferred to microcentrifuge tubes and the volume was reduced to 0.6 mL in a freeze drier (Speed-Vac, Savant Instruments, Holbrook, NY). The extract was mixed with 5 mg of activated charcoal prewashed with water and centrifuged for 30 s at full speed in a microcentrifuge. The charcoal-treated extract was used for measuring UDP-Glc by the method of Keppler and Decker (1984); Glc-6-P, Glc-1-P, Fru-6-P, and 3-phosphoglyceric acid by the method of Stitt et al. (1989); and Pi by the method of Taussky and Shorr (1953). The extraction method and stability of metabolites during extraction was checked by measuring metabolites added to the homogenized tissue before extracting with TCA. The recovery for UDP-Glc was 79%, for Glc-6-P 85%, for Glc-1-P 76%, for Fru-6-P 98%, and for 3-phosphoglyceric acid 72%.
Enzyme Assays
All enzyme assays were optimized for substrate concentration, pH, and assay duration with the ovary extracts. Crude enzyme extracts were made from samples of 100 mg dry weight from the freeze-dried ovaries by grinding in a mortar and pestle in 4 mL of soluble extraction buffer containing 50 mm HEPES-NaOH (pH 7.2), 5.0 mm MgCl2, 15% (v/v) ethylene glycol, 1.0 mm EDTA, and 1.0 mm DTT (1 m NaCl also was added when extracting insoluble acid invertase). Samples were centrifuged at 14,000g for 4 min to pellet insoluble material, the soluble protein fraction was decanted, and the remaining pellet was washed three times with the soluble extraction buffer prior to repeating the extraction with the high-salt buffer for insoluble invertase. All extracts were desalted according to the micro-desalting procedure of Helmerhorst and Stokes (1980) by applying 450 μL of extract to a 3-mL column containing Sephadex G-25 and centrifuging at 750g for 2 min.
Acid invertase activity was divided into soluble and insoluble forms according to the method of Doehlert and Felker (1987). Activity was determined by mixing 100 μL of desalted extract, 200 mm sodium acetate (pH 4.8), and 100 mm Suc (1 mL final assay volume) and incubating at 30°C for 30 min. The reaction was terminated by adding 1 mL of Nelson's no. 1 reagent, and reducing sugars were quantified according to the method of Nelson (1944) using Glc as a standard (50–200 μg mL−1). Debranching enzyme (pullulanase or limit dextrinase) was determined according to the method of Doehlert and Kuo (1990) by mixing 100 μL of desalted extract, HEPES-NaOH (pH 7.2), 5.0 mm MgCl2, and 2.5% (w/v) pullulan (1 mL final assay volume), and incubating at 37°C for 60 min. The reaction was terminated by adding 3 mL of a dinitrosalicylic acid (DNS) solution. Reducing power was quantified using the DNS assay with maltotriose as a standard (0.5–3.5 mg mL−1). α-Glucosidase activity was determined according to the method of Okita et al. (1979) by mixing 100 μL of desalted extract, 50 mm citrate-HCl (pH 6.0), and 10 mm maltose (1 mL final assay volume), and incubating at 37°C for 60 min. The reaction was terminated by adding 3 mL of DNS solution. Reducing power was quantified using the DNS assay with Glc as a standard (1–4 mg mL−1). Total amylase activity was determined according to the method of Doehlert and Kuo (1990) by mixing 100 μL of desalted extract, 50 mm citrate-HCl (pH 6.0), and 2.5% (w/v) boiled soluble potato starch (1 mL final assay volume) and incubating at 37°C for 60 min. The reaction was terminated by adding 3 mL of DNS solution. Reducing power was quantified with the DNS assay using maltose as a standard (1–4 mg mL−1).
Comparing Enzyme Activities and Metabolite Contents
To conduct these experiments, it was necessary to express the metabolite contents and enzyme activities in a form that would allow a comparison between treatments. Expressing them per unit of dry weight was unsuitable as a basis of comparison because ovary sugars and starch accounted for 75% of the ovary dry weight at pollination, and these intermediates varied markedly with ψw. Ovary fresh weight was similarly unsatisfactory because water was 90% of the fresh weight and varied with ψw. Therefore, all measurements were expressed on a per-ovary basis.
Isotope Labeling
To determine whether the carbon in the Suc fed to the stems was transported to the ovaries, we fed Suc from sugar beet instead of sugarcane. The sugar beet Suc had been synthesized by C-3 photosynthesis and was impoverished in 13C, but the dry matter of the maize ovaries had been synthesized in the parent plant by C-4 photosynthesis and did not show this impoverishment. The 13C was defined by the δ13C ratio = 1,000 × (Rsample − Rstandard)/ (Rstandard), where R is 13C/12C and the standard is Pee Dee Belemnite. The δ13C ratio for the sugar beet Suc was −25 and for the ovaries was −12
 . Therefore, transport of infused Suc carbon to the ovaries could be detected by a δ13C ratio below −12
 . Sugar beet Suc was obtained from a market and fed to stems as above. Individual ovaries were sampled from developing ears, freeze-dried, weighed, sealed in aluminum tinfoil cups, and the δ13C ratio of the dry matter was determined in a ratio mass spectrometer after combustion to CO2. It should be noted that the arrival of sugar beet carbon at the ovaries diluted the maize dry mass already present, and the experiment thus detected the arrival of substrate quantities of Suc carbon.
Microscopy
Ovaries were removed from developing ears and sectioned in the midplane parallel to the long axis of the ear. The sections were stained with I2-KI solution (0.20% [w/w] I2 and 0.53% [w/w] KI), briefly rinsed with deionized water, and viewed under a dissecting microscope.
RESULTS
Ovary Starch Dynamics
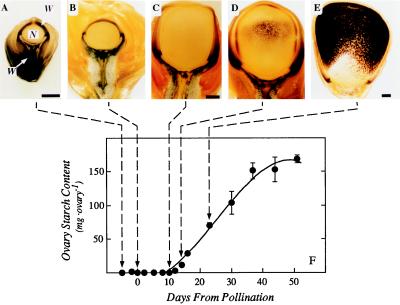
Starch occupied the ovary tissues around the nucellus (ovary wall) and surrounded the vascular tissues at the base of the ovary before the young pistils were pollinated (Fig. 2A). There was no starch in the nucellus. As the ovary enlarged during and after pollination, starch remained in the same tissues (Fig. 2, B–D). By d 10, the nucellus and starch-containing tissues in the wall were pushed to the periphery of the ovary by the developing endosperm (Fig. 2, C and D). At d 12, starch began to be deposited in the endosperm, and endosperm activity began to dominate the biosynthetic activity of the ovary (Fig. 2, D and E). The final starch content of the mature kernel was large compared with that in the ovary at the time of pollination (Fig. 2F).
Figure 2.
Starch location and amount in maize ovaries and developing kernels. A, Ovary on d −5 before pollination. Starch (region stained black) is located at the ovary base around the phloem and in the ovary tissues around the nucellus (ovary wall). The nucellus occupies the center of the ovary and is starchless. The embryo sac is not present in this section. Silk normally attached to the ovary apex has been removed. W, Ovary wall; N, nucellus, V, vein. B, Ovary at pollination on d 0. The location of starch is similar to that in A. Magnification is the same as in A. C, Ovary on d 10 after pollination. Endosperm occupies most of the ovary interior, and the nucellus is at the periphery, inside the starch-containing ovary wall. D, Ovary on d 12. Starch deposition is beginning in the endosperm. The nucellus is at the periphery, inside the starch-containing ovary wall. Magnification is the same as in C. E, Ovary on d 23. Starch is being rapidly deposited in the endosperm. The nucellus and ovary wall are forming the outer covering of the caryopsis. F, Starch content of the ovaries as they develop into mature caryopses. Bars in A, C, and E indicate 1 mm for all micrographs.
When we subjected plants to the low ψw treatment starting on d −5 (Fig. 1), the leaf ψw decreased (Table I). By d 0, it reached about −1.3 MPa and net photosynthesis decreased to 26% to 34% of the control rate (Table I). The plants were hand-pollinated on that day. After allowing 1 d for fertilization, the plants were rewatered at the end of d 1, and ψw and photosynthesis returned to control levels by the next day (d 2, data not shown; for examples in similar experiments, see Boyle et al., 1991b; Zinselmeier et al., 1995a). Using light microscopy, Westgate and Boyer (1986) showed that embryos were present but were aborted by this treatment. We judged whether embryos developed according to the number of kernels that developed. The short exposure to low ψw decreased the number of kernels to 7.4% of the control at high ψw (Table I) and thus disrupted embryo development.
Table I.
Kernel number, leaf ψw, and net photosynthesis in maize deprived of water around the time of pollination
| Treatment | Kernel No. per Plant | Leaf ψw at Pollination | Net Photosynthesis at Pollination |
|---|---|---|---|
| MPa | μmol m−2 s−1 | ||
| Control | 484 ± 91 | −0.45 ± 0.03 | 22.0 ± 3.5 |
| Low ψw | 36 ± 25 | −1.25 ± 0.11 | 7.5 ± 2.0 |
| Low ψw + Suc | 301 ± 53 | −1.30 ± 0.10 | 5.8 ± 1.6 |
ψw and photosynthesis were measured on the day of pollination (d 0 in Fig. 1) on the third leaf at the top of the plant 3 h into the photoperiod. Kernel number was determined at maturity. Adequate water was supplied to controls, and water was withheld from low ψw plants for 5 d prior to the measurements (see Fig. 1). Data are means ± se of four to six plants.
Suc was fed to some of the stems starting on d −4 and continuing until the day of pollination (d 0). With Suc infusion, embryo development continued in 62% of the ovaries (Table I). Sufficient Suc was fed to replace the photosynthate not being produced by the leaves. The leaves normally produced 5 g of dry mass per day at pollination (Jurgens et al., 1978), and 6.8 g was the amount fed. The feeding during low ψw allowed embryo development to continue, but the major part of kernel development occurred afterward, when photosynthesis had returned to control levels. Thus, the feeding partially prevented the disruption of embryo development by low ψw, and the parent plant continued to grow the kernel after water was resupplied.
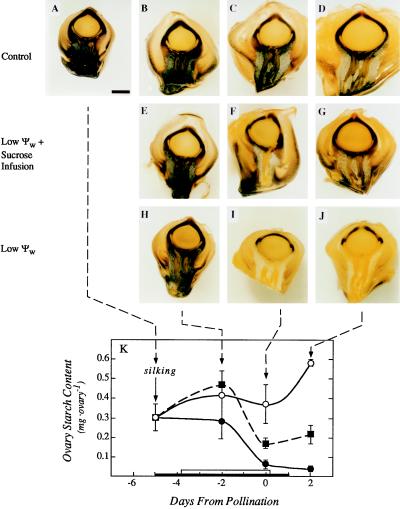
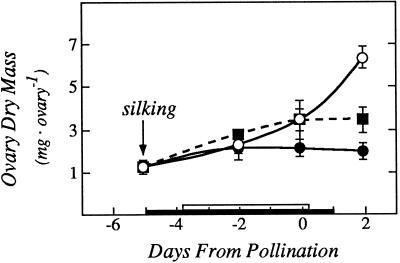
The low leaf ψw caused the ovaries to lose their starch (Fig. 3). Starch had disappeared from the basal tissue and most of the ovary wall by d 0 and 2 of the low ψw treatment (Fig. 3, I and J), while the controls showed a normal starch distribution (Fig. 3, C and D). Feeding Suc to the stems during the low ψw treatment partly maintained the starch in the ovaries (Fig. 3, F and G). Quantitative analyses confirmed the starch depletion at low ψw and the partial maintenance by Suc feeding (Fig. 3K). The starch depletion was reflected in a low accumulation of ovary dry matter that was partly reversed by Suc feeding (Fig. 4).
Figure 3.
Starch location and amount in maize ovaries around the time of pollination, showing the effects of Suc fed to the stems at low ψw. A, Ovary on d −5 before pollination. Bar indicates 1 mm for all micrographs. B, Ovary on d −2 before pollination. C, Ovary on d 0 at pollination. D, Ovary on d 2 after pollination. Note that starch (region stained black) is present at the ovary base around the phloem and in the ovary tissues around the nucellus. E through G, Same as B through D except water was withheld on d −5 before pollination and resupplied on d 1 after pollination, and stems were fed with Suc solution starting on d −4. Starch location is unchanged from B through D. H through J, Same as E through G except no Suc was fed to the stems. In I and J, starch has nearly disappeared from the ovary base around the phloem and the ovary tissues around the nucellus. K, Starch contents of ovaries in micrographs. The black bar on the x axis shows time when water was withheld from the soil and the white bar shows time when Suc was infused into the stems, as in Figure 1. Data are means ± sd of six plants. ○, Control; ▪, low ψw + Suc infusion; •, low ψw.
Figure 4.
Ovary dry mass showing effects of Suc fed to the stems at low ψw. The black bar on the x axis shows time when water was withheld from the soil and the white bar shows time when Suc was infused into the stems, as in Figures 1 and 3. Data are means ± sd for six plants. ○, Control; •, low ψw; ▪, low ψw + Suc infusion.
Instead of feeding Suc from a C-4 plant (sugarcane) to the maize stems (also C-4), we fed C-3 Suc from a C-3 plant (sugar beet) in order to determine whether the natural label in the C-3 sugar reached the ovaries. The lower δ13C ratio of the Suc from sugar beet caused the δ13C ratio to decrease in the ovaries (Fig. 5). The decrease could be observed at the first sampling in fed plants at low ψw. Similarly feeding controls also decreased the δ13C ratio. Without Suc infusion, the δ13C ratio did not decrease at low ψw or in the controls, indicating that the label in the stem-fed Suc was being rapidly transported to the ovaries.
Figure 5.
Ovary δ13C ratios showing effects of sugar beet Suc fed to the stems at low ψw around the time of pollination. The black bar on the x axis shows time when water was withheld from the soil and the white bar shows time when Suc was infused into the stems, as in Figures 1 and 3. Data are means ± sd for three plants. ○, High ψw; ▵, high ψw + sugar beet Suc; •, low ψw; ▪, low ψw + sugar beet Suc.
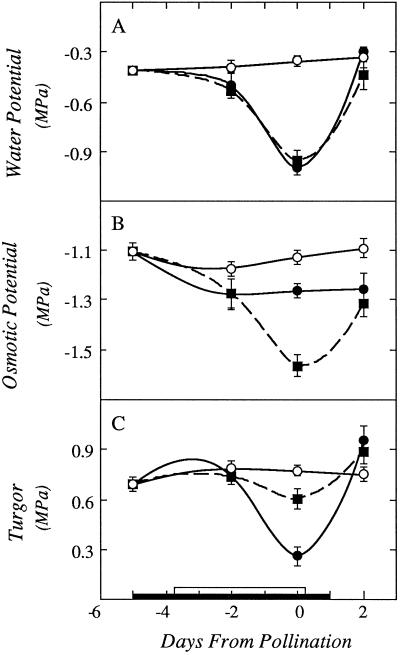
Suc feeding did not change leaf ψw or photosynthesis (Table I), and it also had no effect on ovary ψw (Fig. 6A). However, it altered the components of ovary ψw. There was only a slight decrease in ovary ψs in the unfed plants, but a large decrease in ovary ψs in the fed plants (Fig. 6B). As a result, the ovary ψp decreased substantially at low ψw but was essentially maintained in the fed plants (Fig. 6C). The difference in ψs of the fed and unfed plants showed that stem feeding increased the solute concentration in the ovaries, and ψp improved as a result.
Figure 6.
Effects of withholding water and feeding Suc to the stems around the time of pollination on ψw (A), ψs (B), and ψp (C). On the x axis, the black bar shows time when water was withheld from the soil and the white bar shows time when Suc was infused into the stems, as in Figures 1 and 3. Data are means ± sd for six plants. ○, Control; •, low ψw; ▪, low ψw + Suc infusion.
Regulation of Starch Biosynthesis within the Ovaries
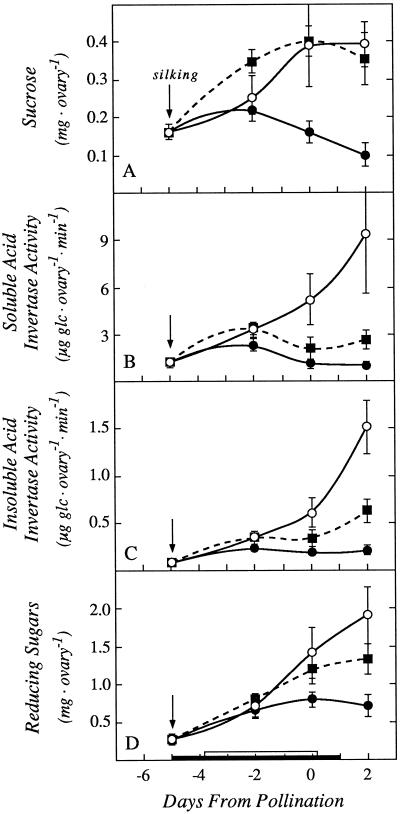
During the early development of maize ovaries, Suc metabolism starts with acid invertase (Shannon and Dougherty, 1972; ap Rees, 1984; Doehlert and Felker, 1987; Xu et al., 1995), and mutants of this enzyme block much of the development (Miller and Chourey, 1992; Cheng et al., 1996). Ovary Suc levels decreased at low ψw. When we fed Suc to the stems, the ovary Suc increased to control levels (Fig. 7A). The activities of soluble and insoluble acid invertases were markedly decreased at low ovary ψw compared with the controls, and Suc feeding caused a slight recovery (Fig. 7, B and C). The reducing sugars were decreased at low ψw, and Suc feeding also caused a partial recovery (Fig. 7D). The reducing sugars are the product of the invertase reaction, and their lack of full recovery with stem feeding was apparent when contrasted with the recovery of substrate Suc (compare Fig. 7, A and D, on d 0 and 2).
Figure 7.
Ovary Suc content, acid invertase activity, and reducing sugar content showing effects of withholding water and feeding Suc to the stems around the time of pollination. A, Suc (invertase substrate). B, Soluble acid invertase activity. C, Insoluble acid invertase activity. D, Reducing sugars (invertase product). The black bar on the x axis shows time when water was withheld from the soil and the white bar shows time when Suc was infused into the stems, as in Figures 1 and 3. Data are means ± sd for six plants. ○, Control; •, low ψw; ▪, low ψw + Suc infusion.
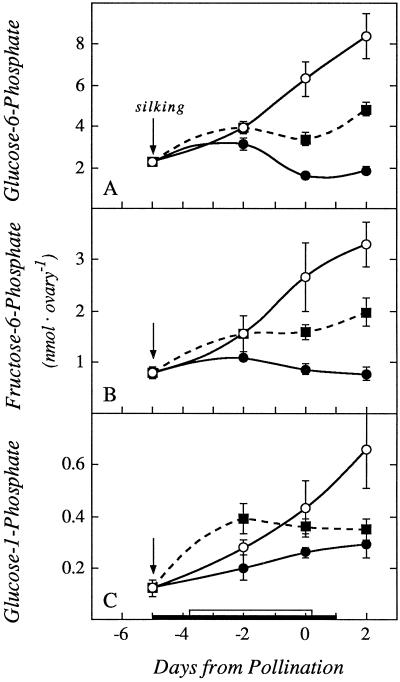
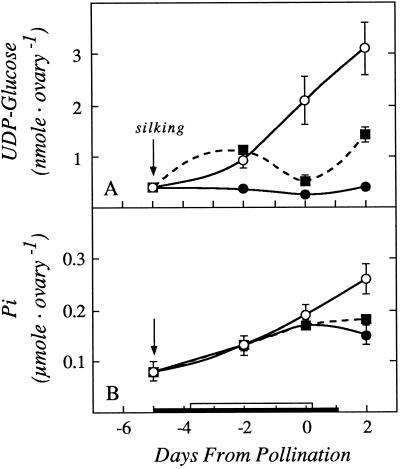
In all of the succeeding pools of phosphorylated intermediates for starch biosynthesis (Glc-6-P, Fru-6-P, and Glc-1-P), a similar pattern of depletion at low ψw and partial recovery with Suc infusion was observed (Fig. 8). For UDP-Glc, which is interconvertible to ADP-Glc (the likely substrate for starch biosynthesis), there was a marked depletion at low ψw (Fig. 9A) and only a partial recovery when Suc was fed. As an internal control, we measured the pool of Pi. Because the pool was large and mostly inorganic, it would be expected to be less affected than the pools of phosphorylated intermediates. Figure 9B shows that both the low ψw treatment and Suc feeding had only a slight effect.
Figure 8.
Ovary contents of Glc-6-P (A), Fru-6-P (B), and Glc-1-P (C) showing effects of withholding water and feeding Suc to the stems around the time of pollination. The black bar on the x axis shows time when water was withheld from the soil and the white bar shows time when Suc was infused into the stems, as in Figures 1 and 3. Data are means ± sd for six plants. ○, Control; •, low ψw; ▪, low ψw + Suc infusion.
Figure 9.
Ovary contents of UDP-Glc (A), and Pi (B) showing effects of withholding water and feeding Suc to the stems around the time of pollination. The black bar on the x axis shows time when water was withheld from the soil and the white bar shows time when Suc was infused into the stems, as in Figures 1 and 3. Data are means ± sd for six plants. ○, Control; •, low ψw; ▪, low ψw + Suc infusion.
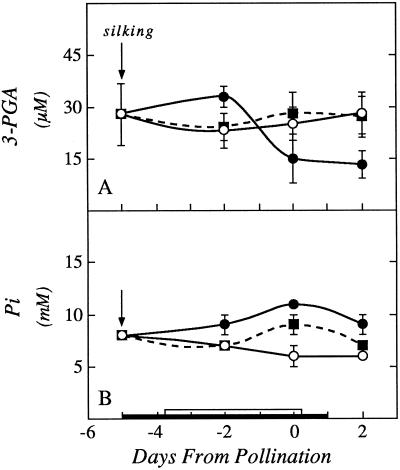
Regardless of the availability of intermediates in starch biosynthesis, the concentration of phosphate and certain phosphorylated intermediates can affect starch biosynthesis. In leaf chloroplasts, starch can accumulate and is regulated by the concentration of 3-phosphoglyceric acid, which stimulates synthesis, and Pi, which inhibits it (Plaxton and Preiss, 1987; Preiss, 1988). We analyzed 3-phosphoglyceric acid and expressed the concentration according to the total water content of the ovaries (Fig. 10A). The concentration was low and became somewhat lower at low ψw, and was fully restored by feeding Suc to the stems. On the other hand, the Pi concentration expressed similarly was 6 to 8 mm in the controls, which is in the regulatory range (Fig. 10B). The concentration increased to about 11 mm as the ovaries dehydrated. The concentration returned partially to control levels when Suc was fed to the stems.
Figure 10.
Ovary concentrations of 3-phosphoglyceric acid (A) and Pi (B) showing effects of withholding water and feeding Suc to the stems around the time of pollination. Concentrations are based on the total water content of the ovaries. The black bar on the x axis shows time when water was withheld from the soil and the white bar shows time when Suc was infused into the stems, as in Figures 1 and 3. Data are means ± sd for six plants. ○, Control; •, low ψw; ▪, low ψw + Suc infusion.
Starch Breakdown within the Ovaries
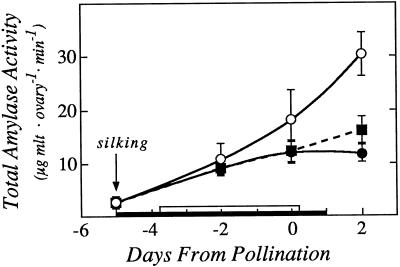
The total amylase activity in the ovaries was large (Fig. 11). Because the assays indicated the maximum velocity for the enzyme, they do not represent in vivo activity, but the measured activity was sufficient to break down the ovary starch pool in about 20 min and thus was consistent with the starch breakdown we observed in vivo. The activity was moderately decreased at low ψw, and there was a slight recovery when Suc was fed. Activities of debranching enzyme and α-glucosidase were below the limits of reliable detection (data not shown).
Figure 11.
Amylase activity in ovaries showing effects of withholding water and feeding Suc to the stems around the time of pollination. The black bar on the x axis shows time when water was withheld from the soil and the white bar shows time when Suc was infused into the stems, as in Figures 1 and 3. Data are means ± sd for six plants. ○, Control; •, low ψw; ▪, low ψw + Suc infusion.
DISCUSSION
Ovary Starch Dynamics
Starch was a major constituent of maize ovaries before pollination and therefore before any endosperm was present. It was readily mobilized, in contrast to endosperm starch, which does not turn over until the kernel matures, dehydrates, and resumes development during germination. The ovary pool nearly disappeared when ψw became low enough to inhibit photosynthesis, whereupon embryo development was irreversibly arrested. The disappearance of starch indicated the end of sugar availability. Because this was lethal, the starch disappearance was the central event controlling embryo development and thus kernel number.
Figure 12 shows the likely path for Suc delivery and starch mobilization when photosynthesis was inhibited at low ψw. Sugars were delivered to the base of the ovary, where they were incorporated into expanding ovary structures or starch around the veins and nucellar tissue. When photosynthesis was inhibited, the starch broke down and allowed ovary development to continue with the released sugars. When the starch was depleted, the embryos aborted and ovary development ceased.
Figure 12.
Dynamics of ovary starch leading to embryo abortion at low ψw. A, Suc is delivered to the tissues below the ovary (large arrow) and either used in developing structures or stored as starch around the veins and in the ovary tissues around the nucellus (small arrows). B, With inhibited photosynthesis, Suc delivery is curtailed (▪ ▪ ▪), starch is mobilized (small arrows), and ovary development continues. C, When the starch is depleted, ovary development ceases irreversibly. The final kernel number is diminished accordingly.
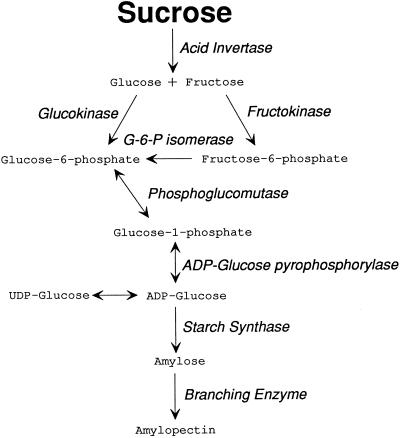
Feeding substrate quantities of Suc to the stems of the parent plant prevented some of the starch disappearance and some of the arrest in embryo development. However, we were unable to rescue all of the embryos, indicating that other factors also were important. One of these factors could have been transport, but labeled Suc was delivered from the stems to the ovaries and resulted in substantial increases in solute concentrations inside the ovaries, including Suc. Therefore, an internal block in starch biosynthesis was more likely to have been the cause. The sugar and phosphorylated intermediates likely to be involved are shown in Figure 13, and all of them were depleted at low ψw.
Figure 13.
Likely pathway of starch biosynthesis in maize ovaries around the time of pollination. Bold print shows that Suc accumulated with Suc feeding at low ψw. Light print shows that all other metabolites were depleted despite Suc feeding at low ψw. The depletion indicates that a block occurs at the first step in the pathway (acid invertase).
Feeding Suc to the stems returned Suc in the ovaries to control levels, but did not fully return the other pools (Fig. 13). As a consequence, carbon flow in the ovaries was restricted at the first step of the path, impoverishing all of the downstream pools. This block thus regulates starch synthesis to a considerable degree. The first step is mediated by invertase (Shannon and Dougherty, 1972; ap Rees, 1984; Doehlert and Felker, 1987; Miller and Chourey, 1992; Xu et al., 1995; Cheng et al., 1996), and its low activity at low ψw supports the concept that it restricted carbon flow.
These results indicate that the young ovaries were markedly dependent on carbon flow, and a short time without carbon was lethal. Kernel number at maturity was determined by this flow. In maize grown under our conditions, stored reserves were sometimes low and were not drawn upon when young ovaries were developing at low ψw (Westgate and Boyer, 1985a). Decreasing photosynthesis thus had an immediate inhibitory effect on the sugar stream to the ovaries (Westgate and Boyer, 1986; Boyle et al., 1991b; Schussler and Westgate, 1995). When the decreased sugar stream was coupled with decreased carbon processing inside the ovaries, kernel number was markedly decreased. Later in kernel development, sugar reserves were abundant in the stems and leaves of the parent plant, and the sugars were mobilized to support kernel development when photosynthesis was inhibited (McPherson and Boyer, 1977; Jurgens et al., 1978; Westgate and Boyer, 1985a). At that time, kernel number was unaffected and the kernels matured with a smaller size because of the diminished amount of total carbon. This difference in reserve mobilization appears to explain why the kernel number is determined early but size is determined later in reproductive development.
The delivery of Suc was the key to these findings. The rapidity of uptake of the fed solution suggests that absorption was by the exposed xylem vessels, with the leaves as the first destination. Suc was probably loaded into the phloem by the leaves and delivered to other parts of the plant. It was essential to feed quantities of Suc comparable to those produced by photosynthesis in the whole parent plant. In earlier experiments, we varied the amount of fed Suc but failed to rescue the developing kernels with lesser amounts (data not reported). Assuming 500 ovaries per plant and a weight gain of 1 mg in each ovary because of Suc feeding, the amount of Suc needed to account for Suc delivery to the ovaries was only 0.5 g. About 6.8 g of Suc was fed each day to the plant. We assume that such large quantities were required because the phloem delivered Suc to various tissues, and the ovaries were only one of the beneficiaries.
Although label in fed Suc was delivered to the ovaries and there was elevated Suc in the ovary tissues, we do not know whether the label was delivered to the same sites that it would be during normal photosynthesis. The analyses required the ovaries to be removed from the ear, and some of the basal tissue inevitably remained attached to the ovary. Because Suc was delivered to the base of the ovaries by the phloem, which is not directly attached to the ovary interior, it is possible that some of the delivered Suc remained in the basal tissues. Schussler and Westgate (1991) showed that ovaries isolated from maize ears at low ψw absorbed Suc less rapidly than controls. Some of the Suc could have arrived at the phloem-unloading sites and been detected in the label and Suc assays, but may not have been delivered to particular ovary tissues where invertase activity was controlled.
Water Relations and Starch Regulation
The Suc feeding had no effect on the ψw of the ovaries or leaves, probably because the ψs of the fed Suc (−1.1 MPa) was so similar to the ψw of these organs (−1 and −1.3 MPa in ovaries and leaves, respectively, at pollination). Also, the volume of fed solution was small (45 mL d−1) compared with water flux through the plant at low ψw (150 mL d−1). Boyle et al. (1991b) and Zinselmeier et al. (1995a) found no effect of the fed solution on leaf ψw or photosynthesis with similar treatments.
Nevertheless, there was a marked effect on the components of ψw. The ψs of the ovaries decreased more at low ψw when Suc was fed than when it was not. For each ovary, about 0.2 mg of new Suc and 0.3 mg of new reducing sugar accumulated because of the feeding and was present in about 20 mg of the total ovary water. These new solutes represent a calculated change in ψs of −0.31 MPa, and the feeding-induced change that was measured was about −0.35 MPa. This osmotic adjustment (Meyer and Boyer, 1972; Morgan, 1984) was thus dependent on Suc feeding. In effect, we were able to “turn on” osmotic adjustment in the ovaries by feeding Suc to the stems. The ovaries were more turgid as a result. Whether the higher turgidity caused more growth is uncertain, but the accumulation of these large amounts of sugars during osmotic adjustment indicated that additional substrate was present for ovary metabolism. In agreement with these experiments, Westgate and Boyer (1985b) could not find osmotic adjustment in developing silks of pistillate florets from unfed plants at low ψw.
Because the ovaries of unfed plants showed little osmotic adjustment and had low turgor, their water content was diminished at low ψw. This had the effect of concentrating solute in the cells. One consequence was an increase in the concentration of Pi when ovaries had low ψw (even though the content of Pi was similar for the treatments). While the cellular distribution of Pi was not investigated, most of it was likely to have been in the vacuoles of the ovary cells, and its inhibitory action takes place in the plastids. Nevertheless, the high overall concentration of Pi at low ψw is consistent with a possible decrease in starch biosynthesis by feedback inhibition similar to that described by Plaxton and Priess (1987) and Priess (1988). The effect was partially reversed when Suc was fed at low ψw and thus was consistent with the reversal of starch depletion in these plants.
Regulation of Kernel Number
The mechanisms controlling kernel number are of considerable interest. In their extensive review of how water affects crop reproduction, Salter and Goode (1967) concluded that water supply is the most important to reproduction during the early stages, around pollination and early fruit formation, when seed and fruit number are determined. However, they cited little information about the mechanisms of the losses. It is often proposed that low ψw at these stages can prevent pollination or cause pollen sterility in maize (Lonnquist and Jugenheimer, 1943; Herrero and Johnson, 1981; Bassetti and Westgate, 1993). Although this clearly can occur (for review, see Saini, 1997), it was not a factor here. We pollinated by hand to ensure that pollination occurred. We showed that pollen collected from plants at low ψw was viable and could maintain viability when it was highly desiccated (Westgate and Boyer, 1986). We pollinated when ψw was at its lowest and dehydration of the plant was the most severe. Zygotes could be seen in micrographs of the arrested ovaries (Westgate and Boyer, 1986). Therefore, pollination and fertilization were not factors, and the block in kernel development occurred afterward, while the zygotes were developing.
These results indicate that pollination and fertilization were less affected than embryo and ovary development as the sugar stream diminished at low ψw around the time of pollination. It seems that mature pollen may have had its own reserves, as observed by Sheoran and Saini (1996) in rice, and that reserves were present in the embryo sac, although we did not explore either of these possibilities. If so, the success of fertilization may have depended on these local reserves, while the susceptibility of embryo development may have depended on starch reserves around the nucellus and in the ovary basal tissues.
Other factors may also contribute to the control of kernel number. Low ψw causes increased ABA concentrations in plants. Saini (1997) pointed out that infusing ABA into stems of barley caused pollen abortion, and Morgan (1980) showed that spraying ABA on wheat plants had a similar effect. It is possible that ABA causes stomatal closure and decreases photosynthesis, and if this is the case, then ABA might have its influence through an effect on carbon availability similar to that seen here.
ACKNOWLEDGMENTS
We thank Dr. An-Ching Tang for help with some of the artwork, Larry Giles for measuring δ13C ratios, Elizabeth Oelke for a gift of sugar beet Suc, and Dr. George Singletary for suggestions about the storage of maize pollen.
Footnotes
This work was supported by the U.S. Department of Agriculture National Research Initiative Competitive Grants Program (grant nos. 91–37100–6617 and 94–37100–0753).
LITERATURE CITED
- ap Rees T. Sucrose metabolism. In: Lewis DH, editor. Storage Carbohydrates in Vascular Plants. London: Cambridge University Press; 1984. pp. 53–73. [Google Scholar]
- Bassetti P, Westgate M. Water deficit affects receptivity of maize silks. Crop Sci. 1993;33:279–282. [Google Scholar]
- Boyer JS. Measuring the Water Status of Plants and Soils. San Diego: Academic Press; 1995. [Google Scholar]
- Boyle MG, Boyer JS, Morgan PW. Stem infusion of maize plants. Crop Sci. 1991a;31:1241–1245. [Google Scholar]
- Boyle MG, Boyer JS, Morgan PW. Stem infusion of liquid culture medium prevents reproductive failure of maize at low water potentials. Crop Sci. 1991b;31:1246–1252. [Google Scholar]
- Caspar T. Genetic dissection of the biosynthesis, degradation, and biological functions of starch. In: Meyerowitz EM, Somerville CR, editors. Arabidopsis. Cold Spring Harbor, NY: Cold Spring Harbor Laboratory; 1994. pp. 913–936. [Google Scholar]
- Cheng WH, Taliercio EW, Chourey PS. The miniature1 seed locus of maize encodes a cell wall invertase required for normal development of endosperm and maternal cells in the pedicel. Plant Cell. 1996;8:971–983. doi: 10.1105/tpc.8.6.971. [DOI] [PMC free article] [PubMed] [Google Scholar]
- Doehlert DC, Felker FC. Characterization and distribution of invertase activity in developing maize (Zea mays L.) kernels. Physiol Plant. 1987;70:51–57. [Google Scholar]
- Doehlert DC, Kuo TM. Sugar metabolism in developing maize kernels of starch deficient endosperm mutants of maize. Plant Physiol. 1990;92:990–994. doi: 10.1104/pp.92.4.990. [DOI] [PMC free article] [PubMed] [Google Scholar]
- Fader GM, Koller HR. Seed growth rate and carbohydrate pool sizes of the soybean fruit. Plant Physiol. 1985;79:663–666. doi: 10.1104/pp.79.3.663. [DOI] [PMC free article] [PubMed] [Google Scholar]
- Handel EV. Direct microdetermination of sucrose. Anal Biochem. 1968;22:280–283. doi: 10.1016/0003-2697(68)90317-5. [DOI] [PubMed] [Google Scholar]
- Hanft JM, Jones RJ. Kernel abortion in maize. I. Carbohydrate concentration patterns and acid invertase activity of maize kernels induced to abort in vitro. Plant Physiol. 1986;81:503–510. doi: 10.1104/pp.81.2.503. [DOI] [PMC free article] [PubMed] [Google Scholar]
- Helmerhorst E, Stokes GB. Microcentrifuge desalting: a rapid, quantitative method for desalting small amounts of protein. Anal Biochem. 1980;104:130–135. doi: 10.1016/0003-2697(80)90287-0. [DOI] [PubMed] [Google Scholar]
- Herrero MP, Johnson RR. Drought stress and its effect on maize reproductive systems. Crop Sci. 1981;21:105–110. [Google Scholar]
- Hoagland DR, Arnon DI. The water culture method for growing plants without soil. Calif Agric Exp Stn Circ. 1950;347:1–32. [Google Scholar]
- Jelitto T, Sonnewald U, Willmitzer L, Hajirezeai M, Stitt M. Inorganic pyrophosphate content and metabolites in potato and tobacco plants expressing E. coli pyrophosphatase in their cytosol. Planta. 1992;188:238–244. doi: 10.1007/BF00216819. [DOI] [PubMed] [Google Scholar]
- Jurgens SK, Johnson RR, Boyer JS. Dry matter production and translocation in maize subjected to drought during grain fill. Agron J. 1978;70:678–682. [Google Scholar]
- Keppler D, Decker K (1984) Uridine 5′-diphosphoglucose and uridine 5′-diphosphogalactose. In HU Bermeyer, ed, Methods of Enzymatic Analysis, Vol VII: Metabolites 2. Verlag Chemie, Weinheim, Germany, pp 524–530
- Kiesselbach TA (1949) The Structure and Reproduction of Corn. University of Nebraska Press, Lincoln
- Kramer PJ, Boyer JS. Water Relations of Plants and Soils. San Diego: Academic Press; 1995. [Google Scholar]
- Lonnquist JH, Jugenheimer RW. Factors affecting the success of pollination in corn. J Am Soc Agron. 1943;35:923–933. [Google Scholar]
- McPherson HG, Boyer JS. Regulation of grain yield by photosynthesis in maize subjected to a water deficiency. Agron J. 1977;69:714–718. [Google Scholar]
- Meyer RF, Boyer JS. Sensitivity of cell division and cell elongation to low water potentials in soybean hypocotyls. Planta. 1972;108:77–87. doi: 10.1007/BF00386508. [DOI] [PubMed] [Google Scholar]
- Miller ME, Chourey PS . The maize invertase-deficient miniature-1 seed mutation is associated with aberrant pedicel and endosperm development. Plant Cell. 1992;4:297–305. doi: 10.1105/tpc.4.3.297. [DOI] [PMC free article] [PubMed] [Google Scholar]
- Morgan JM. Possible role of abscisic acid in reducing seed set in water-stressed wheat plants. Nature. 1980;289:655–657. [Google Scholar]
- Morgan JM. Osmoregulation and water stress in higher plants. Annu Rev Plant Physiol. 1984;35:299–319. [Google Scholar]
- Nelson N. A photometric adaptation of the Somogyi method for the determination of glucose. J Biol Chem. 1944;153:375–380. [Google Scholar]
- Okita TW, Greenberg E, Kuhn DN, Preiss J. Subcellular localization of the starch degradative and biosynthetic enzymes of spinach leaves. Plant Physiol. 1979;64:187–192. doi: 10.1104/pp.64.2.187. [DOI] [PMC free article] [PubMed] [Google Scholar]
- Plaxton WC, Preiss J. Purification and properties of nonproteolytic degraded ADPglucose pyrophosphorylase from maize endosperm. Plant Physiol. 1987;83:105–112. doi: 10.1104/pp.83.1.105. [DOI] [PMC free article] [PubMed] [Google Scholar]
- Preiss J (1988) Biosynthesis of starch and its regulation. In The Biochemistry of Plants, Vol 14. Academic Press, San Diego, pp 181–254
- Saini H. Effects of water stress on male gametophyte development in plants. Sex Plant Reprod. 1997;10:67–73. [Google Scholar]
- Salter PJ, Goode JE (1967) Crop Responses to Water at Different Stages of Growth. Commonwealth Agricultural Bureaux, Farnham Royal, Buckinghamshire, UK
- Schussler JR, Westgate ME. Maize kernel set at low water potential: II. Sensitivity to reduced assimilates at pollination. Crop Sci. 1991;31:1196–1203. [Google Scholar]
- Schussler JR, Westgate ME. Assimilate flux determines kernel set at low water potential in maize. Crop Sci. 1995;35:1074–1080. [Google Scholar]
- Shannon JC, Dougherty CT. Movement of C14-labeled assimilates into kernels of Zea mays L. II. Invertase activity of the pedicel and placento-chalazal tissues. Plant Physiol. 1972;49:203–206. doi: 10.1104/pp.49.2.203. [DOI] [PMC free article] [PubMed] [Google Scholar]
- Shannon JC, Garwood DL. Genetics and physiology of starch development. In: Whistler RL, BeMiller JN, Paschall EF, editors. Starch: Chemistry and Technology, Ed 2. Orlando: Academic Press; 1984. pp. 25–86. [Google Scholar]
- Sheoran IS, Boyer JS. Simplified technique for rapidly measuring CO2 exchange in intact leaves. Photosynthetica. 1989;23:646–654. [Google Scholar]
- Sheoran IS, Saini HS. Drought-induced male sterility in rice: changes in carbohydrate levels and enzyme activities associated with the inhibition of starch accumulation in pollen. Sex Plant Reprod. 1996;9:161–169. [Google Scholar]
- Singletary GW, Below FE. Nitrogen-induced changes in the growth and metabolism of developing maize kernels grown in vitro. Plant Physiol. 1990;92:160–167. doi: 10.1104/pp.92.1.160. [DOI] [PMC free article] [PubMed] [Google Scholar]
- Stitt M, Lilley RM, Gerhardt R, Heldt HW (1989) Metabolite levels in specific cells and subcellular compartments of plant leaves. In S Fleischer, B Fleischer, eds, Methods in Enzymology, Vol 174. Academic Press, New York, pp 518–552
- Taussky HH, Shorr E. A microcolorimetric method for the determination of inorganic phosphorus. J Biol Chem. 1953;202:675–685. [PubMed] [Google Scholar]
- Westgate ME, Boyer JS. Carbohydrate reserves and reproductive development at low water potentials in maize. Crop Sci. 1985a;25:762–769. [Google Scholar]
- Westgate ME, Boyer JS. Osmotic adjustment and the inhibition of leaf, root, stem and silk growth at low water potentials in maize. Planta. 1985b;164:540–549. doi: 10.1007/BF00395973. [DOI] [PubMed] [Google Scholar]
- Westgate ME, Boyer JS. Reproduction at low silk and pollen water potentials in maize. Crop Sci. 1986;26:951–956. [Google Scholar]
- Xu J, Avigne WT, McCarty DR, Koch KE. A similar dichotomy of sugar modulation and developmental expression affects both paths of sucrose metabolism: evidence from a maize invertase gene family. Plant Cell. 1995;8:1209–1220. doi: 10.1105/tpc.8.7.1209. [DOI] [PMC free article] [PubMed] [Google Scholar]
- Zinselmeier C, Lauer MJ, Boyer JS. Reversing drought-induced losses in grain yield: sucrose maintains embryo growth in maize. Crop Sci. 1995a;35:1390–1400. [Google Scholar]
- Zinselmeier C, Schussler JR, Westgate ME, Jones RJ. Low water potential disrupts carbohydrate metabolism in maize ovaries. Plant Physiol. 1995b;107:385–391. doi: 10.1104/pp.107.2.385. [DOI] [PMC free article] [PubMed] [Google Scholar]


