Abstract
Although therapeutic effects of the peroxisome proliferator-activated receptor gamma (PPAR-γ) agonists rosiglitazone and pioglitazone against Cushing's disease have been reported, their effects are still controversial and inconsistent. We therefore examined the effects of a novel PPAR-γ agonist, MEKT1, on Pomc expression/ACTH secretion using murine corticotroph-derived AtT20 cells and compared its effects with those of rosiglitazone and pioglitazone. AtT20 cells were treated with either 1 nM~10 μM MEKT1, rosiglitazone, or pioglitazone for 24 hours. Thereafter, their effects on proopiomelanocortin gene (Pomc) mRNA expression were studied by qPCR and the Pomc promoter (−703/+58) activity was demonstrated by luciferase assay. Pomc mRNA expression and promoter activity were significantly inhibited by MEKT1 at 10 μM compared to rosiglitazone and pioglitazone. SiRNA-mediated PPAR-γ knockdown significantly abrogated MEKT1-mediated Pomc mRNA suppression. ACTH secretion from AtT20 cells was also significantly inhibited by MEKT1. Deletion/point mutant analyses of Pomc promoter indicated that the MEKT1-mediated suppression was mediated via NurRE, TpitRE, and NBRE at −404/−383, −316/−309, and −69/−63, respectively. Moreover, MEKT1 significantly suppressed Nur77, Nurr1, and Tpit mRNA expression. MEKT1 also was demonstrated to inhibit the protein-DNA interaction of Nur77/Nurr1-NurRE, Tpit-TpitRE, and Nur77-NBRE by ChIP assay. Taken together, it is suggested that MEKT1 could be a novel therapeutic medication for Cushing's disease.
1. Introduction
Peroxisome proliferator-activated receptor gamma (PPAR-γ) is a member of the nuclear receptor superfamily also known as ligand-inducible transcription factors [1]. Ligand binding with PPAR-γ receptor acts as a switch leading to the transcription complexes mediating repression or activation of transcription on specific target genes [2]. Moreover, PPAR-γ possesses beneficial pleotropic effects including anti-inflammatory and neuroprotective actions [3, 4] and antidiabetic [5–7], antineoplastic [8], and renoprotective effects [9]. PPAR-γ is expressed in normal human anterior pituitary as well as in adrenocorticotropic hormone- (ACTH-) secreting pituitary adenomas. Moreover, PPAR-γ expression was significantly higher in pituitary adenomas than normal pituitary tissues, and its expression in ACTH-secreting adenomas was significantly higher than any other types of pituitary adenomas [10–13]. ACTH, the product of proopiomelanocortin gene (Pomc), is secreted from the corticotroph cells of the anterior pituitary. Pomc is exhibited in various tissues including pituitary (anterior and intermediate), hypothalamus, and skin [14].
The Pomc regulation is tissue-specific [15] and the regulatory mechanism of this gene has been elucidated in different tissues [16, 17] using different types of drugs. However, the PPAR-γ-mediated Pomc regulation mechanism has not yet been clarified in pituitary corticotroph cells. Moreover, preclinical studies conducted both in vitro and in vivo have provided the evidence of anticancer properties of particular PPAR-γ agonists, rosiglitazone and pioglitazone. Several studies demonstrating rosiglitazone and pioglitazone on Pomc suppression have been done [12, 18, 19], and an opposite effect of rosiglitazone was also shown by Kreutzer et al. [20]. Moreover, although rosiglitazone has been used as a therapeutic drug for the treatment of Cushing's disease due to its ability to reduce ACTH and corticosterone secretion in mouse corticotropic pituitary tumors, it has generally shown unsatisfactory results [21]. In addition, although previous studies have reported the therapeutic use of rosiglitazone and pioglitazone in Cushing's disease [11, 12, 22], there has been some controversy concerning these drugs [20, 23]. Since there have been few effective drugs for Cushing's disease, the discovery of novel drugs is very important to obtain a satisfactory treatment of Cushing's disease.
In this study, we examined the effects of a novel PPAR-γ agonist, MEKT1, on Pomc expression/ACTH secretion using murine pituitary corticotroph tumor-derived AtT20 cells and compared them with rosiglitazone and pioglitazone. We also examined the effects of MEKT1 on transcription factors Nur77, Nurr1, NeuroD1, and Tpit, which are known to activate Pomc transcription [24–26]. Our present study has indicated a possibility that MEKT1 may be a novel candidate for the therapeutic medication against Cushing's disease.
2. Materials and Methods
2.1. Reagents
MEKT1, a synthetic PPAR-γ agonist, was a gift from Okayama University. MEKT1 was dissolved in 100% DMSO at 10 mM and stored at −20°C. Rosiglitazone and pioglitazone hydrochloride were purchased from Sigma-Aldrich (St. Louis, MO) and Wako Pure Chemical Industries Ltd, Japan, respectively. 100% DMSO was used to dissolve rosiglitazone and pioglitazone hydrochloride at 10 mM and stored at −20°C. Before each experiment, these stored drugs were diluted with 100% DMSO to the desired concentration maintaining final concentration of DMSO at 0.1%.
2.2. Plasmids
Subcloned chimeric constructs which contained the rat Pomc genomic DNA and luciferase cDNA (pGL3-Basic, Promega, Madison, WI) were used for the studies of transient transfection: rPomc-Luc (−703/+58-Luc: harboring the rat Pomc 5′-flanking region from −703 to +58 relative to the transcription start site upstream of the luciferase cDNA in pGL3-Basic), −429/+58-Luc, −379/+58-Luc, −359/+58-Luc, −293/+58-Luc, −169/+58-Luc, and +12/+58-Luc. Nur77/Nurr1 binding element in rPomc-Luc from 5′-TGATATTTACCTCC-3′ to 5′-cagcgcccACCTCC-3′ (rPomc-Luc-NurRE-Mut), Nur77 binding element in rPomc-Luc from 5′-AGGTCA-3′ to 5′-gtaTCA-3′ (rPomc-Luc-NBRE-Mut), and Tpit binding element in rPomc-Luc from 5′-TCACACC-3′ to 5′-gacCACC-3′ (rPomc-Luc-TpitRE-Mut). β-galactosidase control plasmid in pRSV (pRSV-β-gal) was purchased from Clontech (Mountain View, CA) and pcDNA3 expression plasmid from Invitrogen (Carsbad, CA). Murine Nur77, Tpit, and Nurr1 cDNA were cloned by PCR from AtT20 cells and were subcloned into the pcDNA3 expression vector (Invitrogen, Carlsbad, CA) to prepare Nur77-pcDNA3, Tpit-pcDNA3, and Nurr1-pcDNA3 [27, 28].
2.3. Cell Culture
AtT20 cells [28], obtained from the American Type Culture Collection (AtT20: CCL-89), were cultured with Dulbecco's modified Eagle medium (DMEM) added with 10% fetal bovine serum (FBS), 100 U/mL penicillin, and 100 μg/mL streptomycin. Cells were cultured in a humidified incubator at 37°C with 5% CO2.
2.4. Proliferation Assay
The following procedure was outlined by Saito-Hakoda et al. [28]. Cell Counting Kit-8 (Dojindo, Kumamoto, Japan) was used for counting the cell numbers. Briefly, AtT20 cells (5 × 10³ cells/well) seeded in 96-well plates were incubated in 100 μl regular media for few days. The cells were then refed with DMEM supplemented with 1% resin and charcoal-treated (stripped) FBS media containing appropriate concentrations of PPAR-γ agonist MEKT1. After 24-hour incubation, 10 μl of assay reagent was added in each well and then the plate was incubated for 4 hours at 37°C, 5% CO2. The generation of the colored formazan product was measured optically by measuring the absorbance at 450 nm (reference 600 nm) using a microplate reader.
2.5. Measurement of Caspase 3 Activity
Caspase 3 activity was determined using a caspase 3/CPR32 Colorimetric Assay kit, according to the manufacturer's instructions (Biovision, Mountain View, CA 94043, USA). Briefly, the AtT20 cells were lysed in caspase 3 sample lysis buffer and incubate cells on ice for 10 minutes. The homogenates were then centrifuged at 10,000 ×g and 4°C for 1 min and the supernatant was collected for protein estimation. The cell lysates were then exposed to the DEVD substrate conjugate provided in the kit for 1 hour at 37°C. The sample was measured in an automatic microplate reader at an excitation of 400 nm.
2.6. RNA Isolation, cDNA Synthesis, and Quantitative Real-Time PCR
RNA isolation, cDNA synthesis, and quantitative real-time polymerase chain reaction (qPCR) were conducted as previously described [28, 29]. To confirm the amplification specificity, the PCR products from each primer pair with SYBR green were subjected to a melting curve analysis. For each sample, the expression of mRNA was normalized by dividing the expression of mouse GAPDH. The sequences of the primer sets are shown in Table 1.
Table 1.
Primer sequences for RT-qPCR.
| Mouse Pomc | Forward | 5′-CAGTGCCAGGACCTCACC-3′ |
| Reverse | 5′-CAGCGAGAGGTCGAGTTTG-3′ | |
| Mouse PPAR-γ1 | Forward | 5′-TTCTGACAGGACTGTGTGACAG-3′ |
| Reverse | 5′-ATAAGGTGGAGATGCAGGTTC-3′ | |
| Mouse PPAR-α | Forward | 5′-AGACACGCAGACGGGTTG-3′ |
| Reverse | 5′-GAGGATGCCACTCCCAGA-3′ | |
| Mouse PPAR-β | Forward | 5′-TGGAGCTCGATGACAGTGAC-3′ |
| Reverse | 5′- GTACTGGCTGTCAGGGTGGT-3′ | |
| Mouse Nur77 | Forward | 5′-GCACAGCTTGGGTGTTGATG-3′ |
| Reverse | 5′-CAGACGTGACAGGCAGCTG-3′ | |
| Mouse Nurr1 | Forward | 5′-TCAGAGCCCACGTCGATT-3′ |
| Reverse | 5′-TAGTCAGGGTTTGCCTGGAA-3′ | |
| Mouse NeuroD1 | Forward | 5′-ACGCAGAAGGCAAGGTGTCC-3′ |
| Reverse | 5′-TTGGTCATGTTTCCACTTCC-3′ | |
| Mouse Tpit | Forward | 5′-GCCAGCATGTGACCTACTCTCACT-3 |
| Reverse | 5′-AGTCCAGCTGTCAGGTCCCGAGAA-3′ | |
| Mouse Pitx1 | Forward | 5′-CGGTGTGGACCAACCTCACTGAA-3′ |
| Reverse | 5′-GAGTTGCACGTGTCCCGGTAGA-3′ | |
| Mouse NFκB1 | Forward | 5′-GAAATTCCTGATCCAGACAAAAAC-3′ |
| Reverse | 5′-ATCACTTCAATGGCCTCTGTGTAG-3′ | |
| Mouse NFκB2 | Forward | 5′-CTGGTGGACACATACAGGAAGAC-3′ |
| Reverse | 5′-ATAGGCACTGTCTTCTTTCACCTC-3′ | |
| Mouse Pttg | Forward | 5′-CTGGGCACTGGTGTCAAG-3′ |
| Forward | 5′-GCTGTTTTGGTTGGAGGGG-3′ | |
| Mouse GAPDH | Forward | 5′-ACAGTCCATGCCATCACTGCC-3′ |
| Reverse | 5′-GCCTGCTTCACCACCTTCTTG-3′ |
2.7. Transient Transfection for Luciferase Assay
AtT20 cells were seeded to 60–70% confluence in regular medium in 24-multiwell plates and the cells were transfected (transiently) with 300 ng of each reporter plasmid and 100 or 150 ng of β-gal control plasmid. Transfection was carried out according to the manufacturer's instructions using Lipofectamine(R) 2000 (Invitrogen). Each expression vector is of different concentrations (200 ng and 300 ng); 135 ng of reporter plasmid and 65 ng of β-gal control plasmid were also transfected with cells in overexpression experiments. Twenty-four hours after transfection, the medium was changed to DMEM added with 1% stripped FBS, and the cells were treated without or with MEKT1 (10 μM) for the next 24 hours. Before luciferase assay, the cells were washed with 1x PBS and then the cell extracts were prepared using Glo Lysis Buffer (Promega) and β-galactosidase activity was also measured simultaneously. Data were normalized by β-galactosidase activity. We followed our previously published protocol [29].
2.8. Small Interfering RNA
Small interfering RNAs (siRNAs) for PPAR-γ (NM_011146_stealth_342) [30] and negative control siRNA (ID: 1022076) were obtained from Qiagen (Hilden, Germany). AtT20 cells were cultured to 50% confluence in 24-multiwell plates transiently transfected with 10 pmol siRNAs using Lipofectamine(R) 2000 (Invitrogen) for 48 hours according to the manufacturer's instructions. The cells were then incubated either without or with 10 μM MEKT1 for 24 hours and then used for quantitative RT-PCR. Reporter plasmids were transfected with the cells and then incubated either without or with MEKT1 at 10 μM for 24 hours and these cells were used for luciferase assay.
2.9. Enzyme Immunoassay (EIA)
EIA was performed for measuring of ACTH concentration. AtT20 cells were cultured to 60% confluence in regular medium in 24-multiwell plates and then incubated either without or with at appropriate concentrations of MEKT1, rosiglitazone, and pioglitazone hydrochloride in DMEM added with 1% stripped FBS for 24 hours. The ACTH concentration in the supernatants was measured by an ACTH (rat. mouse) EIA kit (Phoenix Pharmaceuticals, Burlingame, CA). Data were normalized by the total protein in each well.
2.10. Western Blot Analyses
AtT20 cells were grown to 70% confluence in regular medium in 6 cm dishes, and they were incubated in the presence rosiglitazone, pioglitazone, and MEKT1 (time dependently) or in the presence of 100% DMSO in DMEM supplemented with 1% stripped FBS media for 24 hours. The cells were then harvested and lysed with TNE buffer (20 mmol/L Tris-HCl, 137 mmol/L NaCl, 2 mmol/L EDTA, 1% NP-40, Protease Inhibitor Cocktail Set III (Calbiochem), pH 7.9). Thereafter, 20 μg of extracted protein was electrophoresed on a SDS-polyacrylamide gel and transferred onto PVDF membrane. For the detection of NURR1, Nur77, and TBX19 (Tpit) protein the membrane was blocked with 1% BSA for 30 minutes and probed with the primary antibody for Nur77/Nurr1 antibody (SC-990, Santa Cruz Biotechnology); anti TBX19 antibody (GTX77878, GeneTex); Nur77 (ab13851, Abcam) diluted at 1 : 1000 with 1% BSA, for overnight at 4°C, and was thereafter incubated with anti-rabbit IgG, horseradish peroxidase (HRP) linked whole antibody from donkey (NA934V, GE Healthcare Life Sciences, Pittsburgh, PA) (1 : 5000) for 1 hour at room temperature. For the detection of actin, the membrane was blocked with 1% BSA for 30 minutes at room temperature and probed with the primary antibody for actin (sc-1616, Santa Cruz Biotechnology) (diluted at 1 : 500) for overnight at 4°C and was thereafter incubated with anti-goat IgG, HRP preabsorbed from donkey (ab97120) (1 : 5000) for 1 hour at room temperature. Thereafter, the membranes were washed and were visualized using ECL (Bio-Rad). Densitometric analyses of the membranes were performed using Image J.
2.11. Chromatin Immunoprecipitation (ChIP) Assay
ChIP assay was performed using anti-Nur77/Nurr1 antibody (SC-990, Santa Cruz Biotechnology); anti TBX19 antibody (GTX77878, GeneTex); normal rabbit IgG (SC-2027, Santa Cruz Biotechnology); and NurRE (Nur response element), TpitRE (Tpit response element), and NBRE (Nur77 response element) region containing primers of mouse Pomc promoter. ChIP assay was conducted as described previously [29]. DNA fragments were treated with Proteinase K (Wako, Osaka, Japan) and Qiagen DNA Extraction kit was used for purification of DNA. Immunoprecipitated DNA was analyzed by qPCR when KAPA SYBR FAST Universal 2x qPCR Master Mix (KAPA Biosystems) reagent was used for qPCR. Data were represented as enrichment of the immunoprecipitated DNA compared to 1% input DNA. NurRE, TpitRE, and NBRE region specific primer pairs of mouse Pomc promoter were designed to amplify by qPCR. The sequences of the primer sets are shown in Table 2.
Table 2.
Primer sequences for ChIP-qPCR.
| Mouse NurRE | Forward | 5′-ACACTGGGGAAATCTGATGC-3′ |
| Reverse | 5′-CGGTGGTCAGGAGGAACTTA-3′ | |
| Mouse TpitRE | Forward | 5′-GGCAGATGGACGCACATAGG-3′ |
| Reverse | 5′-GCGCTGGTGGTTAGGAAGAA-3′ | |
| Mouse NBRE | Forward | 5′-TTTCCAGGCAGATGTGCCTTGCGCT-3′ |
| Reverse | 5′-CAGGGTTGGGTGGGTGAGCCTTGGA-3′ |
2.12. Statistical Analyses
Data are displayed as means ± standard errors of means (SEM). Statistical analysis was performed with one way ANOVA followed by Tukey's post hoc test among the groups and Paired Sample t test between the groups. P value < 0.05 was considered as statistically significant. Statistical details are found in the Figures and Figure legends.
3. Results
3.1. Effects of PPAR-γ Agonists Rosiglitazone, Pioglitazone, and MEKT1 on mRNA Expression/Promoter Activity of Pomc
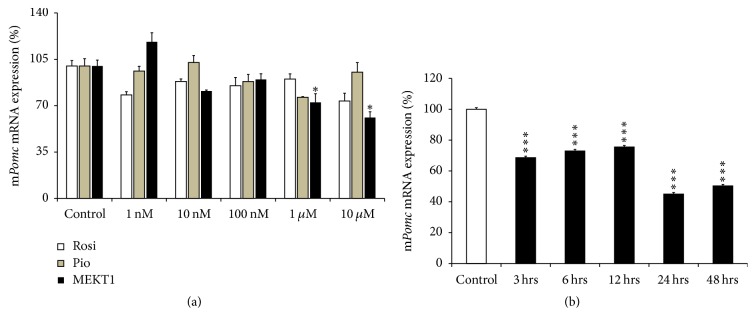
We first analyzed the effects of rosiglitazone, pioglitazone, and MEKT1 on mRNA expression of Pomc at various concentrations in AtT20 cells. After treatment of the cells with various concentrations (1 nM, 10 nM, 100 nM, 1 μM, and 10 μM) of rosiglitazone, pioglitazone, and MEKT1, Pomc mRNA was significantly decreased at 1 μM and 10 μM of MEKT1, but no significant suppressive effects were observed when rosiglitazone and pioglitazone were added (Figure 1(a)). Next we examined the MEKT1-mediated effect on Pomc mRNA expression using different durations of incubation in the cells. After treatment of the cells with MEKT1 (10 μM) for 3 hours, 6 hours, 9 hours, 24 hours, or 48 hours, the Pomc mRNA expression was significantly decreased from 3 hours to 48 hours in a time dependent manner (Figure 1(b)). These results indicated that MEKT1 decreased mRNA expression of Pomc both dose- and time dependently. In contrast, MEKT1 dose-dependently increased PPAR-γ mRNA expression (Figure S1).
Figure 1.
Effects of MEKT1, rosiglitazone, and pioglitazone on mRNA expression of Pomc in AtT20 cells. (a) Effects of MEKT1, rosiglitazone, and pioglitazone on mRNA expression of Pomc dose-dependently. AtT20 cells were treated with MEKT1, rosiglitazone (Rosi), and pioglitazone (Pio) (1 nM, 10 nM, 100 nM, 1 μM, or 10 μM) or 0.1% DMSO (vehicle control) for 24 hours. ∗P < 0.05 versus control. (b) Effect of MEKT1 on Pomc mRNA expression time dependently. AtT20 cells were treated with 10 μM MEKT1 for 1 hour, 3 hours, 6 hours, 12 hours, or 24 hours. Vehicle control, 0.1% DMSO. Data are expressed as percentages (100%) of control. Each point indicates mean ± SEM (n = 4). ∗∗∗P < 0.001 versus control.
We next examined the effects of rosiglitazone, pioglitazone, and MEKT1 on the promoter activity of Pomc using AtT20 cells. In this experiment, the full length (−703/+58) Pomc promoter was used with different concentrations of rosiglitazone, pioglitazone, and MEKT1. As shown in Figure 2, MEKT1 significantly suppressed the promoter activity of Pomc dose-dependently, whereas pioglitazone had no suppressive effect. Though rosiglitazone had a suppressive effect on Pomc promoter activity, the effect was less strong than that of MEKT1. These results indicated that MEKT1-mediated negative regulation of Pomc transcription is most effective than rosiglitazone and pioglitazone.
Figure 2.
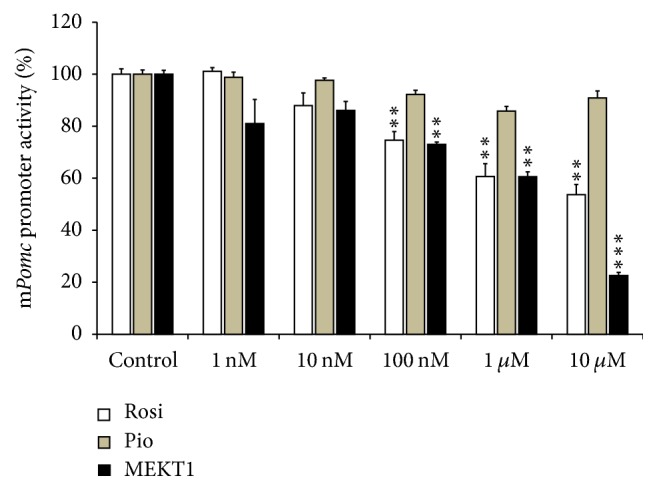
Effects of MEKT1, rosiglitazone, and pioglitazone on Pomc promoter activity in AtT20 cells. AtT20 cells transiently transfected with 300 ng full length rPomc-Luc (−703/+58-luc) and 100 ng pRSV-β-gal were treated with MEKT1, rosiglitazone (Rosi), and pioglitazone (Pio) (1 nM, 10 nM, 100 nM, 1 μM, or 10 μM) or 0.1% DMSO (vehicle control) for 24 hours. Data are expressed as percentages (100%) of control. Each point represents mean ± SEM (n = 4). ∗∗P < 0.01, ∗∗∗P < 0.001 versus control.
3.2. Effects of PPAR-γ Agonists MEKT1, Rosiglitazone, and Pioglitazone on ACTH Secretion
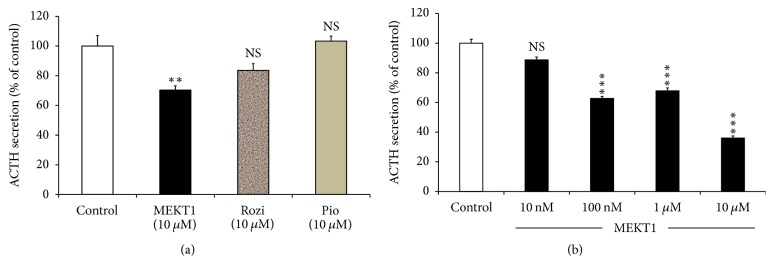
We identified the effects of PPAR-γ agonists MEKT1, rosiglitazone, and pioglitazone at 10 μM on ACTH secretion of AtT20 cells in the supernatant and observed that only MEKT1 significantly suppressed ACTH secretion (Figure 3(a)), whereas there was no significant effect of rosiglitazone and pioglitazone on it. Due to the significant suppression of MEKT1 on ACTH secretion, we then examined the dose-dependent effects of MEKT1 on ACTH secretion. In this experiment, AtT20 cells were treated with different concentrations of MEKT1 (10 nM, 100 nM, 1 μM, and 10 μM) in Figure 3(b). MEKT1 significantly suppressed ACTH secretion from 100 nM to 10 μM.
Figure 3.
Effects of MEKT1, rosiglitazone, and pioglitazone on ACTH secretion from AtT20 cells. (a) Effects of MEKT1, rosiglitazone, and pioglitazone on ACTH secretion into the media from AtT20 cells. AtT20 cells were treated with MEKT1, rosiglitazone (Rosi), and pioglitazone (Pio) (10 μM) or DMSO (0.1%) as a control. After 24-hour incubation of the cells, the ACTH secreted to the media was determined by EIA. (b) Dose-dependent effects of MEKT1 on ACTH secretion into the media from AtT20 cells. AtT20 cells were treated with MEKT1 (10 nM, 100 nM, 1 μM, or 10 μM) or 0.1% DMSO (vehicle control) for 24 hours. After 24-hour incubation of the cells, the ACTH secreted to the media was determined by EIA. Data are expressed as percentages (100%) of control. Each point represents mean ± SEM (n = 4). NS means “not significant.” ∗∗∗P < 0.001, ∗∗P < 0.01 versus control.
3.3. Effects of MEKT1 on AtT20 Cell Proliferation and Apoptosis in AtT20 Cells
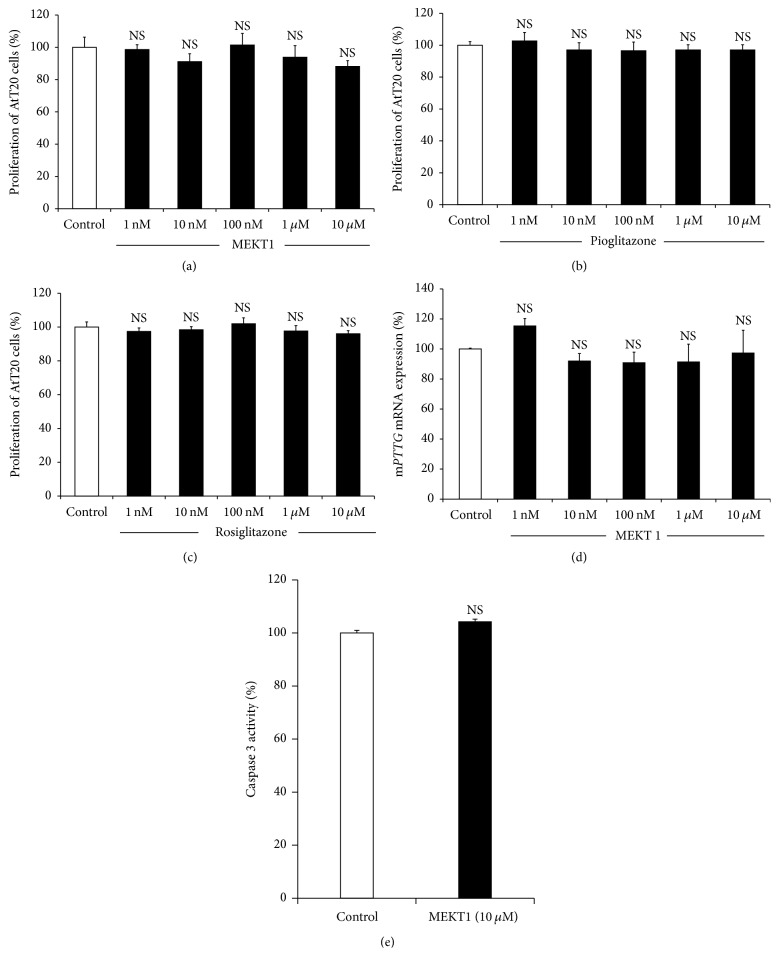
We examined the effects of MEKT1 on proliferation of AtT20 cells using a WST-8 assay after incubation with various concentrations from 1 nM to 10 μM for 96 hours. MEKT1 did not exert any inhibitory effect on the proliferation of AtT20 cells from 1 nM to 10 μM (Figure 4(a)). Although treatment of rosiglitazone and pioglitazone for 24 hours did not exhibit (Figures 4(b) and 4(c)) inhibitory effect on AtT20 cell proliferation, treatment of rosiglitazone for 48 hours inhibited the cell proliferation of corticotroph tumor cells [12]. These data indicated that the MEKT1 had no toxic effect on the AtT20 cells at concentrations of 10 μM. Next we examined the effect of MEKT1 on AtT20 cell apoptosis by caspase-3 assay and observed no apoptotic activity of MEKT1 in Figure 4(e) on AtT20 cells. Moreover, we also demonstrated the effect of MEKT1 on the mRNA expression of the proliferative marker, pituitary tumor transforming gene (Pttg) in Figure 4(d), and observed no effect of MEKT1 on Pttg.
Figure 4.
MEKT1-mediated effect on AtT20 cell proliferation and apoptosis. (a) AtT20 cells were incubated for 96 hours either in the presence of MEKT1 (1 nM, 10 nM, 100 nM, 1 μM, or 10 μM) or DMSO (0.1%) as a control for 24 hours before assay. (b) AtT20 cells were incubated for 96 hours either in the presence of pioglitazone (1 nM, 10 nM, 100 nM, 1 μM, or 10 μM) or DMSO (0.1%) as a control for 24 hours before assay. (c) AtT20 cells were incubated for 96 hours either in the presence of rosiglitazone (1 nM, 10 nM, 100 nM, 1 μM, or 10 μM) or DMSO (0.1%) as a control for 24 hours before assay. Data are expressed as percentages (100%) of control. (d) Effects of MEKT1 on mRNA expression of mPttg dose-dependently. AtT20 cells were treated with MEKT1 (1 nM, 10 nM, 100 nM, 1 μM, or 10 μM) or 0.1% DMSO (vehicle control) for 24 hours. (e) Effects on MEKT1 (10 μM) on AtT20 cell apoptosis. Each point indicates mean ± SEM (n = 4). NS stands for “not significant.”
3.4. The Involvement of PPAR-γ in the MEKT1-Mediated Suppression of mRNA Expression/Promoter Activity of Pomc
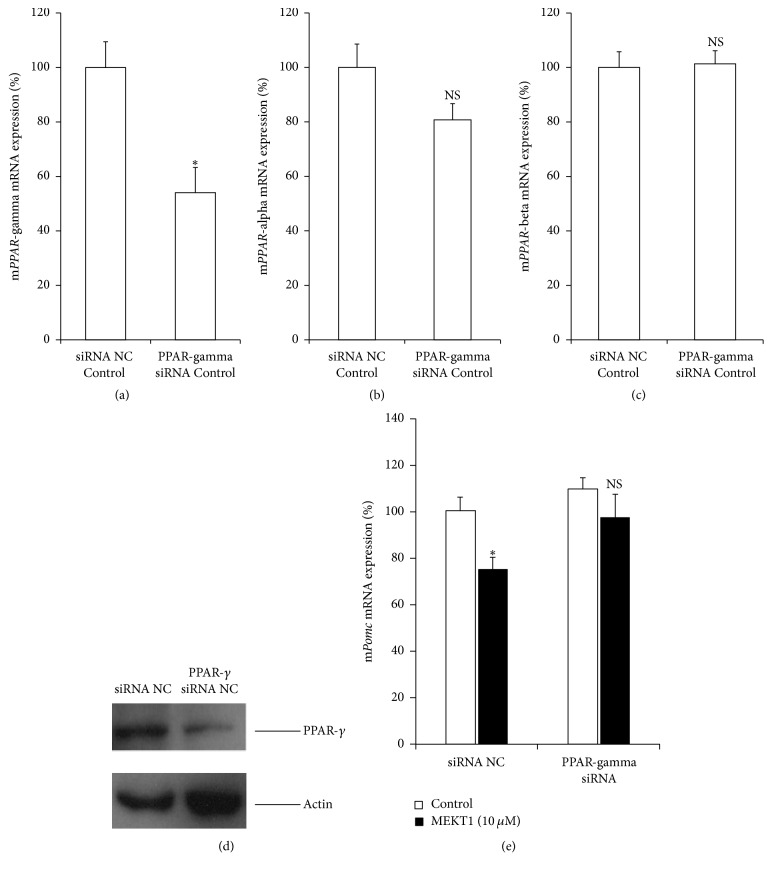
We examined the involvement of PPAR-γ in the MEKT1-mediated suppression of mRNA expression and promoter activity of Pomc by knocking down its small interfering RNA (siRNA). The decrease of endogenous PPAR-γ mRNA expression by its siRNA was confirmed by qPCR, as shown in Figure 5(a). Moreover, endogenous PPAR-α and PPAR-β mRNA expression were not observed in Figures 5(b) and 5(c), respectively. The decrease of PPAR-γ protein expression by its siRNA was confirmed by western blot analysis, as shown in Figure 5(d). PPAR-γ siRNA significantly abrogated the suppression of Pomc mRNA expression by MEKT1 (Figure 5(e)). Moreover, PPAR-γ siRNA significantly abrogated the MEKT1-mediated suppression of Pomc promoter activity (Figure S2). These results indicate that the negative regulation of Pomc expression by MEKT1 is most likely mediated via PPAR-γ.
Figure 5.
Involvement of PPAR-γ in the MEKT1 effects on Pomc mRNA expression. Effects of PPAR-γ knockdown by its siRNA on (a) PPAR-γ mRNA expression, (b) PPAR-α mRNA expression, and (c) PPAR-β mRNA expression. AtT20 cells transiently transfected with siRNA (negative control; NC or PPAR-γ) for 48 hours were incubated with 0.1% DMSO (control) for 24 hours. Results are expressed as percentages of each control. Each point represents mean ± SEM (n = 4). ∗P < 0.05 versus basal negative control siRNA. NS stands for “not significant.” (d) Effects of PPAR-γ knockdown by its siRNA on the PPAR-γ protein expression. (e) Effects of PPAR-γ knockdown by its siRNA on the Pomc mRNA expression. AtT20 cells transiently transfected with siRNA (negative control; NC or PPAR-γ) for 48 hours were incubated in the presence of either MEKT1 (10 μM) or 0.1% DMSO (control) for 24 hours, respectively. Data are expressed as percentages (100%) of control. Each point represents mean ± SEM (n = 4). NS stands for “not significant.” ∗P < 0.05 versus negative control siRNA at 10 μM MEKT1.
3.5. Effects of MEKT1 on the Pomc Promoter Deletion Mutants, and the Involvement of NurRE, TpitRE, and NBRE in the MEKT1-Mediated Suppression of Pomc Promoter Activity
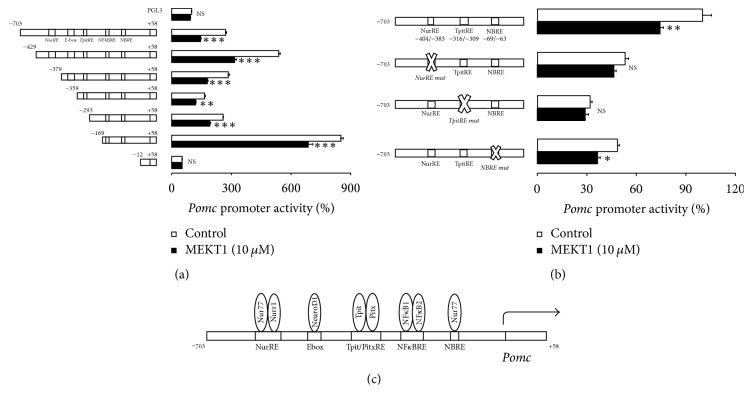
We next examined the molecular mechanisms of Pomc transcription regulation by MEKT1. Therefore, we analyzed the promoter activity of Pomc 5′-flanking region deletion mutants series and it was observed that transcription suppression of Pomc promoter activity by MEKT1 was found in constructs from −703/+58 to −169/+58, but not in −12/+58 (Figure 6(a)). The luciferase activity of pGL3-Basic vector was unaffected by MEKT1 (Figure 6(a)). Pomc promoter constructs from −703/+58 to −169/+58 contained the NurRE, TpitRE, and NBRE, whereas the −12/+58 construct contained no responsive elements of Pomc promoter. It is plausible that NurRE, TpitRE, and NBRE probably exert an influential role in transcription suppression of Pomc, which occurred by MEKT1. To confirm the role of NurRE, TpitRE, and NBRE in the suppression of Pomc transcription, we further demonstrated the impact of MEKT1 on the NurRE, TpitRE, and NBRE mutants (Figure 6(b)). As shown in Figure 6(b), NurRE and TpitRE mutants completely abrogated the MEKT1-mediated repression of Pomc promoter activity, while NBRE mutant partially abrogated the MEKT1-mediated repression of Pomc promoter activity. Therefore, NurRE and TpitRE are important for the transcription suppression of Pomc promoter activity, which was mediated by MEKT1. These data suggest that NurRE and TpitRE play a prominent role in the MEKT1-mediated negative regulation of Pomc transcription. Figure 6(c) represents the structure of the rat Pomc promoter. Since Nur77/Nurr1 [31] is known to bind to NurRE, and Tpit is known to bind to TpitRE [32], Nur77/Nurr1 and Tpit may be involved in the MEKT1-mediated suppression of Pomc promoter activity.
Figure 6.
Effects of MEKT1 on Pomc promoter deletion mutants and role of NurRE, TpitRE, and NBRE on MEKT1-mediated effect on Pomc promoter activity in AtT20 cells. (a) MEKT1-mediated effect on Pomc promoter deletion mutants. AtT20 cells transiently transfected with 300 ng rPomc-Luc (−703/+58-luc) or each deletion mutant reporter plasmid (−429/+58-Luc, −379/+58-Luc, −359/+58-Luc, −293/+58, −169/+58, and +12/+58) and 100 ng pRSV-β-gal were incubated in the presence (10 μM) or absence of MEKT1 for 24 hours before the luciferase assay. Data are expressed as percentages of each control (100% in pGL3-Basic). (b) MEKT1-mediated effect on Pomc promoter activity using NurRE mut, TpitRE mut, and NBRE mut. AtT20 cells transiently transfected with 300 ng rPomc-Luc (−703/+58-luc) or NurRE mut (rPomc-Luc- NurRE -Mut), TpitRE mutant (rPomc-Luc- TpitRE -Mut), NBRE mutant of Pomc promoter (rPomc-Luc- NBRE -Mut) of Pomc full length promoter and 150 ng pRSV-β-gal were incubated in the presence (10 μM) or absence of MEKT1 for 24 hours before the luciferase assay. Data are expressed as percentages of each control (100% in rPomc-Luc). Data represent mean ± SEM (n = 4). NS denotes “not significant.” ∗P < 0.05, ∗∗P < 0.01, and ∗∗∗P < 0.001 versus control. (c) Graphical representation of responsive elements on the promoter of Pomc and transcription factors which bind to the responsive elements of Pomc promoter.
3.6. Effects of MEKT1 on mRNA Expression of Nur77, Nurr1, NeuroD1, Tpit, Pitx, NFkB1, and NFkB2
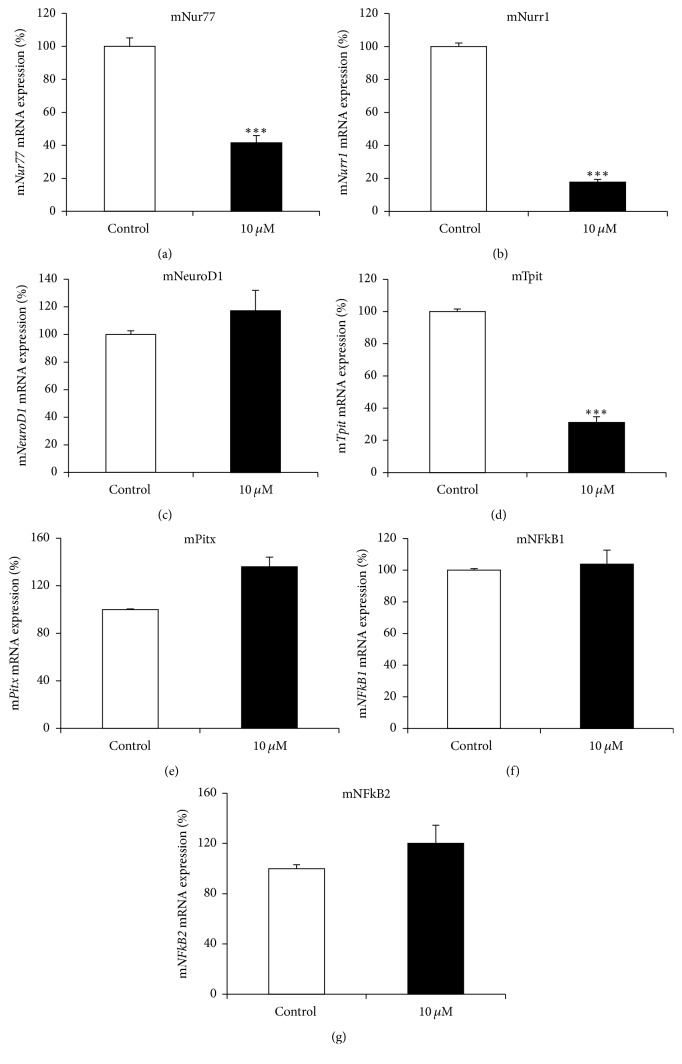
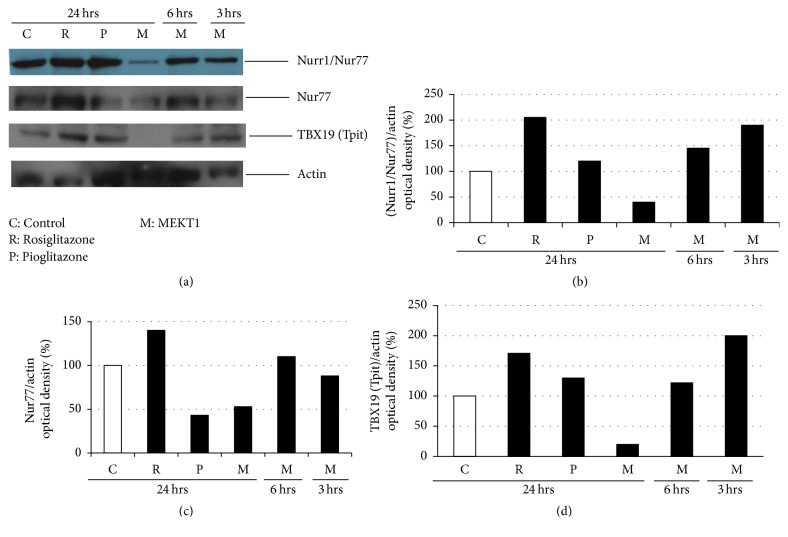
We next examined the effect of MEKT1 on mouse Nur77, Nurr1, NeuroD1, Tpit, Pitx, NFkB1, and NFkB2 mRNA expression in AtT20 cells. As shown in Figures 7(a), 7(b), and 7(d), MEKT1 decreased mRNA expression of Nur77, Nurr1, and Tpit at the concentration of 10 μM but not that of NeuroD1, Pitx, NFkB1, and NFkB2 (Figures 7(c), 7(e), 7(f), and 7(g)). We also demonstrated the effect of MEKT1 on Nurr1, Nur77, and Tpit protein expression (Figure 8) in AtT20 cells. As shown in Figures 7(a), 7(b), and 7(d), results suggest that the MEKT1-mediated suppression of Pomc transcription probably was implicated via the suppression of Nur77, Nurr1, and Tpit mRNA expression which was confirmed by suppression of Nurr1, Nur77, and Tpit protein expression in Figure 8. We next examined the effects of MEKT1 at several concentrations (1 nM, 10 nM, 100 nM, 1 μM, and 10 μM) on mouse Nur77, Nurr1, and Tpit mRNA expression as shown in Figures S3A, S3B, and S3C, and observed its dose-dependent effects.
Figure 7.
MEKT1-mediated effects on the mRNA expression of mouse Nur77, Nurr1, NeuroD1, Tpit, Pitx, NFkB1, and NFkB2 in AtT20 cells. AtT20 cells treated with MEKT1 (10 μM) or 0.1% DMSO (vehicle control) for 24 hours. (a) Nur77 mRNA expression, (b) Nurr1 mRNA expression, (c) NeuroD1 mRNA expression, (d) Tpit mRNA expression, (e) Pitx mRNA expression, (f) NFκB1 mRNA expression, and (g) NFκB2 mRNA expression. Data are expressed as percentages (100%) of control. Data represent mean ± SEM (n = 4). ∗∗∗P < 0.001 versus control.
Figure 8.
Effects of MEKT1 (time dependently), rosiglitazone, and pioglitazone on Nurr1, Nur77, and Tpit protein expression. (a) AtT20 cells treated with MEKT1 (M) at 10 μM for 24 hours, 6 hours, and 3 hours, rosiglitazone (R) at 10 μM for 24 hours, and pioglitazone (P) at 10 μM for 24 hours, or 0.1% DMSO as control (C) for 24 hours. Optical density (OD) of Nurr1/Nur77 was shown in figure (b), Nur77 in figure (c), and TBX19 (Tpit) in figure (d). OD of Nurr1/Nur77, Nur77, and TBX19 (Tpit) were normalized by OD of actin. Results are expressed as percentages of control (100%).
3.7. Effects of Nur77, Tpit, and Nurr1 Overexpression on the MEKT1-Mediated Suppression of mRNA Expression/Promoter Activity of Pomc
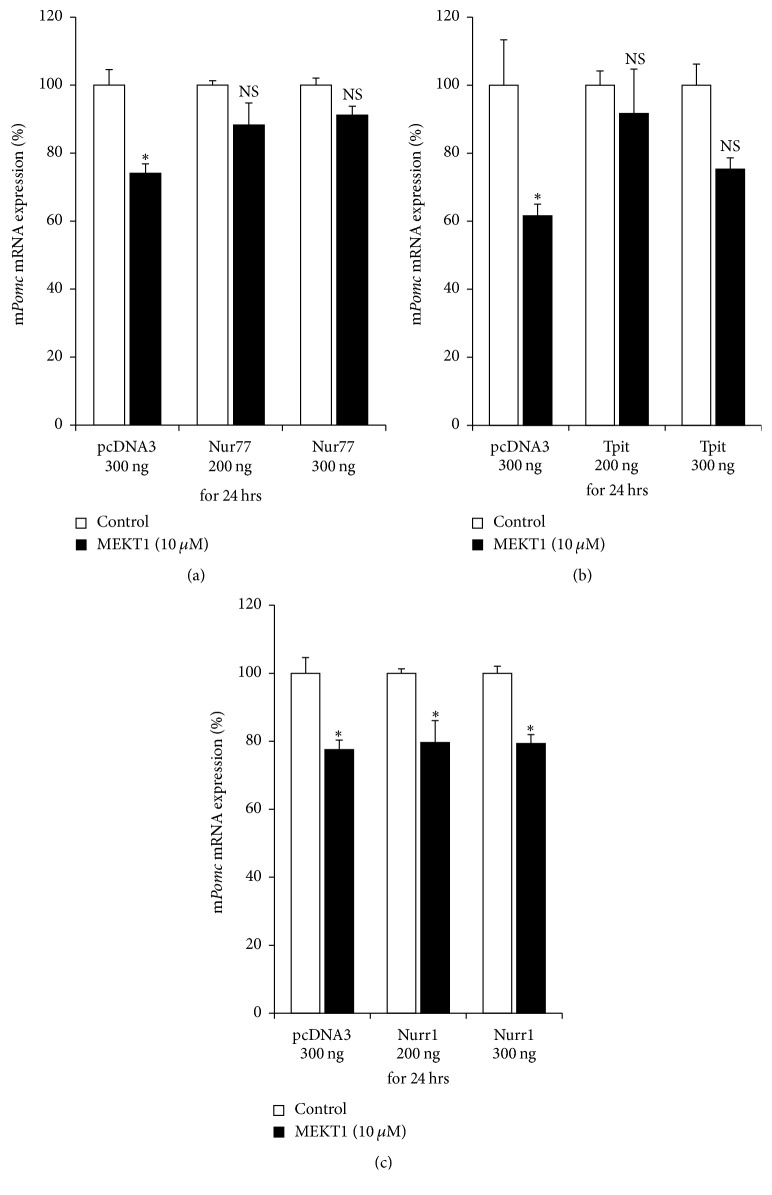
We next performed the overexpression of Nur77, Tpit, and Nurr1 to examine the role of Nur77, Tpit, and Nurr1 in the MEKT1-mediated suppression of mRNA expression and promoter activity of Pomc. As shown in Figures 9(a) and 9(b), overexpression of Nur77 and Tpit recovered the MEKT1-mediated repression of Pomc mRNA expression, when respective control plasmid (pcDNA3) could not recover. As shown in Figures S4A and S4B, overexpression of Nur77 and Tpit recovered the MEKT1-mediated suppression of Pomc promoter activity, while respective control plasmid (pcDNA3) could not. Overexpression of Nurr1 did not recover the MEKT1-mediated suppression of Pomc mRNA expression (Figure 9(c)) and Pomc promoter activity (Figure S4C). These data suggest the involvement of Nur77 and Tpit transcription factor in the MEKT1-mediated suppression of Pomc.
Figure 9.
Effects of Nur77, Tpit, and Nurr1 overexpression on MEKT1-mediated effect of Pomc mRNA expression. (a) Nur77 overexpression effect on the MEKT1-mediated suppression of Pomc mRNA expression in AtT20 cells. AtT20 cells transiently transfected with pcDNA3 and Nur77 overexpression plasmid were incubated either in the presence of MEKT1 at 10 μM or DMSO at 0.1% (control) for 24 hours. (b) Tpit overexpression effect on the MEKT1-mediated suppression of Pomc mRNA expression. AtT20 cells transiently transfected with pcDNA3 and Tpit overexpression plasmid were incubated either in the presence of MEKT1 at 10 μM or DMSO at 0.1% (control) for 24 hours. (c) Nurr1 overexpression on the MEKT1-mediated suppression of Pomc mRNA expression. AtT20 cells transiently transfected with pcDNA3 and Nurr1 overexpression plasmid were incubated either in the presence of MEKT1 at 10 μM or DMSO at 0.1% (control) for 24 hours. Each overexpression plasmid volume was maintained to 300 ng adding pcDNA3 empty vector. Results are expressed as percentages (100%) of control. Data represent mean ± SEM (n = 4). NS stands for “not significant.” ∗P < 0.05, versus control.
3.8. Effects of MEKT1 on the Interaction between Nur77/Nurr1 and NurRE, Tpit and TpitRE, and Nur77 and NBRE on the Pomc Promoter
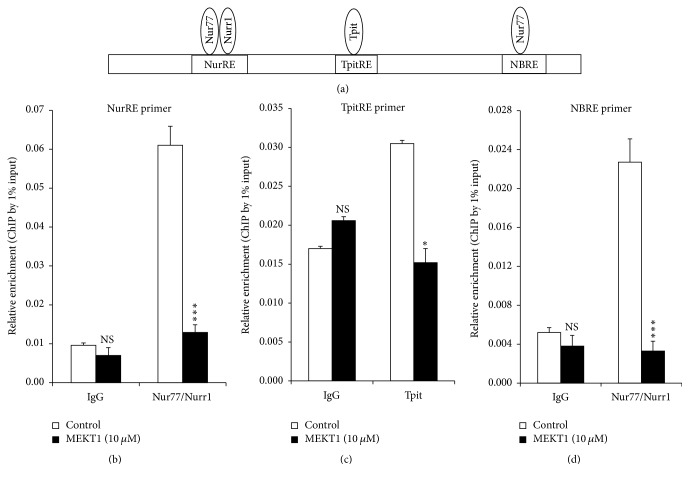
Since Tpit, Nur77/Nurr1, and Nur77 transcription factors are known to bind to NurRE, TpitRE, and NBRE, respectively, on the Pomc promoter [25, 31, 33], we next analyzed the influence of MEKT1 on the interaction between Nur77/Nurr1 and NurRE, Tpit and TpitRE, and Nur77 and NBRE on its promoter of by ChIP assay using primers comprising NurRE, TpitRE, and NBRE (Figure 10(a)). As shown in Figures 10(b)–10(d), MEKT1 significantly suppressed the interaction between Nur77/Nurr1 and NurRE, Tpit and TpitRE, and Nur77 and NBRE on the Pomc promoter (24 hours), while it did not affect their interaction when IgG control was used. These data suggest that MEKT1 specifically inhibited their protein-DNA interactions.
Figure 10.
Effects of MEKT1 on the interaction between Nur77/Nurr1 and NurRE, Tpit and TpitRE, and Nur77 and NBRE on Pomc promoter (a) in AtT20 cells. Effects of MEKT1 on the interaction between Nur77/Nurr1 and NurRE (b), Tpit and TpitRE (c), and Nur77 and NBRE (d) on Pomc promoter examined by ChIP assay using NurRE, TpitRE, and NBRE primer. ChIP assay was carried out using digested chromatin extracted from the cells cultured in the presence of either 10 μM MEKT1 or 0.1% DMSO (control) for 24 hours. Chromatin fragments were immunoprecipitated either by normal rabbit IgG (negative control), anti-Nur77/Nurr1 antibody, or anti-Tpit (anti TBX 19) antibody. Purified DNA was analyzed by qPCR using primers specific for NurRE, TpitRE, and NBRE containing sequence on Pomc promoter. The primer product sizes of NurRE, TpitRE, and NBRE were 211 bp, 146 bp, and 102 bp, respectively. Immunoprecipitated DNA was amplified by qPCR and then normalized to the values obtained after amplification of immunoprecipitated 1% input DNA. Data represent mean ± SEM (n = 3). NS means “not significant.” ∗P < 0.05, and ∗∗∗P < 0.001 significantly different from the level of control group.
4. Discussion
More than a decade ago, PPAR-γ agonist has been discovered as a new therapeutic medication for Cushing's disease [11, 12, 22]. Furthermore, it was reported that the PPAR-γ agonists rosiglitazone and pioglitazone target pituitary tumors in vitro and in vivo in Cushing's disease [11, 12, 22, 34, 35]. In the present study, we found that MEKT1 significantly suppressed the Pomc mRNA expression (Figure 1) and Pomc promoter activity after 24 hours of treatment at 10 μM (Figure 2). In addition, comparing the effects of the three PPAR-γ agonists MEKT1, rosiglitazone, and pioglitazone on ACTH secretion in AtT20 cells (Figure 3), it was clearly shown that MEKT1 more significantly suppressed the Pomc expression and the ACTH secretion than rosiglitazone and pioglitazone. However, Heaney et al. [12] showed that rosiglitazone can suppress Pomc promoter activity significantly after 48 hours. Taken together it was shown that MEKT1 is more effective than rosiglitazone and pioglitazone in suppressing Pomc expression. It was also determined that the potency of MEKT1 was much greater than rosiglitazone in HEK293 cells [36]. We also confirmed using PPAR-γ siRNA that the MEKT1-mediated effect on Pomc expression was mediated via PPAR-γ.
However, the negative regulatory mechanism of the Pomc transcription by PPAR-γ is still unknown. Therefore, we also attempted to elucidate the molecular mechanism of the MEKT1-mediated suppression of Pomc transcription regulation. To clarify the molecular mechanism, we firstly demonstrated the effects of MEKT1 on Pomc promoter deletion mutants of different lengths −703/+58 (full length), −429/+58, −379/+58, −359/+58, −169/+58, and −12/+58, which possess different responsive elements (Figure 6). Moreover, although we also examined the effects of MEKT1 on the promoter activity of Pomc using −62/+12 deletion mutants (data not shown), we did not observe any MEKT1-mediated suppression of Pomc promoter activity, most likely due to the lack of NurRE/TpitRE/NBRE elements. This experiment showed the importance of the responsive elements NurRE, TpitRE, and NBRE in the MEKT1-mediated suppression of Pomc promoter activity. In this study, we first demonstrated the molecular mechanism of the PPAR-γ-mediated negative regulation of Pomc.
Moreover, it is already established that Nur77/Nurr1, NeuroD1, Tpit, Pitx, NFκB1, and NFκB2 are important transcription factors for Pomc expression [25, 26, 33, 37–40]. Therefore, we next examined the effects of MEKT1 on these transcription factors. Although Nur77, Nurr1, and Tpit mRNA expression and Nur77, Nurr1, and Tpit protein expression were significantly suppressed by MEKT1 in AtT20 cells, NeuroD1, Pitx, NFκB1, and NFκB2 mRNA expression were not affected by MEKT1 (Figures 7(a)–7(g), and 8). Therefore, it was predicted that the MEKT1-mediated suppression of Nur77, Nurr1, and Tpit mRNA expression was possibly implicated in the MEKT1-mediated suppression of Pomc transcription and Pomc translation. Since several transcription factor binding sites are present on the Pomc promoter [40], simultaneous interactions among these regulatory elements are needed for Pomc transcription in the pituitary [41]. The proximal binding sequence termed NBRE (−69/−63) is known to be bound by the Nur77 monomer [31, 33] and the distal NurRE, composed of two inverted NBRE related sites (−404/−397 and −390/−383) is recognized to be bound by the Nur77/Nurr1 heterodimer or Nur77 homodimer. Compared to the proximal NBRE, distal NurRE responds to Nur77 in much stronger fashion [31, 33, 40].
In addition, NF-κB RE (−151/−142) [39, 40], Tpit/PitxRE (−316/−309 and −302/−297) [32, 40], and E-box (−377/−370) [29, 38, 40] are known to be involved in regulation of Pomc. Based on these data, we again examined the transcriptional activity of the site directed mutation of NurRE (NurRE mut), TpitRE (TpitRE mut), and NBRE (NBRE mut). NurRE and TpitRE mutants completely abolished the MEKT1-mediated suppressive effect of the Pomc promoter activity. Therefore, it can be assumed that NurRE and TpitRE are the most important responsive elements for the MEKT1-mediated suppression of the Pomc promoter activity. Although NBRE mutant partially abolished the MEKT1-mediated suppressive effect due to the weak interaction of Nur77 monomer and NBRE [31], it is still noteworthy that MEKT1 significantly inhibited the interaction between Nur77 and NBRE on Pomc promoter in the ChIP assay (Figure 10). To verify the importance of transcriptional factors Nur77, Nurr1, and Tpit, we also performed an overexpression experiment and observed that the MEKT1-mediated suppression of Pomc promoter activity was attenuated by the Nur77 and Tpit overexpression (Figure 9).
5. Conclusion
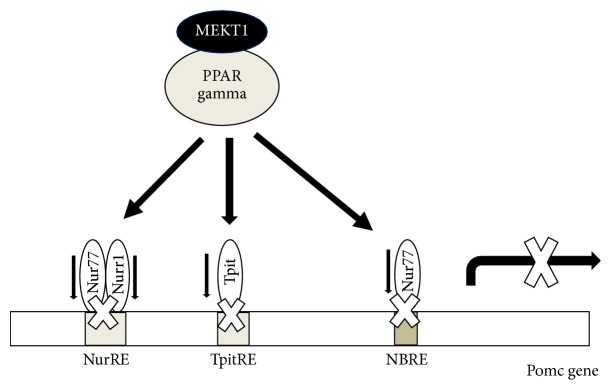
We can conclude as shown in Figure 11 that Nur77/Nurr1 heterodimer binding element NurRE (−383/−404), Tpit responsive element TpitRE (−309/−316), and Nur77 monomer responsive element NBRE (−63/−69) play important roles in Pomc expression [32, 33, 40]. When PPAR-γ agonist MEKT1 is added, it decreases Nur77, Nurr1, and Tpit mRNA expression and then probably inhibits the interactions between Nur77/Nurr1 heterodimer and NurRE, Tpit and TpitRE, and Nur77 monomer and NBRE (Figure 11), resulting the suppression of Pomc expression. Therefore, it can be concluded that Nur77, Nurr1, and Tpit probably play a vital role in the MEKT1-mediated negative regulation of Pomc expression in AtT20 cells. Furthermore, although clinical trials of MEKT1 are needed to determine its drug efficacy in the future, it can be speculated that MEKT1 is much more effective than the previously recognized PPAR-γ agonists, rosiglitazone, and pioglitazone, for the suppression of Pomc expression/ACTH secretion from our in vitro research. Therefore, MEKT1 could be a novel therapeutic medication for the treatment of Cushing's disease.
Figure 11.
Involvement of Nur77, Nurr1, and Tpit transcription factors in the MEKT1 (PPAR-γ agonist)-mediated suppression of Pomc.
Acknowledgments
The authors thank Ms. Ikuko Sato for her technical assistance. This work was supported by Japan Society for the Promotion of Science (JSPS) KAKENHI Grant nos. 16H03252 (for Akira Sugawara), 16K15492 (for Akira Sugawara), and 15K09420 (for Akiko Saito-Hakoda).
Conflicts of Interest
The authors have declared that no conflicts of interest exist.
Authors' Contributions
Conceptualization was done by Rehana Parvin, Hiroyuki Miyachi, and Akira Sugawara. Data analysis was done by Rehana Parvin, Atsushi Yokoyama, and Akiko Saito-Hakoda. Investigation was done by Rehana Parvin, Susumu Suzuki, Hiroki Shimada, Erika Noro, and Kyoko Shimizu. Writing and original draft preparation were by Rehana Parvin. Writing, review, and editing were by Akira Sugawara. Rehana Parvin and Erika Noro contributed equally to this work.
Supplementary Materials
Figure S1: MEKT1-mediated effect of PPAR-γ mRNA expression in AtT20 cells in a dose-dependent manner. AtT20 cells were treated with MEKT1 (1 nM, 10 nM, 100 nM, 1 μM, or 10 μM) or 0.1% DMSO (vehicle control) for 24 hours. Data are expressed as percentages (100%) of control. Data represent mean ± SEM (n = 4). ∗∗P < 0.01 versus control. Figure S2: involvement of PPAR-γ in the MEKT1 effects on Pomc promoter activity. AtT20 cells transiently transfected with rPomc-luc, pRSV-β-gal, and siRNA (negative control; NC or PPAR-γ) for 48 hours were incubated in the presence of either MEKT1 (10 μM) or 0.1% DMSO (control) for 24 hours, respectively. Results are expressed as percentages (100%) of control. Each point represents mean ± SEM (n = 4). NS stands for “not significant.” ∗∗P < 0.01 versus negative control of siRNA at 10 μM MEKT1. Figure S3: MEKT1-mediated effects on the mRNA expression of Nur77, Nurr1, and Tpit in AtT20 cells are dose-dependent. (A) Dose-dependent effect of MEKT1 of Nur77 mRNA expression. AtT20 cells were treated with MEKT1 (1 nM, 10 nM, 100 nM, 1 μM, or 10 μM) or 0.1% DMSO (vehicle control) for 24 hours. (B) Dose-dependent effect of MEKT1 on Nurr1 mRNA expression. AtT20 cells were treated with MEKT1 (1 nM, 10 nM, 100 nM, 1 μM, or 10 μM) or 0.1% DMSO (vehicle control) for 24 hours. (C) Dose-dependent effect of MEKT1 on Tpit mRNA expression. AtT20 cells were treated with MEKT1 (1 nM, 10 nM, 100 nM, 1 μM, or 10 μM) or 0.1% DMSO (vehicle control) for 24 hours. Each point represents mean ± SEM (n = 4). Data are presented as percentages of control (100%). ∗P < 0.05, ∗∗P < 0.01, and ∗∗∗P < 0.001 versus control. Figure S4: effects of Nur77, Tpit, and Nurr1 overexpression on MEKT1-mediated effect of promoter activity of Pomc. AtT20 cells were transiently transfected with pcDNA3 and Nur77 overexpression plasmid in (A), Tpit overexpression plasmid in (B), and Nurr1 overexpression plasmid in (C) and 135 ng of rPomc-Luc and 65 ng of pRSV-β-gal were incubated either in the presence of MEKT1 at 10 μM or DMSO at 0.1% (control) for 24 hours before the luciferase assay. Each overexpression plasmid volume was maintained at 300 ng adding pcDNA3 empty vector. Results are expressed as percentages of each control (100%). Data represent mean ± SEM (n = 4). NS means “not significant.” ∗P < 0.05 versus control.
References
- 1.Tyagi S., Gupta P., Saini A. S., Kaushal C., Sharma S. The peroxisome proliferator-activated receptor: a family of nuclear receptors role in various diseases. Journal of Advanced Pharmaceutical Technology & Research. 2011;2(4):236–240. doi: 10.4103/2231-4040.90879. [DOI] [PMC free article] [PubMed] [Google Scholar]
- 2.Glass C. K., Rosenfeld M. G. The coregulator exchange in transcriptional functions of nuclear receptors. Genes & Development. 2000;14(2):121–141. [PubMed] [Google Scholar]
- 3.Villapol S. Roles of peroxisome proliferator-activated receptor gamma on brain and peripheral inflammation. Cellular and Molecular Neurobiology. 2018;38(1):121–132. doi: 10.1007/s10571-017-0554-5. [DOI] [PMC free article] [PubMed] [Google Scholar]
- 4.Kapadia R., Yi J.-H., Vemuganti R. Mechanisms of anti-inflammatory and neuroprotective actions of PPAR-gamma agonists. Frontiers in Bioscience. 2008;13(5):1813–1826. doi: 10.2741/2802. [DOI] [PMC free article] [PubMed] [Google Scholar]
- 5.Goto A., Tagawa Y., Kimura Y., Kogame A., Moriya Y., Amano N. Influence of the pharmacokinetic profile on the plasma glucose lowering effect of the PPARγ agonist pioglitazone in Wistar fatty rats. Biopharmaceutics & Drug Disposition. 2017;38(6):381–388. doi: 10.1002/bdd.2076. [DOI] [PubMed] [Google Scholar]
- 6.Filipova E., Uzunova K., Kalinov K., Vekov T. Effects of pioglitazone therapy on blood parameters, weight and BMI: a meta-analysis. Diabetology & Metabolic Syndrome. 2017;9(1) doi: 10.1186/s13098-017-0290-5. [DOI] [PMC free article] [PubMed] [Google Scholar]
- 7.Evans R. M., Barish G. D., Wang Y.-X. PPARs and the complex journey to obesity. Nature Medicine. 2004;10(4):355–361. doi: 10.1038/nm1025. [DOI] [PubMed] [Google Scholar]
- 8.Ferrari S. M., Materazzi G., Baldini E., et al. Antineoplastic effects of PPARγ agonists, with a special focus on thyroid cancer. Current Medicinal Chemistry. 2016;23(7):636–649. doi: 10.2174/0929867323666160203114607. [DOI] [PubMed] [Google Scholar]
- 9.Sugawara A., Uruno A., Matsuda K., et al. Effects of PPARγ agonists against vascular and renal dysfunction. Current Molecular Pharmacology. 2012;5(2):248–254. doi: 10.2174/1874467211205020248. [DOI] [PubMed] [Google Scholar]
- 10.Bogazzi F., Russo D., Locci M. T., et al. Peroxisome proliferator-activated receptor (PPAR)γ is highly expressed in normal human pituitary gland. Journal of Endocrinological Investigation. 2005;28(10):899–904. doi: 10.1007/bf03345321. [DOI] [PubMed] [Google Scholar]
- 11.Heaney A. P. Novel pituitary ligands: peroxisome proliferator activating receptor-γ. The Pituitary Society. 2003;6(3):153–159. doi: 10.1023/B:PITU.0000011176.05771.46. [DOI] [PubMed] [Google Scholar]
- 12.Heaney A. P., Fernando M., Yong W. H., Melmed S. Functional PPAR-γ receptor is a novel therapeutic target for ACTH-secreting pituitary adenomas. Nature Medicine. 2002;8(11):1281–1287. doi: 10.1038/nm784. [DOI] [PubMed] [Google Scholar]
- 13.Ma Y., Xia X. W., Su C. B., Kong Y. G. Distribution and expression of peroxisome proliferator activated receptor gamma in human pituitary adenomas. Zhongguo Yi Xue Ke Xue Yuan Xue Bao. 2006;28:375–377. [PubMed] [Google Scholar]
- 14.Bicknell A. B. The tissue-specific processing of pro-opiomelanocortin. Journal of Neuroendocrinology. 2008;20(6):692–699. doi: 10.1111/j.1365-2826.2008.01709.x. [DOI] [PubMed] [Google Scholar]
- 15.Jeannotte L., Trifiro M. A., Plante R. K., Chamberland M., Drouin J. Tissue-specific activity of the pro-opiomelanocortin gene promoter. Molecular and Cellular Biology. 1987;7(11):4058–4064. doi: 10.1128/MCB.7.11.4058. [DOI] [PMC free article] [PubMed] [Google Scholar]
- 16.Eberwine J. H., Roberts J. L. Glucocorticoid regulation of pro-opiomelanocortin gene transcription in the rat pituitary. The Journal of Biological Chemistry. 1984;259(4):2166–2170. [PubMed] [Google Scholar]
- 17.Drouin J., Trifiro M. A., Plante R. K., Nemer M., Eriksson P., Wrange O. Glucocorticoid receptor binding to a specific DNA sequence is required for hormone-dependent repression of pro-opiomelanocortin gene transcription. Molecular and Cellular Biology. 1989;9(12):5305–5314. doi: 10.1128/MCB.9.12.5305. [DOI] [PMC free article] [PubMed] [Google Scholar]
- 18.Giraldi F. P., Scaroni C., Arvat E., et al. Effect of protracted treatment with rosiglitazone, a PPARγ agonist, in patients with Cushing's disease. Clinical Endocrinology. 2006;64(2):219–224. doi: 10.1111/j.1365-2265.2006.02452.x. [DOI] [PubMed] [Google Scholar]
- 19.Winczyk K., Kunert-Radek J., Gruszka A., Radek M., Lawnicka H., et al. Effects of rosiglitazone--peroxisome proliferators-activated receptor gamma (PPARgamma) agonist on cell viability of human pituitary adenomas in vitro. Neuro Endocrinology Letters. 2009;30:107–110. [PubMed] [Google Scholar]
- 20.Kreutzer J., Jeske I., Hofmann B., Blumcke I., Fahlbusch R. No effect of the PPAR-gamma agonist rosiglitazone on ACTH or cortisol secretion in Nelson's syndrome and Cushing's disease in vitro and in vivo. Clinical Neuropathology. 2009;28:430–439. [PubMed] [Google Scholar]
- 21.Mannelli M., Cantini G., Poli G., et al. Role of the PPAR-γ System in Normal and Tumoral Pituitary Corticotropic Cells and Adrenal Cells. Neuroendocrinology. 2010;92(1):23–27. doi: 10.1159/000314312. [DOI] [PubMed] [Google Scholar]
- 22.Heaney A. P. PPAR-gamma in Cushing's disease. Pituitary. 2004;7:265–269. doi: 10.1007/s11102-005-1430-8. [DOI] [PubMed] [Google Scholar]
- 23.Suri D., Weiss R. E. Effect of pioglitazone on adrenocorticotropic hormone and cortisol secretion in Cushing's disease. The Journal of Clinical Endocrinology & Metabolism. 2005;90(3):1340–1346. doi: 10.1210/jc.2004-1746. [DOI] [PubMed] [Google Scholar]
- 24.Bilodeau S., Vallette-Kasic S., Gauthier Y., et al. Role of Brg1 and HDAC2 in GR trans-repression of the pituitary POMC gene and misexpression in Cushing disease. Genes & Development. 2006;20(20):2871–2886. doi: 10.1101/gad.1444606. [DOI] [PMC free article] [PubMed] [Google Scholar]
- 25.Lamolet B., Pulichino A.-M., Lamonerie T., et al. A pituitary cell-restricted T box factor, Tpit, activates POMC transcription in cooperation with Pitx homeoproteins. Cell. 2001;104(6):849–859. doi: 10.1016/S0092-8674(01)00282-3. [DOI] [PubMed] [Google Scholar]
- 26.Poulin G., Turgeon B., Drouin J. NeuroD1/β2 contributes to cell-specific transcription of the proopiomelanocortin gene. Molecular and Cellular Biology. 1997;17(11):6673–6682. doi: 10.1128/MCB.17.11.6673. [DOI] [PMC free article] [PubMed] [Google Scholar]
- 27.Uruno A., Saito-Hakoda A., Yokoyama A., et al. Retinoic acid receptor-α up-regulates proopiomelanocortin gene expression in AtT20 corticotroph cells. Endocrine Journal. 2014;61(11):1105–1114. doi: 10.1507/endocrj.EJ14-0115. [DOI] [PubMed] [Google Scholar]
- 28.Saito-Hakoda A., Uruno A., Yokoyama A., et al. Effects of RXR agonists on cell proliferation/apoptosis and ACTH Secretion/Pomc expression. PLoS ONE. 2015;10(12) doi: 10.1371/journal.pone.0141960.0141960 [DOI] [PMC free article] [PubMed] [Google Scholar]
- 29.Parvin R., Saito-Hakoda A., Shimada H., et al. Role of NeuroD1 on the negative regulation of Pomc expression by glucocorticoid. PLoS ONE. 2017;12(4) doi: 10.1371/journal.pone.0175435.e0175435 [DOI] [PMC free article] [PubMed] [Google Scholar]
- 30.Yamashita A., Takada T., Nemoto K.-I., Yamamoto G., Torii R. Transient suppression of PPARγ directed ES cells into an osteoblastic lineage. FEBS Letters. 2006;580(17):4121–4125. doi: 10.1016/j.febslet.2006.06.057. [DOI] [PubMed] [Google Scholar]
- 31.Philips A., Lesage S., Gingras R., et al. Novel dimeric Nur77 signaling mechanism in endocrine and lymphoid cells. Molecular and Cellular Biology. 1997;17(10):5946–5951. doi: 10.1128/MCB.17.10.5946. [DOI] [PMC free article] [PubMed] [Google Scholar]
- 32.Murakami I., Takeuchi S., Kudo T., Sutou S., Takahashi S. Corticotropin-releasing hormone or dexamethasone regulates rat proopiomelanocortin transcription through Tpit/Pitx-responsive element in its promoter. Journal of Endocrinology. 2007;193(2):279–290. doi: 10.1677/JOE-06-0143. [DOI] [PubMed] [Google Scholar]
- 33.Maira M., Martens C., Philips A., Drouin J. Heterodimerization between members of the Nur subfamily of orphan nuclear receptors as a novel mechanism for gene activation. Molecular and Cellular Biology. 1999;19(11):7549–7557. doi: 10.1128/MCB.19.11.7549. [DOI] [PMC free article] [PubMed] [Google Scholar]
- 34.Fleseriu M., Petersenn S. Medical management of Cushing's disease: What is the future? The Pituitary Society. 2012;15(3):330–341. doi: 10.1007/s11102-012-0397-5. [DOI] [PMC free article] [PubMed] [Google Scholar]
- 35.Ambrosi B., Dall'Asta C., Cannavo S., et al. Effects of chronic administration of PPAR-gamma ligand rosiglitazone in Cushing's disease. European Journal of Endocrinology. 2004;151(2):173–178. doi: 10.1530/eje.0.1510173. [DOI] [PubMed] [Google Scholar]
- 36.Ohashi M., Oyama T., Nakagome I., et al. Design, synthesis, and structural analysis of phenylpropanoic acid-type PPARγ-selective agonists: Discovery of reversed stereochemistry-activity relationship. Journal of Medicinal Chemistry. 2011;54(1):331–341. doi: 10.1021/jm101233f. [DOI] [PubMed] [Google Scholar]
- 37.Wilson T. E., Fahrner T. J., Johnston M., Milbrandt J. Identification of the DNA binding site for NGFI-B by genetic selection in yeast. Science. 1991;252(5010):1296–1300. doi: 10.1126/science.1925541. [DOI] [PubMed] [Google Scholar]
- 38.Therrien M., Drouin J. Cell-specific helix-loop-helix factor required for pituitary expression of the pro-opiomelanocortin gene. Molecular and Cellular Biology. 1993;13(4):2342–2353. doi: 10.1128/MCB.13.4.2342. [DOI] [PMC free article] [PubMed] [Google Scholar]
- 39.Karalis K. P., Venihaki M., Zhao J., Van Vlerken L. E., Chandras C. NF-κB participates in the corticotropin-releasing, hormone-induced regulation of the pituitary proopiomelanocortin gene. The Journal of Biological Chemistry. 2004;279(12):10837–10840. doi: 10.1074/jbc.M313063200. [DOI] [PubMed] [Google Scholar]
- 40.Jenks B. G. Regulation of proopiomelanocortin gene expression: an overview of the signaling cascades, transcription factors, and responsive elements involved. Annals of the New York Academy of Sciences. 2009;1163:17–30. doi: 10.1111/j.1749-6632.2008.03620.x. [DOI] [PubMed] [Google Scholar]
- 41.Therrien M., Drouin J. Pituitary pro-opiomelanocortin gene expression requires synergistic interactions of several regulatory elements. Molecular and Cellular Biology. 1991;11(7):3492–3503. doi: 10.1128/MCB.11.7.3492. [DOI] [PMC free article] [PubMed] [Google Scholar]
Associated Data
This section collects any data citations, data availability statements, or supplementary materials included in this article.
Supplementary Materials
Figure S1: MEKT1-mediated effect of PPAR-γ mRNA expression in AtT20 cells in a dose-dependent manner. AtT20 cells were treated with MEKT1 (1 nM, 10 nM, 100 nM, 1 μM, or 10 μM) or 0.1% DMSO (vehicle control) for 24 hours. Data are expressed as percentages (100%) of control. Data represent mean ± SEM (n = 4). ∗∗P < 0.01 versus control. Figure S2: involvement of PPAR-γ in the MEKT1 effects on Pomc promoter activity. AtT20 cells transiently transfected with rPomc-luc, pRSV-β-gal, and siRNA (negative control; NC or PPAR-γ) for 48 hours were incubated in the presence of either MEKT1 (10 μM) or 0.1% DMSO (control) for 24 hours, respectively. Results are expressed as percentages (100%) of control. Each point represents mean ± SEM (n = 4). NS stands for “not significant.” ∗∗P < 0.01 versus negative control of siRNA at 10 μM MEKT1. Figure S3: MEKT1-mediated effects on the mRNA expression of Nur77, Nurr1, and Tpit in AtT20 cells are dose-dependent. (A) Dose-dependent effect of MEKT1 of Nur77 mRNA expression. AtT20 cells were treated with MEKT1 (1 nM, 10 nM, 100 nM, 1 μM, or 10 μM) or 0.1% DMSO (vehicle control) for 24 hours. (B) Dose-dependent effect of MEKT1 on Nurr1 mRNA expression. AtT20 cells were treated with MEKT1 (1 nM, 10 nM, 100 nM, 1 μM, or 10 μM) or 0.1% DMSO (vehicle control) for 24 hours. (C) Dose-dependent effect of MEKT1 on Tpit mRNA expression. AtT20 cells were treated with MEKT1 (1 nM, 10 nM, 100 nM, 1 μM, or 10 μM) or 0.1% DMSO (vehicle control) for 24 hours. Each point represents mean ± SEM (n = 4). Data are presented as percentages of control (100%). ∗P < 0.05, ∗∗P < 0.01, and ∗∗∗P < 0.001 versus control. Figure S4: effects of Nur77, Tpit, and Nurr1 overexpression on MEKT1-mediated effect of promoter activity of Pomc. AtT20 cells were transiently transfected with pcDNA3 and Nur77 overexpression plasmid in (A), Tpit overexpression plasmid in (B), and Nurr1 overexpression plasmid in (C) and 135 ng of rPomc-Luc and 65 ng of pRSV-β-gal were incubated either in the presence of MEKT1 at 10 μM or DMSO at 0.1% (control) for 24 hours before the luciferase assay. Each overexpression plasmid volume was maintained at 300 ng adding pcDNA3 empty vector. Results are expressed as percentages of each control (100%). Data represent mean ± SEM (n = 4). NS means “not significant.” ∗P < 0.05 versus control.


