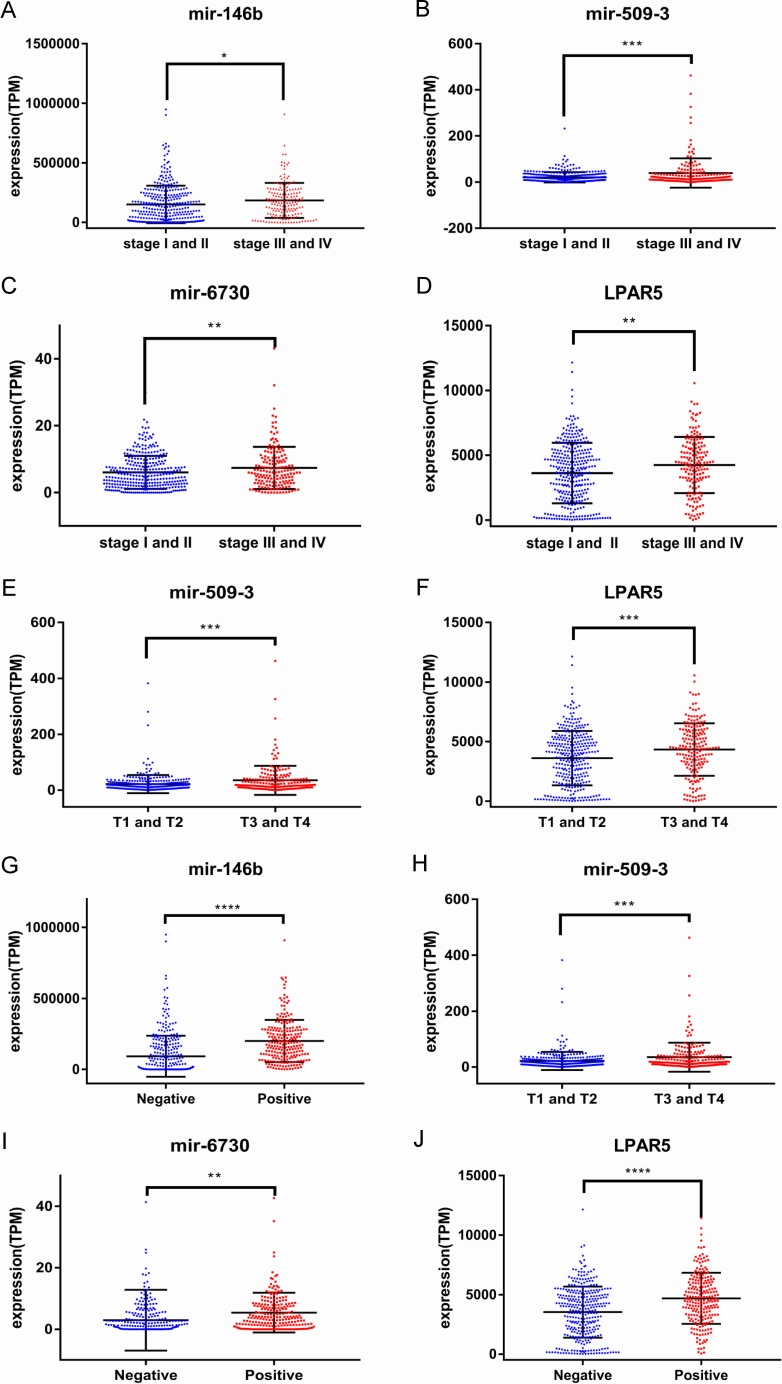
Figure 4. Correlations between the expression levels of prognostic genes and tumor pathology.
(A) miR-146b and tumor stage; (B) miR-509-3 and tumor stage; (C) miR-6730 and tumor stage; (D) LPAR5 and tumor stage; (E) miR-509-3 and tumor size; (F) LPAR5 and tumor size; (G) miR-146b and lymph nodes metastases; (H) miR-509-3 and lymph nodes metastases; (I) miR-6730 and lymph nodes metastases; (J) LPAR5 and lymph nodes metastases.

