

Summary
The entorhinal cortex (EC) is among the earliest brain areas to deteriorate in Alzheimer’s disease (AD). However, the extent to which functional properties of the EC are altered in the aging brain, even in the absence of clinical symptoms, is not understood. Recent human fMRI studies have identified a functional dissociation within the EC, similar to what is found in rodents. Here, we used high-resolution fMRI to identify a specific hypoactivity in the anterolateral EC (alEC) commensurate with major behavioral deficits on an object pattern separation task in asymptomatic older adults. Only subtle deficits were found in a comparable spatial condition, with no associated differences in posteromedial EC between young and older adults. We additionally linked this condition to dentate/CA3 hyperactivity, and the ratio of activity between the regions was associated with object mnemonic discrimination impairment. These results provide novel evidence of alEC-dentate/CA3 circuit dysfunction in cognitively normal aged humans.
Keywords: Memory, Aging, Dentate Gyrus, CA3, Entorhinal, alEC, LEC, Pattern Separation, fMRI
eTOC Blurb
Reagh et al. identify a novel mechanistic pathway for the decline in pattern separation of object stimuli observed with aging – a network dysregulation characterized by hypoactivity in the anterolateral entorhinal cortex and hyperactivity in the dentate and CA3 subregions of the hippocampus. This novel biomarker yields a potential tool for assessing the neural basis of age-related memory decline.
Introduction
In the coming years, a major issue facing neuroscientists is the characterization of changes to the brain that occur as we age. Moreover, it will be important to distinguish simple age-related changes from those that indicate a disease state. The entorhinal cortex (EC) is among the first and most profoundly affected regions in age-related pathologies, such as Alzheimer’s disease (AD) (Braak, Braak, and Bohl, 1993; Braak and Braak, 1995; Hirni et al., 2016; Jack et al., 1997). In particular, the EC, undergoes structural and functional alterations relating to AD (Burke et al., 2011, 2014; Ryan et al., 2012; Stranahan and Mattson, 2010), even in older preclinical humans (Khan et al., 2014).
The EC is a key region of the brain’s medial temporal lobes (MTL), and mediates much of the communication between the hippocampus and the rest of the neocortex. Input from the EC to the dentate gyrus (DG) hippocampus is thought to play a role in pattern separation, a process that involves storage of similar experiences using nonoverlapping memory traces (Yassa and Stark, 2011), and which is disrupted in the aging brain (Burke et al., 2011; Yassa et al., 2010a, 2010b, 2011; Stark et al., 2014). Electrophysiological (Knierim, Neunuebel, and Deshmukh, 2014; Keene et al., 2016) and lesion (Hunsaker et al., 2013) studies in rodents have shown a functional dissociation between the lateral and medial EC, with the former comprising a “content” pathway representing local sensory cues required for object processing, and the latter comprising a “context” pathway representing configurational aspects of experience such as space (Eichenbaum et al., 2012; Knierim and Neunuebel, 2016; Knierim, Neunuebel, and Deshmukh, 2014). This dissociation has been corroborated in human fMRI studies with task-free time series correlations (Maass et al., 2015; Navarro Schröder et al., 2015) and task-driven engagement (Schultz, Sommer, and Peters, 2012; Reagh and Yassa, 2014). Importantly, recent evidence suggests that the human EC seems to more closely follow an anterolateral versus posteromedial functional division (alEC; pmEC) (Maass et al., 2015; Navarro Schröder et al., 2015), which is consistent with anatomical properties of the nonhuman primate (Suzuki and Amara, 1994).
As studies in rodents suggest that the pathway between perirhinal cortex (PRC) and alEC is more vulnerable to age-related dysfunction (Burke et al., 2011, 2014; Ryan et al., 2012; Stranahan and Mattson, 2010), the hypothesis arises that alEC should be more affected than pmEC in the human brain as memory declines with aging. This is in line with findings by Khan and colleagues (Khan et al., 2010), who reported metabolic dysfunction in the lateral portion of the EC of preclinical AD patients. More recently, human alEC volume has been found to relate both to cognitive processing of complex objects (Yeung et al., 2017) and cognitive decline prior to a clinical diagnosis of amnestic mild cognitive impairment (aMCI, often considered a prodromal phase towards AD) (Olsen et al., 2017). Finally, in a prior study, we found that older adults were globally impaired at mnemonic discrimination (alikely behavioral readout of pattern separation) of objects compared to young adults, with only very minor differences in spatial discrimination (Reagh et al., 2016). This is consistent with unique dysfunction of alEC and/or PRC. Interestingly, the transitional region of the lateral portion of EC and the medial portion of PRC comprise the “transentorhinal region” discussed by Braak and colleagues (Braak, Braak, and Bohl, 1993; Braak and Braak, 1995). The phenomenon of age-related object discrimination deficits has also been closely paralleled by recent studies in rats (Johnson et al., 2017; Maurer et al., 2017). However, key questions remain unresolved. What is the neural basis of object discrimination deficits in older adults? Can alEC dysfunction explain behavioral performance? Given a link between DG/CA3 hyperactivity and object discrimination deficits in prior work (Yassa et al., 2010a, 2010b, 2011), is this mechanistically linked to alEC dysfunction? Finally, is alEC dysfunction a specific marker of neurodegenerative disease, or is it a broader feature of the aging brain?
Here, we addressed these gaps in knowledge by adapting the aforementioned object versus spatial mnemonic discrimination paradigm for use in a high-resolution fMRI experiment. We found two phenomena in the fMRI signal that were associated with object discrimination deficits. The first was hypoactivity of alEC as we hypothesized, and the second was a replication of the previously reported DG/CA3 hyperactivity in older adults (Yassa et al., 2010a, 2010b, 2011). Moreover, we find evidence for a shift in the correlational structure between alEC and DG/CA3 activity in aging and suggest that the imbalance across these two regions may partially explain age-related memory deficits.
Results
Object discrimination is impaired in older adults
The task is depicted in Figure 1, and a full description can be seen in the Methods. Briefly, in initial study phases, participants first studied a series of objects appearing in one of 31 on-screen locations and made an incidental “Indoors or Outdoors?” judgment. They then completed a subsequent test phase for each unique set of objects. Half of the test phases featured exactly repeated objects (object targets) or similar lure objects (object lures) (Fig. 1a), and the other half featured exactly repeated locations (spatial targets) or similar lure locations (spatial lures) (Fig. 1b). Lures of each domain were further divided into high, mid, and low similarity bins. Test judgments for both domains were simply “Same or Different?” with respect to the objects or their locations. Three runs of each type of test were completed. All participants underwent an extensive neuropsychological battery, and all participants included in our analyses were within the norms of their age range (Table 1). Though older adults were outperformed by young participants on several tests, these differences are not uncommon, and no differences were observed on broad neuropsychological assays (e.g., the Montreal Cognitive Assessment).
Figure 1. Task schematic and behavioral performance.
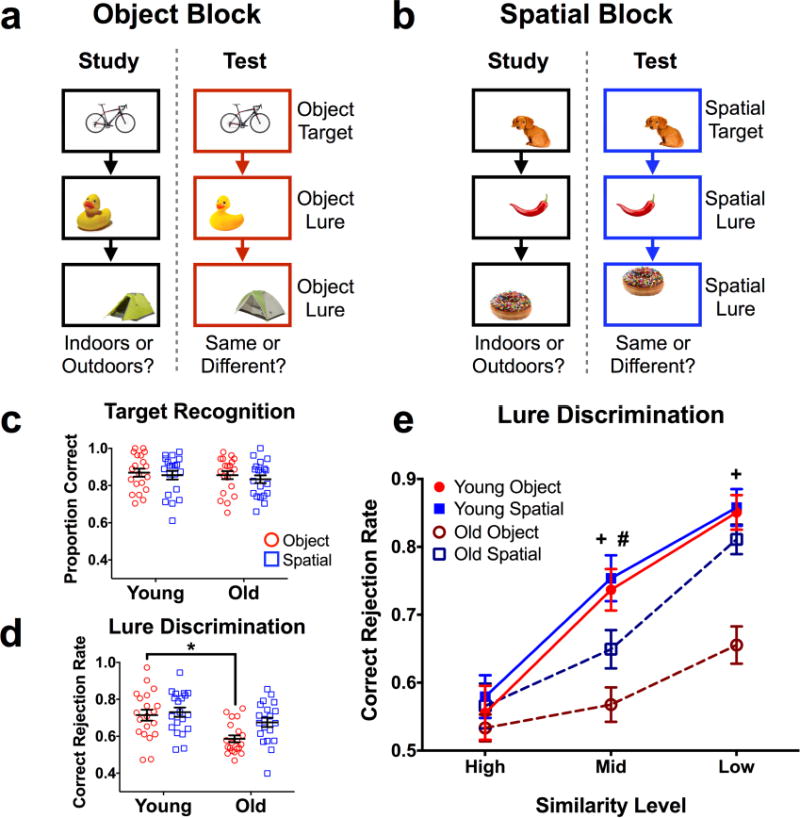
A) Illustrative diagram of an object block (3 blocks completed). B) Illustrative diagram of a spatial block (3 blocks completed). Objects were smaller relative to screen size in the actual task, and presentation order was randomized across runs (i.e., study and test orders were different) and across participants. Stimuli were presented for 3 seconds, with a 1 second inter-stimulus interval. C) Target hit rates across test domains. No differences were observed. D) Lure discrimination rates across test domains. Older subjects were significantly impaired at object, but not spatial discrimination overall. E) Lure discrimination across the five similarity bins. Whereas older subjects were relatively impaired at discrimination of mid-similarity spatial lures, they were more globally impaired at object discrimination. Data are shown as mean ± standard error, with each point representing a single subject in panels c and d. (* = Young > Old in panel d; + = Young > Old for object lures in panel E; # = Young > Old for spatial lures in panel E; all post hoc tests are reported as p < 0.05 corrected for multiple comparisons.)
Table 1.
Demographics and Neuropsychological Tests.
| Measure | Young | Old | Difference (t-test) |
|---|---|---|---|
| Sample Size | 20 (15F) | 20 (13F) | – |
| Age | 21.75 (4.08) | 73.6 (6.2) | – |
| Montreal Cognitive Assessment | 26.71 (2.59) | 26.14 (2.97) | p = 0.543 |
| Benson – Immediate | 17 (0) | 16.75 (0.55) | p = 0.062 |
| Benson – Delayed | 15.33 (2.5) | 11.2 (2.93) | p < 0.001 |
| Benson – Recognition | 1.89 (3.77) | 0.85 (0.37) | p = 0.228 |
| Number Span Forward | 8.94 (2.41) | 8.14 (2.26 | p = 0.292 |
| Number Span Backward | 6.72 (1.49) | 7.14 (2.32) | p = 0.514 |
| Category Fluency – Animal | 23.72 (5.76) | 22.43 (4.63) | p = 0.442 |
| Category Fluency – Vegetable | 13.11 (4.34) | 14.86 (5.09) | p = 0.261 |
| Trails A | 17.94 (5.46) | 30.35 (8.52) | p < 0.001 |
| Trails B | 45.39 (9.3) | 78.95 (32.34) | p < 0.001 |
| MINT – Correct Uncued | 27 (4.2) | 30.19 (1.89) | p = 0.003 |
| MINT – Correct Semantic Cue | 0.72 (0.96) | 0.29 (0.56) | p = 0.086 |
| MINT – Total Correct | 17.21 (14.11) | 22.07 (13.94) | p = 0.256 |
| Verbal Fluency – “F” Words | 15 (4.04) | 16.22 (6.16) | p = 0.562 |
| Verbal Fluency – “L” Words | 14.72 (6.01) | 15 (5.99) | p = 0.83 |
| NAART35 | 16.56 (7.37) | 23.73 (8.3) | p = 0.002 |
| RAVLT – Immediate | 13.72 (1.49) | 10.68 (3.01) | p < 0.001 |
| RAVLT – Delayed | 13.06 (3.6) | 9.73 (3.28) | p = 0.001 |
| RAVLT – Recognition | 13.39 (3.6) | 13.64 (1.84) | p = 0.719 |
| WAIS – Vocabulary | 35.22 (9.13) | 39.52 (9.02) | p = 0.148 |
| Beck Depression Inventory | 7.89 (6.44) | 5.8 (4.66) | p = 0.303 |
| Average Hours Slept (Self-Report) | 7.04 (6.44) | 6.88 (1.43) | p = 0.744 |
| Stress Inventory Score | 7.04 (1.35) | 2.8 (1.74) | p = 0.021 |
Data are presented as mean (SD). MINT = Multilingual Naming Test, NAART = North American Adult Reading Test, RAVLT = Rey Auditory Verbal Learning Test, WAIS = Wechsler Adult Intelligence Scale. Group differences were assessed via simple pairwise t-tests. Significant differences are bolded.
Consistent with prior studies, older participants did not differ from the young group on target recognition (F(1,38) = 0.614, p = 0.438). Additionally, there was no difference between recognition of object targets and spatial targets (F(1,38) = 0.614, p = 0.415), and no interaction between age and test domain (object vs. spatial) (F(1,38) = 0.042, p = 0.838). Thus, recognition memory performance was comparable across test domains, and did not differ as a function of age (Fig. 1c). Averaged across similarity levels, lure discrimination was generally poorer in older participants (F(1,38) = 8.62, p = 0.006). We also observed an effect of test domain (F(1,38) = 10.67, p = 0.002) and an interaction between age and test domain for lures (F(1,38) = 5.148, p = 0.029) (Fig. 1d). Šidak-corrected post-hoc comparisons revealed that this difference was largely explained by poorer object discrimination in older adults compared to young (t(76) = 3.649, padj = 0.001), whereas no group difference was observed for spatial discrimination (t(76) = 1.57, padj = 0.227).
We next compared performance across similarity levels and between groups, separately examining object and spatial lure discrimination. For object lure discrimination, we found significant effects of similarity (F(2,76) = 72.23, p < 0.001) and age (F(1,38) = 13.36, p < 0.001), and an interaction between similarity and age (F(2,76) = 14.42, p < 0.001) (Fig. 1e). Post-hoc comparisons revealed that older adults were relatively impaired at object lure discrimination at middle (t(114) = 4.167, padj < 0.001) and low similarity (t(114) = 4.815, padj < 0.001). For spatial lure discrimination, we observed a significant effect of similarity (F(2,76) = 93.44, p < 0.001) but not age (F(1,38) = 2.425, p = 0.128), and no interaction (F(2,76) = 2.87, p = 0.063) (Fig. 1e). Post-hoc tests revealed that, although there was not a global age effect across spatial lures, older adults were relatively impaired at rejecting middle similarity lures (t(114) = 2.505, padj = 0.041). In sum, these results demonstrate that cognitively normal older adults were profoundly impaired at mnemonic discrimination of objects with a more subtle impairment in spatial discrimination.
Age-related hypoactivity in alEC during object discrimination
We subjected all fMRI data to standard preprocessing steps in AFNI, and conducted a general linear model univariate regression analysis with task conditions (including visual perceptual matching trials which served as a baseline task) and nuisance variables (including motion vectors and global signal outside the gray matter) entered as explicit regressors. Given that our hypotheses were specific to MTL regions, we conducted region-of-interest (ROI) analyses in MTL cortex and hippocampal subfields. Briefly, all subjects’ anatomical and functional images were brought into a common template space using a nonlinear registration approach. We then extracted average regression coefficients (beta weights) across anatomical ROIs and compared across task conditions and age groups within regions. ROIs are shown in Figure 2, and processing and analysis of imaging data are detailed in Methods.
Figure 2. Regions of interest (ROIs).
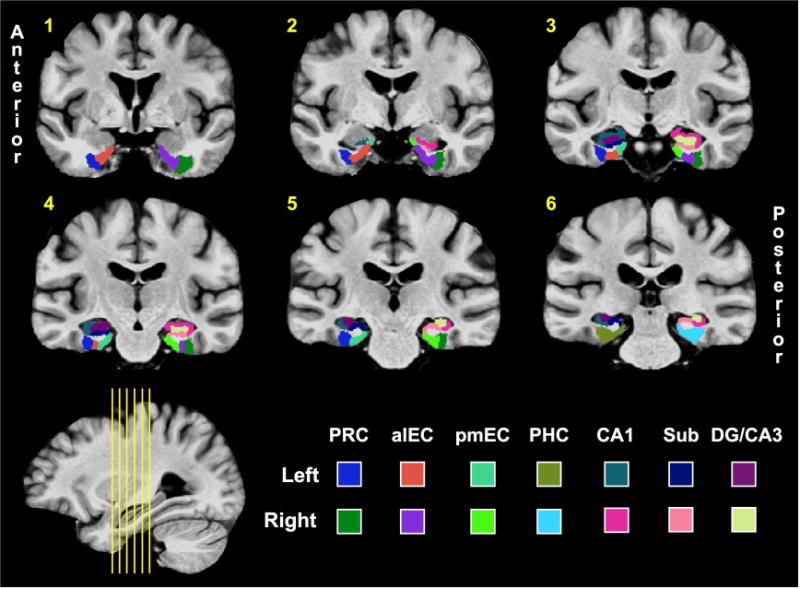
Hippocampal ROIs were based on prior studies12,13,24,40, and segmentation of alEC and pmEC was done by hand in accordance with the atlas generated by Maass and colleagues8. (PRC = perirhinal cortex; aLEC = anterolateral entorhinal cortex; pMEC = posteromedial entorhinal cortex; PHC = parahippocampal cortex; Sub = Subiculum; DG = dentate gyrus.)
Collapsed across similarity levels, left alEC showed an effect of test domain (F(1,38) = 6.683, p = 0.014) and an interaction between age and test domain (F(1,38) = 5.047, p = 0.031) during lure discrimination. Consistent with our prior work25, post hoc comparisons revealed greater engagement of alEC during object discrimination compared to spatial discrimination (t(38) = 3.417, padj = 0.003) in young participants. A task difference was not observed in older adults, and moreover, left alEC was relatively hypoactive in old compared to young subjects (t(76) = 2.387, padj = 0.039) (Fig. 3a).
Figure 3. Task and age effects in left alEC and right pmEC.
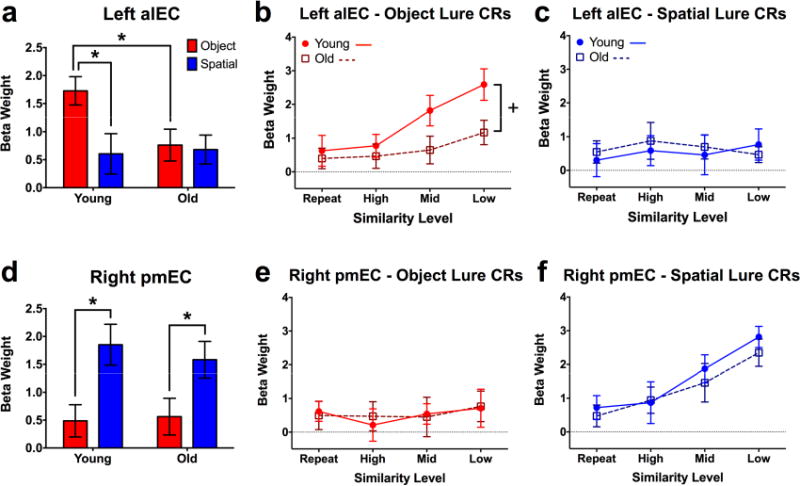
A) Collapsed across similarity levels, older participants show significantly lower activity in left alEC during object discrimination. B) Older adults show significantly lesser gains in alEC engagement with decreasing object similarity compared to young participants. C) alEC shows neither a modulation of spatial lure similarity nor age during spatial discrimination. D) Collapsed across similarity levels, both old and young participants show comparable levels of right pmEC engagement during spatial lure discrimination. E) pmEC shows neither a modulation of object lure similarity nor age during object discrimination. F) For both young and old participants, pmEC is increasingly engaged as lure similarity decreases during spatial discrimination, with no group difference. Data are shown as mean ± standard error (CR = correct rejection; * = Young > Old; + = Significantly different group slopes for the curve of alEC engagement across similarity levels; all post hoc tests are reported as p < 0.05 corrected for multiple comparisons.)
We next analyzed left alEC engagement across trial similarity levels, considering a range from target recognition (exact repetitions, the most similar) to discrimination of high, middle, and low similarity lures (the most dissimilar) (Fig. 3b). During object trials, we observed effects of age (F(1,38) = 4.613, p = 0.038) and similarity (F(3,114) = 7.192, p < 0.001), but no interaction. The data show a marked difference between age groups such that, although left alEC engagement increased as object similarity decreased, the magnitude of this function was considerably blunted in older adults. Post-hoc analyses were conducted using a curve-fitting approach, revealing significantly different slopes across age groups (F(1,156) = 4.136, p = 0.044). In contrast with object trials, the same analysis over spatial trials did not reveal any significant effects (Fig. 3c). Also, critically, age-related functional differences in alEC were independent of differences in cortical volume, as young and old subjects did not differ in this regard (Fig. S1, related to Fig. 3). Thus, compared to young participants, older adults showed alEC hypoactivity during object discrimination, which manifested as a blunted response across a range of item similarity independent of any structural differences. Greater responsiveness to object trials than spatial trials was also observed in PRC (F(1,38) = 14.29, p < 0.001), though we did not observe age-related hypoactivity there or in any other ROI. Moreover, response patterns across similarity levels in left PRC were qualitatively similar to those in left alEC (Fig. S2e, Supplemental Tables S1-3, related to Fig. 3). Responses in right alEC were comparable to those of left alEC across age groups, though no effects reached statistical significance (Fig. S2b, Supplemental Tables S1-3, related to Fig. 3).
In right pmEC, the collapsed analyses showed only an effect of test domain (F(1,38) = 15.22, p < 0.001). Post-hoc tests revealed that this was driven by greater task engagement during spatial compared to object discrimination across both young (t(38) = 3.157, padj = 0.006) and old participants (t(38) = 2.361, p = 0.046) (Fig. 3d). No difference was observed between age groups. Conducting the analyses across similarity levels, no effects were observed in right pmEC during object trials (Fig. 3e). In contrast, during spatial trials, we observed a significant effect of lure similarity (F(3,114) = 12.11, p < 0.001) but neither an effect of age nor an interaction (Fig. 3f). This is consistent with spatial tuning canonically found in rodent studies of the MEC32 as well as our prior results in human subjects (Reagh and Yassa, 2014). A highly similar set of results were observed bilaterally in parahippocampal cortex (PHC; Fig. S2g, h, Supplemental Tables S1-3, related to Fig. 3). We also observed some evidence for spatial tuning in left pmEC, but this did not reach statistical significance (Fig. S2c, Supplemental Tables S1-3, related to Fig. 3). Similar to alEC, we did not observe group differences in the volume of pmEC (Fig. S1, related to Fig. 3). In sum, whereas alEC was engaged during object but not spatial trials, pmEC was engaged during spatial but not object trials in young adults. Additionally, whereas alEC engagement was blunted in older adults, engagement of pmEC did not differ from young participants during spatial discrimination.
Age-related hyperactivity in DG/CA3 during lure rejection across domains
We next probed for task and age-related effects in hippocampal subfields. Collapsed across lure similarity in left DG/CA3, we found an effect of age (F(1,38) = 10.89, p = 0.002), but no difference across test domain, and no interaction during lure discrimination (Fig. 4a). Post-hoc comparisons revealed that, unlike the pattern observed in left alEC, engagement of left DG/CA3 was greater for old participants compared to young for both object (t(76) = 2.468, padj = 0.031) and spatial discrimination (t(76) = 2.78, padj = 0.014).
Figure 4. Task and age effects in left DG/CA3 and CA1.
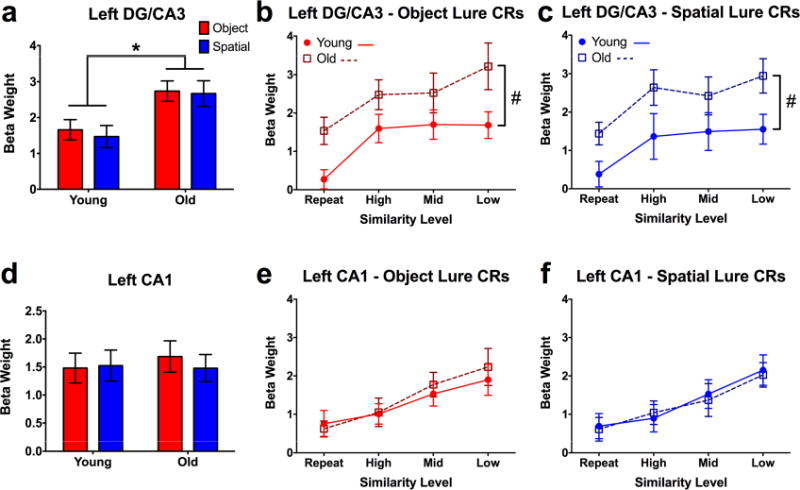
A) Collapsed across similarity levels, older participants show significantly higher activity in left DG/CA3 across both test domains. B, C) Compared to young participants, older adults show significantly greater activity in left DG/CA3 across all lure similarity levels during object and spatial discrimination. D, E) Both young and older participants show significantly increasing engagement of left CA1 with decreasing lure similarity, but no group differences. Data are shown as mean ± standard error. (CR = correct rejection; * = Young > Old; # = Significantly different group intercepts (but not slopes) for curves of DG/CA3 engagement across similarity levels; all post hoc tests are reported as p < 0.05 corrected for multiple comparisons.)
Analyzing across similarity bins, we found effects of age (F(1,38) = 10.02, p = 0.003) and lure similarity (F(3,114) = 6.22, p < 0.001) in left DG/CA3 during object trials (Fig. 4b). Similarly, during spatial trials, we found effects of age (F(1,38) = 9.009, p = 0.005) and similarity (F(3,114) = 4.345, p = 0.006) (Fig. 4c). Curve-fitting analysis revealed that while the slopes did not differ between groups, the intercepts differed for both object (F(1,157) = 14.818, p < 0.001) and spatial (F(1,157) = 14.059, p < 0.001) trials. Thus, while the overall “shape” of the functions observed in older adults are similar to the young group, the effect of aging is driven by general hyperactivity in DG/CA3 (across all levels of similarity) across test domains. This is consistent with prior studies in humans (Yassa et al., 2010a, 2010b, 2011) as well as rodents (Maurer et al., 2017; Moser, Kropff, and Moser, 2008; Robitsek et al., 2015) and monkeys (Thomé et al., 2016). Similar trends were observed in right DG/CA3, where we found significant effects of lure similarity across domains (p < 0.05). Though age-related differences were qualitatively similar, these effects failed to reach significance (Fig. S3b, Supplemental Tables S1-3, related to Fig. 4).
We next examined task-related modulations in the CA1 subfield. Though no task or age-related effects were observed when collapsing across similarity levels (Fig. 4d), when considering the full range of lures, we observed significant effects of similarity during object trials (F(3,114) = 8.860, p < 0.001) (Fig. 4e) and spatial trials (F(3,114) = 8.502, p < 0.001) (Fig. 4f). However, in sharp contrast to left DG/CA3, we did not observe effects of age in left CA1. This is highly consistent with prior in vivo studies in rodents (Wilson et al., 2005) (though studies in rabbit hippocampus suggest that this may be subject to individual differences in learning; see McEchron, Weible, and Disterhoft, 2001), and demonstrates that age-related hyperactivity is not found throughout the hippocampus (see also right CA1 and subiculum, Fig. S3c-f, Supplemental Tables S1-3, related to Fig. 4). Moreover, contrasted with the observed linear pattern in CA1, the curvilinear relationship observed in DG/CA3 (driven by a strong response even to highly similar lures) is consistent with a pattern separation transfer function, and is an independent replication of prior work (Lacy et al., 2011). This also contrasts with cortical regions such as alEC, pmEC, PRC, and PHC, which show domain-selectivity but do not respond to minor distortions in the form of high similarity lures.
Engagement of DG/CA3 and alEC correlates with behavior
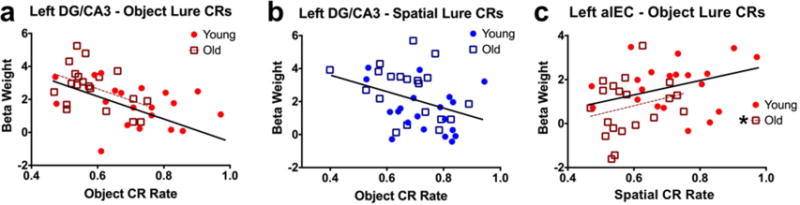
We next asked whether engagement of the key regions discussed here – left DG/CA3 and left alEC – was related to subjects’ discrimination performance. To address this question, we computed simple Pearson correlations between engagement of a given region (beta weights, averaged across similarity levels) and correct rejection rates for object or spatial trials. Correlations were assessed at the level of young subjects, old subjects, and the entire sample collapsed across age. In left DG/CA3, during object lure discrimination, we found a significant negative correlation in older adults (r = −0.454, t(18) = −2.164 p = 0.044) and in the entire sample (r = −0.485, t(38) = −3.423, p = 0.001) (Fig. 5a). Though the relationship was similar in young participants, the correlation was not significant (r = −0.309, t(18) = −1.376, p = 0.186). During spatial discrimination, we found a significant negative correlation between performance and left DG/CA3 across the entire sample (r = −0.37, t(38) = −2.457, p = 0.019), but neither age group featured a significant correlation individually (young: r = −0.283, t(18) = −1.252, p = 0.227) (old: r = −0.337, t(18) = −1.52, p = 0.146) (Fig. 5b). Thus, in general, greater engagement of DG/CA3 was associated with poorer mnemonic discrimination across test domains.
Figure 5. Correlations between left DG/CA3, left alEC, and behavior.
A, B) Left DG/CA3 engagement is negatively correlated with object and spatial discrimination performance across participants. The correlation was only significant for older participants during object discrimination, whereas for spatial discrimination, the correlation was significant across the entire sample but not for either age group individually. C) Left alEC engagement is positively correlated with object discrimination performance. Though the relationship is qualitatively similar for young participants, it reaches significance only for older adults. (Solid regression lines indicate significant whole-sample correlations, whereas broken regression lines indicate significance for a given age group.)
We next examined brain-behavior relationships in the left alEC. During object discrimination, engagement of left alEC was positively associated with behavioral performance in older adults (r = 0.46, t(18) = 2.195, p = 0.042) and across the entire sample (r = 0.41, t(38) = 2.774, p = 0.009) (Fig. 5c). The correlation was not significant in young adults (r = 0.154, t(18) = 0.661, p = 0.517). Thus, unlike the negative relationship observed in DG/CA3, greater engagement of alEC was associated with better object discrimination performance. Finally, we note that none of our neuropsychological tests correlated with our fMRI measures.
Relationship between DG/CA3 and alEC is disrupted in aging
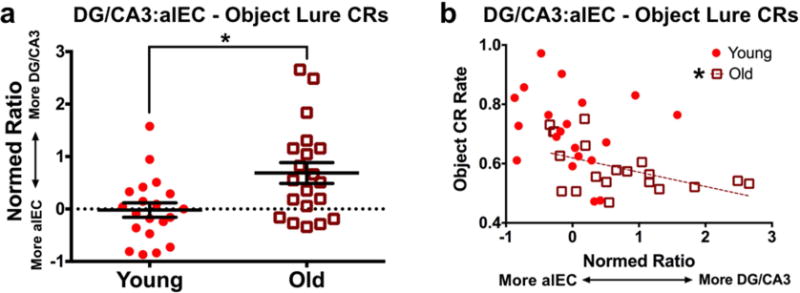
The above regional results suggest that DG/CA3 hyperactivity and alEC hypoactivity may be related conditions that are associated with object discrimination deficits. Though BOLD fMRI offers an indirect measure of neuronal activity, this would be consistent with recent findings in the rodent, where LEC cellular activity directly related to CA3 hyperactivity (Maurer et al., 2017). Additionally, recent studies in humans found that rebalancing of hyperactivity in DG/CA3 and hypoactivity in the EC (not divided into subregions) reversed mnemonic discrimination deficits for objects (Bakker et al., 2015). To assess the relationship between these regions, we asked whether alEC and DG/CA3 may be coupled in young and older adults during object discrimination trials. Rather than simply correlate activity between the regions, we calculated a normed ratio of DG/CA3 engagement relative to alEC engagement (sum of DG/CA3 and alEC divided by difference of DG/CA3 and alEC, with greater values being associated with a skew toward DG/CA3 activity). Young subjects had a mean ratio near zero, suggesting balanced engagement of DG/CA3 and alEC. Conversely, the ratio was significantly higher for older adults (t(18) = 3.139, p = 0.006), indicating greater DG/CA3 activity relative to alEC activity (Fig. 6a). Moreover, we found a significant negative correlation between ratio scores and object discrimination performance in older adults (r = −0.51, t(18) = −2.533, p = 0.021). Though the relationship was qualitatively similar in young subjects, there was not a significant correlation (r = −0.213, t(18) = −0.927, p = 0.366). In sum, in addition to disrupting the engagement of alEC and DG/CA3 individually, aging seems to imbalance the relationship between the regions during mnemonic discrimination of objects in a way that predicts impaired performance.
Figure 6. Normed ratios of left DG/CA3 vs. alEC activity across groups and relationship with behavior.
A) Older participants have a significantly higher ratio value than young adults, indicating greater DG/CA3 activity relative to alEC. Conversely, young participants have a near-zero mean ratio, indicating relatively balanced engagement of both regions. B) Object discrimination performance negatively correlates with this normed ratio in older adults, indicating greater DG/CA3 activity relative to alEC is associated with poorer object mnemonic discrimination. Despite a qualitatively similar relationship in young participants, the relationship does not yield a significant correlation. (Solid regression lines indicate significant whole-sample correlations, whereas broken regression lines indicate significance for a given age group).
Age-related disruption of domain-selective hippocampal-neocortical networks
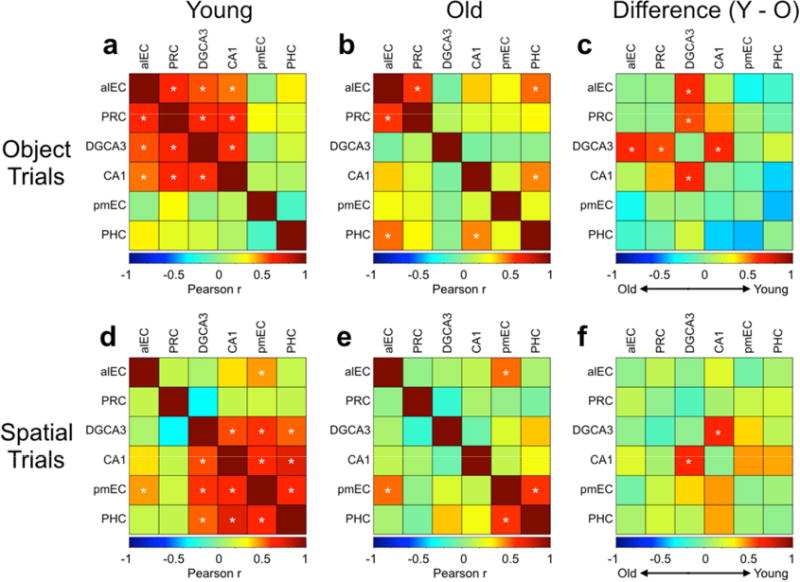
Finally, we aimed to test whether aging altered interregional task-driven correlations throughout the MTL. In a prior study (Reagh and Yassa, 2014), we found DG/CA3-LEC-PRC correlations during object discrimination and DG/CA3-MEC-PHC correlations during spatial discrimination. We conducted a similar set of analyses here. In this analysis, we correlated average interregional beta weights across participants within object or spatial trials. We collapsed across hemisphere in analyzing these correlations to maintain consistency with previous results (Reagh and Yassa, 2014), and observing the fact that while significant effects were generally not bilateral, they were qualitatively similar across hemispheres.
During object trials, we found significant pairwise correlations between alEC, PRC, DG/CA3, and CA1 (all p < 0.05 corrected), but not among any other regions in young participants (Fig. 7a). In older adults, we found a significant correlation between alEC and PRC (p < 0.05 corrected), but not between DG/CA3 and CA1, or among these hippocampal subfields and alEC or PRC (Fig. 7b). Additionally, older adults featured significant correlations between PHC and both CA1 and alEC that were not present in young participants (all p < 0.05 corrected) (Fig. 7b). To explicitly contrast young and old participants, we tested the difference of each pairwise correlation using Fisher’s r-to-z transform. For visualization, we plotted the subtraction of Pearson correlation coefficients (r) of older adults from younger adults (Fig. 7c). We found that younger adults had significantly greater correlations between alEC and DG/CA3 (z = −2.0, p = 0.045), PRC and DG/CA3 (z = −2.1, p = 0.036), and between CA1 and DG/CA3 (z = −2.19, p = 0.029).
Figure 7. Cross-regional correlations across conditions and age groups.
During object trials: A) Young participants feature significant correlations between alEC, PRC, DG/CA3, and CA1. B) Older participants feature significant correlations between alEC and PRC, alEC and PHC, and between PHC and CA1. C) Young participants have significantly higher correlations between DG/CA3 and alEC, DG/CA3 and PRC, and between DG/CA3 and CA1 compared to older participants. During spatial trials: D) Young participants feature significant correlations between pmEC, PHC, DG/CA3, and CA1, as well as between alEC and pmEC. E) Older participants feature significant correlations between pmEC and PHC, and between alEC and pmEC. F) Young participants have significantly higher correlations between DG/CA3 and CA1 compared to older participants (there is a trend toward age-related decreases in CA1 and both pmEC and PHC, but this difference is not significant). (* = significant correlation for left and middle panels, and significant group difference for right panels.)
During spatial trials, we found significant pairwise correlations between pmEC, PHC, DG/CA3, and CA1 in young participants, as well as between alEC and pmEC (all p < 0.05 corrected) (Fig. 7d). In older adults, we found a significant correlation between pmEC and PHC and between pmEC and alEC (p < 0.05 corrected), but not between DG/CA3 and CA1, or among hippocampal subfields and pmEC or PHC (Fig. 7e). Similar to object trials, older adults had significantly lower correlations between CA1 and DG/CA3 (z = −2.11, p = 0.035) during spatial trials (Fig. 7f). However, unlike object trials, no age-related differences in DG/CA3 correlations with MTL cortical regions were significant.
Overall, the group comparison results support the conclusion that aging is associated with domain-general (i.e. object and spatial conditions) reductions in DG/CA3-CA1 functional connectivity as well as domain-selective (object only) reductions in DG/CA3-PRC and DG/CA3-alEC functional connectivity.
Discussion
In this study, we observed significant age-related impairments in mnemonic discrimination of objects, contrasted with subtle impairments in spatial discrimination (Fig. 1). This was coincident with specific hypoactivity in left alEC (Fig. 3) and hyperactivity in left DG/CA3 (Fig. 4). Moreover, activity in alEC was positively correlated with object discrimination performance, whereas activity in DG/CA3 was negatively correlated with mnemonic discrimination across object and spatial trials (Fig. 5). A normed ratio of DG/CA3 and alEC activity demonstrated a skew toward DG/CA3 engagement and away from alEC engagement in older adults, which correlated with the extent of object discrimination deficits (Fig. 6). Importantly, these older participants were asymptomatic in terms of dementia or major indices of cognitive decline. Finally, we found that aging broadly affected interregional correlations throughout the MTL, but most drastically reducing correlations between DG/CA3 and alEC, PRC, and CA1 during object trials (only DG/CA3 correlations with CA1 differed for spatial trials).
The domain-selective functional dissociation we observed between alEC and pmEC is consistent with our prior findings (Reagh and Yassa, 2014) as well as resting state analyses (Maass et al., 2015; Navarro Schröder et al., 2015). Our results also accord with a recent report of alEC structural properties relating to object perception and cognitive outcomes (Yeung et al., 2017). However, we build significantly on these lines of research by providing, for the first time to our knowledge, evidence for age-related dysfunction of alEC in vivo. It is also important to consider that these participants were cognitively normal, although we cannot rule out the presence of pathology. Additionally, our multi-domain approach allowed us to dissociate subtly impaired spatial discrimination from more drastically impaired object discrimination. This implies that even relatively “normal” aging might feature functional decline of alEC alongside selectively disrupted mnemonic discrimination of objects, and that alEC dysfunction may not in itself indicate the presence of a disease state. The lack of alEC structural thinning in this sample of older adults would argue against these effects being driven by neurodegenerative loss. Importantly, it has been widely hypothesized that functional disruption of MTL circuits precedes structural degradation by a considerable amount of time (Jack et al., 2010; Jagust, 2013; Reagh and Yassa, 2017). Indeed, typical age-related memory decline is not in itself associated with significant loss of cells in the MTL (Burke and Barnes, 2006). Thus, with this paradigm, we may be uncovering subtle changes to the MTL that may confer vulnerability on the aging brain.
Pathological hippocampal hyperactivity is now fairly well-established in age-related cognitive decline across rodents (Maurer et al., 2017; Moser, Kropff, and Moser, 2008; Robitsek et al., 2015), primates (Thomé et al., 2016), and humans (Yassa et al., 2010a, 2010b, 2011). This hyperactivity is relatively specific to the CA3 subfield of the hippocampus, and loss of GABAergic inhibitory interneurons may be a contributor to this phenomenon (Thomé et al., 2016). A recent set of studies across transgenic mice (Sanchez et al., 2012), rats (Koh et al., 2010; Robitsek et al., 2015), and humans (Bakker et al., 2013) with age-related cognitive impairment related hippocampal hyperactivity to memory deficits. Reduction of hyperactivity with a low dose of levetiracetam (LEV), an anti-epileptic drug targeting excitatory neurotransmission, largely ameliorated memory deficits as well as CA3 hyperactivity (combined DG/CA3 in human subjects), and a more recent study in humans found that EC hypoactivity was also normalized by the treatment (Bakker et al., 2015). Our results are therefore well in line with these findings, and extend them to suggest a specific role for alEC (as opposed to the entire EC) as well as the potential importance of the relationship between alEC and DG/CA3. With regards to alEC hypoactivity and object discrimination deficits observed in our study, we note that we cannot be certain which phenomenon drives the other. That is, there remains a possibility that alEC is hypoactive because of a perceptual deficit in visual processing streams, though older adults were ensured to have normal or corrected-to-normal vision during scanning. Importantly, we note that in many previous studies using mnemonic discrimination paradigms, older adults do not show discrimination deficits in a delayed match-to-sample version of the task, arguing against a simple perceptual deficit (Yassa et al., 2010a).
Given prior findings of PRC dysfunction in animal models of aging (Burke et al., 2011, 2014; Ryan et al., 2012) and AD-related pathology in the region (Braak, Braak, and Bohl, 1993; Braak and Braak, 1995; Hirni et al., 2016; Jack et al., 1997), it is interesting and perhaps surprising that we found no evidence for age-related PRC dysfunction. One possibility is that mnemonic discrimination more uniquely drives age-related differences in alEC than PRC in the context of our task. Moreover, as fMRI is unable to address directionality of neural signaling (and that BOLD activity may reflect bidirectional synaptic activity, given the fairly coarse temporal resolution), it may be that alEC is receiving inputs from both from PRC and the hippocampus, thereby boosting task-relevant signal in the region and enhancing our ability to detect age-related changes. While we cannot rule out that, given the inherent blur of fMRI data, we simply captured some PRC signal with our alEC mask, we note that dysfunction in alEC but not PRC (its primary input) might further argue against a simple perceptual deficit.
Analyses of global correlations among MTL subregions were additionally informative. We found evidence for a general reduction in task-driven interregional correlations in MTL circuitry with aging. Whereas young participants showed robust domain-selective interregional coupling, this correlational structure was weaker in older adults. This weakening was most prominent in relationships between DG/CA3 and CA1 across object and spatial domains. Object trials uniquely demonstrated additional significant age-related differences, where DG/CA3 correlations with alEC and PRC were significantly lower in older adults. Interestingly, however, alEC-PRC correlations did not themselves differ, which may suggest that hippocampal coordination with MTL cortices are more vulnerable than coordination among those cortical areas themselves. Overall, this aligns fairly well with our behavioral findings. Broader network-level dysregulation among alEC, PRC, and the hippocampus during object trials may be related to our observation that object discrimination deficits were more pronounced in older adults compared to spatial discrimination deficits. Furthermore, related to the prior points about PRC, this would suggest that while PRC itself may not have shown direct evidence of age-related dysfunction, its functional coupling with other MTL regions may be disrupted. Additionally, the breakdown of communication specifically between DG/CA3 and CA1 during spatial trials offers insight as to the subtler spatial discrimination deficits. The more “spatial” cortical network may be relatively intact, but an inability of DG/CA3 to effectively coordinate with other hippocampal subfields under conditions of mnemonic interference may underlie the less pronounced spatial discrimination deficits we observed.
As DG/CA3 hyperactivity and alEC hypoactivity were found to co-occur in older subjects, this raises a key question: how do these phenomena relate mechanistically? It must of course be noted that fMRI is unable to weigh in on the dynamics of neuronal circuits or the directionality of shared signaling. However, a recent study in rodents by Maurer et al. (2017) offers some insight. In addition to projections to DG, perforant path input from the lateral EC projects directly to CA3. In their experiment, Maurer and colleagues found that old rats with object discrimination deficits featured CA3 hyperactivity as well as a greater overall proportion of active CA3 cells, which was directly influenced by inputs from lateral EC (though it must be noted that, in this study, lateral EC neurons were found to be hyperactive, the directionality of which contrasts with our own findings). As CA3 is more excitable than DG even in healthy young animals, an overall drop in alEC signaling could potentially lead to an imbalance in the EC-hippocampal circuit such that the CA3 autoassociative networks is reinforced. Thus, in the case of objects, this could bias the hippocampus away from novel encoding of incoming sensory information (i.e., through pattern separation) and more toward generalization based on stored representations (i.e., through pattern completion)11. As the signal from EC is corrupted on its way into the hippocampus, and as the signal passes hierarchically through the network, the mismatch between EC and the hippocampal representation may become amplified during CA3 autoassociation. Another possibility, which is not mutually exclusive, is that hyperactivity in CA3 could impose a stressful condition that leads to retraction of pyramidal cell apical dendrites and retrograde degeneration of the perforant path from alEC. Reduction of axon collaterals and synaptic contacts has been demonstrated reliably in the perforant path of aged rodents (Barnes, 1979; Geinisman, de Toledo-Morrell, and Morrell, 1986; Geinisman et al., 1992; Smith et al., 2000), and more recently, findings from human diffusion-weighted imaging studies suggest reduction of white matter integrity in the perforant path (Yassa et al., 2010b, 2011). Importantly, these changes occur in the absence of frank neuronal loss in the region. This would suggest that CA3 hyperactivity may be a driving factor in alEC hypoactivity. This would accord with the impact of LEV administration in aging, which targets hyperactivity but additionally rescues alEC hypoactivity, perhaps via re-tuning hippocampal dynamics and allowing CA3 to effectively process alEC input. We also note that, in older adults, the blunted response to object trials in alEC brings its object-related responses to a level that is comparable to spatial trials. This tipped balance in domain-selectivity may alter the encoding properties of the aging alEC.
Our data and those of Maurer and colleagues (2017) suggest that dysfunction to the alEC-CA3 circuit may be specifically linked to this age-related mnemonic discrimination deficits observed. The aforementioned difference in directionality of age-related latereal EC modulation between our study and that of Maurer and colleagues is interesting, and warrants further investigation. It is possible that discrepancies between principle cell and interneuron firing could drive the BOLD signal in a way that would not be evident from pyramidal neuronal activity alone, or that the mechanistic imbalance in the aging MTL circuit indeed differs between species. The exact mechanisms and temporal order of these events remains an important question for future work to continue to address. However, the observed disruption of alEC and DG/CA3 dynamics, namely the ratio of engagement between regions, offers a unique and potentially powerful avenue for understanding healthy versus pathological aging (Jack et al., 2010). For instance, one might hypothesize that individuals with AD-related pathology (such as amyloid and tau accumulation) or those along the road to major cognitive decline will feature ratios more skewed toward DG/CA3 activity relative to healthy controls, or that this skew will emerge earlier. Thus, the ratio measure may serve as a potential biomarker for clinical interventions. Future studies will be needed to examine these links, and longitudinal experiments tracking participants over time can evaluate the predictive power of such a candidate biomarker.
In conclusion, these findings serve as a mechanistic basis for object discrimination impairments in aging – an imbalance in the alEC-DG/CA3 circuit characterized by reduced signaling in the alEC coupled with increased signaling in DG/CA3. This work has important implications for future assessments of MTL regions, as well as specific mnemonic functions as we characterize different aging trajectories.
Methods
Subjects
Twenty-six young adults and 25 older adults were initially recruited for the study from the UC Irvine and greater Orange County community. One young participant and one older participant were excluded from analysis due to confusion with the task. An additional two young adults and one older participant were excluded due to excess motion in the scanner. Finally, three young participants and three older participants were excluded due to poor signal in the medial temporal lobes (particularly the entorhinal cortex – see Image Preprocessing below). This yielded a final sample of 20 young adults (15 female, range = 18-31 years, mean = 21.75 years, SD = 4.08 years) and 20 older adults (13 female, range = 64-89 years, mean = 73.6 years, SD = 6.2 years) included in final imaging analyses. All subjects were screened for neurological conditions (e.g., history of stroke or mental illness). Subjects gave written informed consent in accordance with the UC Irvine Institutional Review Board, and were compensated for their participation.
A neuropsychological battery was administered to characterize our sample (Table 1). Importantly, broad assays of cognitive impairment (e.g., the Montreal Cognitive Assessment) did not differ as a function of age. We did observe group differences in the Trails A and B tests (sensitive to executive function and task flexibility), the Benson Delayed Recall test (sensitive to memory for complex objects, though the Recognition test was unaffected), the RAVLT Immediate and Delayed Recall tests (sensitive to verbal memory, though the Recognition test was unaffected), the NAART35 (sensitive to verbal intellectual ability), and MINT Uncued (sensitive to verbal fluency). However, declining performance on these particular tests are not uncommon in typical aging, and even our lowest performing subjects did not deviate in performance from age-matched norms.
Behavioral Task
The task was an optimized version of a prior paradigm (Reagh et al., 2016) which we optimized for the scanner. Participants completed six blocks of study and test, with three blocks testing memory for object identity and the other two testing memory for spatial locations Fig. 1). To facilitate ease of the task for older adults, subjects completed three blocks of either the object or spatial task consecutively before switching to the other. Though a randomized block delivery would be ideal, pilot testing suggested that some older participants struggled with switching between tasks flexibly. Importantly, the order of task completion was counterbalanced across our sample.
Stimuli consisted of colored images of common objects appearing on a 7 × 5 spacing scheme (accommodating a widescreen display). Objects were displayed for 3 seconds, with a 1 second inter-stimulus interval. Study and test sequences each consisted of 50 trials. Of these 50 trials, 42 consisted of images of objects. Both study and test runs included 8 trials of a visual perceptual matching task, which were used as a baseline for task-driven activity estimates (see MRI Data Analysis below). During this baseline condition, subjects saw two blurred dots in the middle of the screen and were asked whether they were equally dark in shade (the actual probability of equal shading was 50%, and the differences in opacity when present varied from 5%-25%). During object test blocks, targets were identical to studied objects whereas lures were objects that were perceptually similar, but not identical (Fig. 1a). Similarity bins for object lures were based on a priori similarity indices validated by prior studies (Stark et al., 2014; Lacy et al., 2011). Specifically, we used bins 2, 3, and 4 (out of the full range of 1-5) reported by these studies. During spatial test blocks, targets were studied objects occupying the same grid space whereas lures were studied objects occupying a different location than the original location (Fig. 1b). Similarity bins for spatial lures were based on prior work (Reagh and Yassa, 2014; Reagh et al., 2013, 2016), matched to object similarity bins resulting in 2, 3, and 4 grid moves for high, mid, and low spatial similarity respectively. Unlike several of our prior studies, we did not include completely novel items at test. Subjects were aware that their memory was to be tested following study blocks, but specific non-mnemonic judgments were made during study to foster attention to stimuli. Critically, judgments did not differ as a function of task. That is, all study blocks featured “Indoors or Outdoors?” judgments, and all test blocks featured “Same or Different?” judgments (referring to the object itself in object blocks, and the location in spatial blocks). Responses were recorded via button-press. Objects were unique to each block, and each space on the grid (excluding corners) was equally likely to be occupied. Within a block, trial order was completely random. The task was programmed in Python (version 2.7) using PsychoPy (Pierce, 2007, 2009).
Image Acquisition
Neuroimaging data were acquired on a 3.0 Tesla Philips Achieva scanner, using a 32-channel sensitivity encoding (SENSE) coil at the Neuroscience Imaging Center at the University of California, Irvine. A high-resolution 3D magnetization-prepared rapid gradient echo (MP-RAGE) structural scan (0.75 mm isotropic voxels) was acquired at the beginning of each session: repetition time (TR)=11 ms, echo time (TE)=5.03ms, 231 slices, 0.65mm isotropic, field of view (FOV)=231.174×240×150.150. Functional MRI scans consisted of a T2*-weighted echo planar imaging (EPI) sequence using blood-oxygenation-level-dependent (BOLD) contrast: TR=2500 ms, TE=26 ms, flip angle=70 degrees, 39 slices, 84 dynamics per run, 1.8 × 1.8 mm in plane resolution, 1.6 mm slice thickness with a 0.2 mm gap, FOV=180×77.8×180. Slices were acquired as a partial axial volume and without offset or angulation. Four initial “dummy scans” were acquired to ensure T1 signal stabilization. A total of 12 functional runs were acquired for each participant, 6 study phases and 6 test phases (3 each of study and test for object and spatial blocks), except for one older participant who had only two usable runs of the spatial memory test (however, a sufficient number of trials were acquired from the first two runs). Each functional run lasted 4 minutes and 30 seconds. For each subject, T2-weighted scans and ultrahigh-resolution diffusion-weighted scans were also acquired, though they are not analyzed here.
Image Preprocessing
All neuroimaging data were preprocessed and analyzed using Analysis of Functional NeuroImages (AFNI, version 17.2.00) (Cox, 1996) on GNU/Linux and Mac OSX platforms. Analyses largely took place in accordance with the standardized afni_proc.py pipeline. EPIs were corrected for motion (3dvolreg) and slice timing (3dTshift), masked to exclude voxels outside the brain (3dautomask), and were smoothed (3dmerge) using a 2.0mm Gaussian FWHM kernel. Motion correction parameters were saved into text files for later use in linear regression (see MRI Data Analysis below). Each run was also despiked to further reduce the influence of motion on the data (3dDespike). Functional scans were aligned to each subject’s skull-stripped MP-RAGE (align_epi_anat.py). We used Advanced Normalization Tools (ANTs) (Avants et al., 2011) to warp each individual participant’s MP-RAGE structural scan into our custom in-house high-resolution 0.75mm isotropic template using SyN nonlinear registration. Parameters from these warps were used to also warp functional scans into template space for group ROI analyses (see ROI Segmentation and MRI Data Analysis below). Masks were resampled to match the resolution of the fMRI data (2.0mm isotropic) and were further masked to exclude partially sampled voxels within and across runs (3dcalc).
Prior to further analysis, we took two steps to ensure that data quality – particularly in the EC, given signal dropout issues in the region – was sufficient for each participant. First, we calculated the ratio of EPI voxels in the alEC and pmEC ROIs to overall voxels in the ROI, which served as an index of how much dropout occurred. Subjects missing greater than 25% of alEC or pmEC voxels were excluded. Second, we examined the signal-to-noise ratio of the time series (TSNR) for each subject. Overall TSNR was adequate, but several participants featured considerably lower values in the MTL. Examples of “good” and “poor” MTL tSNR can be seen for young and older participants in Supplemental Figures S4 and S5 (related to Methods), respectively. We excluded subjects whose TSNR in the alEC or pmEC was >50 for greater than 25% of voxels in the ROI. These steps ultimately resulted in 3 young and 3 older participants being excluded from further analysis.
ROI Segmentation
We defined ROIs in the medial temporal lobes (MTL) based on our established protocol (Yassa et al., 2010a; Reagh and Yassa, 2014). Briefly, segmentation of hippocampal subfields was conducted in accordance with the SY protocol reported in Yushkevich and colleagues (2015) though the CA1-subiculum boundary was updated to reflect recent efforts at harmonizing across hippocampal segmentation protocols (Wisse et al., 2017). As we did not have hypotheses regarding the longitudinal axis of the hippocampus, we did not split hippocampal ROIs into anterior and posterior segments. The most notable addition to the protocol was segmentation of alEC versus pmEC. Whereas we previously segmented the EC into lateral and medial portions25, here we incorporated the segmentation of Maass et al. (2015) on the basis of their results and related findings of Navarro Schroder et al. (2015). Briefly, these two groups independently found resting time-series correlations between PRC and PHC to respective alEC and pmEC subregions, and Maass and colleagues generated a freely-available alEC and pmEC segmentation on their group template. We resampled their data to the resolution of ours, and hand-segmented the ROIs into our template slice-by-slice in the coronal plane using the Maass et al. template as a reference. All ROIs are displayed in a series of 6 slices in Figure 2. Our group template and ROI mask are available upon request.
MRI Data Analysis
Only test data are included in the analyses here. We constructed a general linear model (GLM) with regressors for all trial types: target hits, target misses, lure rejections, lure false alarms, and perceptual task trials. We additionally included regressors for six motion vectors derived from the motion correction preprocessing step (x, y, z, pitch, roll, yaw) as well as non-response trials. There were too few target misses to analyze activity during those trials, and given that our hypotheses were fairly specific to lure rejections, we also did not analyze activity during lure false alarms. These steps were conducted in AFNI using 3dDeconvolve. Deconvolution of the hemodynamic response was done using tent functions covering stimulus onset to 15 seconds after onset with 6 estimator functions distributed across this time window. Motion parameters were entered into the model as explicit regressors to reduce the influence of motion on task-related parameter estimates, and non-response trials were entered to exclude these ambiguous trials from serving as a baseline condition. Additionally, vectors modeling temporal drift were entered as regressors covering first and second-order polynomials. We explicitly modeled perceptual matching trials as the baseline for general linear tests of our task conditions, as this serves as a fairly robust “zero” point for comparing conditions in MTL regions (Stark and Squire, 2002). For all functional runs, TRs with motion exceeding 0.5mm frame displacement (but below our exclusion threshold of 3mm) were censored from analyses, as well as the immediately preceding and following TRs. Finally, global signal from the ventricles and white matter was excluded from gray matter voxels using ANATICOR (Jo et al., 2010). These fairly rigorous “data scrubbing” procedures were employed to attempt to exclude the potential effects of head motion on activation profiles (Power et al., 2012).
Final beta weights entered into second-level analyses consisted of the average of the first three estimator functions (targeted to capture the peak of the BOLD response). These beta weights were extracted from ROIs (3dmaskave), and ANOVAs were used to probe significant effects of age, test domain, and lure similarity across regions (see Statistical Testing and Data Availability below). Though we employed an exclusively ROI-based approach given our a priori hypotheses about the data, we note that, in general, image contrasts of the effects reported here (e.g., greater alEC activity in young compared to older participants) are significant at the level of a group t-test (Fig. S6, related to Fig. 3 and Methods).
The normed ratio between left DG/CA3 and alEC (Fig. 6) was calculated as the sum of DG/CA3 and alEC beta weights divided by the difference of DG/CA3 and alEC beta weights. This approach has been used in other published work (Furman et al., 2014) and yields a measure of the relative engagement between two regions. In the present formulation, alEC beta weights was added to or subtracted from those of DG/CA3. Consequently, a greater value indicates a ratio more heavily in favor of DG/CA3 engagement, whereas a smaller value indicates a ratio more heavily in favor of alEC engagement.
Interregional correlations were conducted using the rcorr library in the R statistical computing language. We used Pearson r correlations, and used a Bonferroni correction to adjust for multiple comparisons over each family of data (i.e., object trials and spatial trials). Significance was thresholded at p < 0.05 corrected. Correlation plots were generated using the corrplot library in R.
Cortical Volume Estimates for alEC and pmEC
Each participant’s MTL was segmented using a multi-atlas label fusion (MALF) approach (Wang et al., 2013). This approach uses multiple segmentation atlases, which consisted of twenty expert-labeled example brains (hippocampal labels were applied for use in prior publications, and alEC/pmEC labels were added by Z.M.R.). During the MALF procedure, all segmentation atlases are registered to a target image (i.e., each participant’s brain). The MALF weighting scheme for choosing the ROI label at each voxel in the target image simultaneously maximizes atlas similarity within a local neighborhood of the target image while minimizing informational redundancy amongst the atlas set. The consequence of this is that for any given ROI, the atlas whose brain structure most closely matches the participant is weighed most heavily in labeling that ROI in a subject’s space, which accounts for a great deal of structural variability across subjects. Cortical volume measures in alEC and pmEC were extracted as the overall volume (in mm3) across the ROI as labeled on the subject’s brain, which were aggregated across subjects and corrected for global gray matter volume for each subject. Results are plotted in Supplemental Figure S1 (related to Fig. 3).
Statistical Analysis and Data/Software Availability
Image preprocessing and analyses were conducted in AFNI (version 16.0) using standard functionality (noted throughout the Methods section), and custom shell scripts were created to batch routines. These scripts as well as the structural and functional MRI data are available upon request. Statistical tests and figures were performed with GraphPad Prism (Version 6.07), and the relevant data file is available upon request. All statistical tests were two-tailed.
For both behavior and fMRI data, analyses collapsed across similarity bins were carried out using two-way mixed ANOVAs, with age as a between-subjects factor and test domain as a within-subjects factor. For analyses across similarity bins for a given domain, tests were carried out using two-way mixed ANOVAs, with age as a between-subjects factor and similarity as a within-subjects factor. As we performed ROI-based analyses and did not conduct any statistical comparisons across regions, assessing effects within one region should be statistically independent of testing within another region (Poldrack and Mumford, 2009). That is, in contrast with a voxelwise approach, here we are contrasting within-ROI responses across conditions, and each ROI is being treated independently. We therefore did not adjust our global significance threshold for detecting main effects in these ANOVAs. Pairwise post hoc comparisons were adjusted via the Sidak correction (Sidak, 1967). Briefly, this sets a familywise error rate of 0.05 by accounting for the number of comparisons. Relationships between behavior and fMRI measures were assessed with Pearson correlations. Contrasts between the slopes and intercepts of correlations across age groups were conducted using curve fitting analyses, implemented as simple linear fits in Prism.
Key Resources Table
| REAGENT or | SOURCE | IDENTIFIER |
|---|---|---|
| Software and Algorithms | ||
| Python 2.7 | Python Software Foundation | https://www.python.org/downloads/ |
| PsychoPy v 1.8 | Jonathan Pierce | http://psychopy.org/installation.html |
| AFNI 17.3 | National Institute of Mental Health | https://afni.nimh.nih.gov/download |
| Advanced Normalization Tools (ANTs) 2.1 | Brian Avants, Nicholas Tustison, Hans Johnson et al. | http://stnava.github.io/ANTs/ |
| Prism | GraphPad | https://www.graphpad.com/scientific-software/prism/ |
| R | R Project for Statistical Computing | https://www.r-project.org |
Supplementary Material
Highlights.
The anterolateral entorhinal cortex (alEC) is hypoactive in older adults.
The hippocampal dentate and CA3 (DG/CA3) regions are hyperactive in older adults.
Imbalance of DG/CA3-alEC predicts deficits in object mnemonic discrimination.
Imbalance of DG/CA3-alEC is a novel biomarker for age-related memory decline.
Acknowledgments
We thank our participants for volunteering to take part in our research. We thank Matthew Tsai, Vishali Kapoor, and Diana Salama for assistance with data collection. We also thank Rebecca Stevenson, Maria Montchal, Corey Fernandez, Craig Stark, Shauna Stark, and Marcelo Wood for helpful discussions. Special thanks to David Berron and Emrah Düzel for sharing their alEC/pmEC segmentations, and for their valuable insights about the data. This work was supported by US National Institute on Aging grants P50AG05146, R21AG049220 and R01AG053555 (to M.A.Y.), as well as support for Z.M.R. provided by US National Science Foundation Graduate Research Fellowship DGE-1232825, NIA T32AG000096, and fellowships from the UC Irvine Chancellor’s Club and the ARCS and Roche Foundations.
Footnotes
Publisher's Disclaimer: This is a PDF file of an unedited manuscript that has been accepted for publication. As a service to our customers we are providing this early version of the manuscript. The manuscript will undergo copyediting, typesetting, and review of the resulting proof before it is published in its final citable form. Please note that during the production process errors may be discovered which could affect the content, and all legal disclaimers that apply to the journal pertain.
Author Contributions:
Z.M.R. and M.A.Y. designed the research. Z.M.R. and J.A.N. collected data. J.A.N. and E.A.M. recruited participants. Z.M.R., N.J.T., and D.D. conducted analyses. Z.M.R. and M.A.Y. wrote the paper.
Declaration of Interests:
The authors declare no competing interests.
References
- Avants BB, Tustison NJ, Song G, Cook PA, Klein A, Gee JC. A reproducible evaluation of ANTs similarity metric performance in brain image registration. NeuroImage. 2011;54(3):2033–44. doi: 10.1016/j.neuroimage.2010.09.025. [DOI] [PMC free article] [PubMed] [Google Scholar]
- Bakker A, Albert MS, Krauss G, Speck CL, Gallagher M. Response of the medial temporal lobe network in amnestic mild cognitive impairment to therapeutic intervention assessed by fMRI and memory task performance. Neuroimage Clinical. 2015;7:688–98. doi: 10.1016/j.nicl.2015.02.009. [DOI] [PMC free article] [PubMed] [Google Scholar]
- Bakker A, Krauss GL, Albert MS, Speck CL, Jones LR, Stark CEL, Yassa MA, Bassett SS, Shelton AL, Gallagher M. Reduction of hippocampal hyperactivity improves cognition in amnestic mild cognitive impairment. Neuron. 2013;74(3):467–74. doi: 10.1016/j.neuron.2012.03.023. [DOI] [PMC free article] [PubMed] [Google Scholar]
- Barnes CA. Memory deficits associated with senescence: A neurophysiological and behavioral study in the rat. J Comp Physiol Psych. 1979;93(1):74–104. doi: 10.1037/h0077579. [DOI] [PubMed] [Google Scholar]
- Braak H, Braak E. Staging of Alzheimer’s disease-related neurofibrillary changes. Neurobiol Aging. 1995;16:271–278. doi: 10.1016/0197-4580(95)00021-6. [DOI] [PubMed] [Google Scholar]
- Braak H, Braak E, Bohl J. Staging of Alzheimer-related cortical destruction. Eur Neurol. 1993;9(Suppl 1):257–261. doi: 10.1159/000116984. discussion 269-272. [DOI] [PubMed] [Google Scholar]
- Burke SN, Barnes CA. Neural plasticity in the ageing brain. Nat Rev Neurosci. 2006;7(1):30–40. doi: 10.1038/nrn1809. [DOI] [PubMed] [Google Scholar]
- Burke SN, Maurer AP, Nematollahi S, Uprety A, Wallace JL, Barnes CA. Advanced age dissociates dual functions of the perirhinal cortex. J Neurosci. 2014;34:467–480. doi: 10.1523/JNEUROSCI.2875-13.2014. [DOI] [PMC free article] [PubMed] [Google Scholar]
- Burke SN, Wallace JL, Hartzell AL, Nematollahi S, Plange K, Barnes CA. Age-associated deficits in pattern separation functions of the perirhinal cortex: a cross-species consensus. Behav Neurosci. 2011;125:836–847. doi: 10.1037/a0026238. [DOI] [PMC free article] [PubMed] [Google Scholar]
- Cox RW. AFNI: Software for analysis and visualization of functional magnetic resonance neuroimages. Comp and Bio Res. 1996;29:162–173. doi: 10.1006/cbmr.1996.0014. [DOI] [PubMed] [Google Scholar]
- Eichenbaum H, Sauvage M, Fortin N, Komorowski R, Lipton P. Towards a functional organization of episodic memory in the medial temporal lobe. Neurosci Biobehav Rev. 2012;36:1597–1608. doi: 10.1016/j.neubiorev.2011.07.006. [DOI] [PMC free article] [PubMed] [Google Scholar]
- Furman AJ, Clements-Stephens AM, Marchette SA, Shelton AL. Persistent and stable biases in spatial learning mechanisms predict navigational style. Cogn Affect Behav Neurosci. 2014;14:1375–91. doi: 10.3758/s13415-014-0279-6. [DOI] [PubMed] [Google Scholar]
- Geinisman Y, de Toledo-Morrell L, Morrell F. Loss of perforated synapses in the dentate gyrus: morphological substrate of memory deficit in aged rats. Proceedings of the National Academy of Sciences. 1986;83(9):3027–31. doi: 10.1073/pnas.83.9.3027. [DOI] [PMC free article] [PubMed] [Google Scholar]
- Geinsman Y, de Toledo-Morrell L, Morrell F, Persina IS, Rossi M. Age-related loss of axospinous synapses formed by two afferent systems in the rat dentate gyrus as revealed by the unbiased stereological dissector technique. Hippocampus. 1992;2(4):437–44. doi: 10.1002/hipo.450020411. [DOI] [PubMed] [Google Scholar]
- Hirni DI, Kivisaari SL, Krumm S, Monsch AU, Berre M, Oeksuez F, Reinhardt J, Ulmer S, Kressig RW, Stippich C, Taylor K. Neuropsychological markers of medial perirhinal and entorhinal cortex functioning are impaired twelve years preceding diagnosis of Alzheimer’s dementia. Journal of Alzheimers Disease. 2016;52:573–80. doi: 10.3233/JAD-150158. [DOI] [PubMed] [Google Scholar]
- Hunsaker MR, Chen V, Tran GT, Kesner RP. The medial and lateral entorhinal cortex both contribute to contextual and item recognition memory: a test of the binding of items and context model. Hippocampus. 2013;23:380–391. doi: 10.1002/hipo.22097. [DOI] [PubMed] [Google Scholar]
- Jack CR, Knopman DS, Jagust WJ, Shaw LM, Aisen PS, Weiner MW, Petersen RC, Trojanowski JQ. Hypothetical model of dynamic biomarkers of the Alzheimer’s pathological cascade. Lancet Neurology. 2010;9(1):119–28. doi: 10.1016/S1474-4422(09)70299-6. [DOI] [PMC free article] [PubMed] [Google Scholar]
- Jack CR, Petersen RC, Xu YC, Waring SC, O’Brien PC, Tangalos EG, Smith GE, Ivnik RJ, Kokmen E. Medial temporal atrophy on MRI in normal aging and very mild Alzheimer’s disease. Neurology. 1997;49(3):786–794. doi: 10.1212/wnl.49.3.786. [DOI] [PMC free article] [PubMed] [Google Scholar]
- Jagust W. Vulnerable neural systems and the borderland of brain aging and neurodegeneration. Neuron. 2013;77(2):219–234. doi: 10.1016/j.neuron.2013.01.002. [DOI] [PMC free article] [PubMed] [Google Scholar]
- Jo HJ, Saad ZS, Simmons WK, Milbury LA, Cox RW. Mapping sources of correlation in resting state fMRI, with artifact detection and removal. Neuroimage. 2010;52(5):571–582. doi: 10.1016/j.neuroimage.2010.04.246. [DOI] [PMC free article] [PubMed] [Google Scholar]
- Johnson SA, Turner SM, Santacroce LA, Carty KN, Shafiq L, Bizon JL, Maurer AP, Burke SN. Rodent age-related impairments in discrimination perceptually similar objects parallel those observed in humans. Hippocampus. 2017;27(7):759–76. doi: 10.1002/hipo.22729. [DOI] [PMC free article] [PubMed] [Google Scholar]
- Keene CS, Bladon J, McKenzie S, Liu CD, O’Keefe J, Eichenbaum H. Complementary functional organization of neuronal activity patterns in the perirhinal, lateral entorhinal, and medial entorhinal cortices. J Neurosci. 2016;36(13):3660–75. doi: 10.1523/JNEUROSCI.4368-15.2016. [DOI] [PMC free article] [PubMed] [Google Scholar]
- Khan U, Liu L, Provenzano FA, Berman DE, Profaci CP, Sloan R, Mayeux R, Duff KE, Small SA. Isolating the anatomical site and molecular drivers of entorhinal dysfunction in preclinical Alzheimer’s disease and mapping a pattern of cortical spread. Nat Neurosci. 2014;17:304–311. doi: 10.1038/nn.3606. [DOI] [PMC free article] [PubMed] [Google Scholar]
- Knierim JJ, Neunuebel JP, Deshmukh SS. Functional corrlates of the lateral and medial entorhinal cortex: objects, path integration and local-global reference frames. Philos Trans R Soc Lond B Biol Sci. 2014;369(1635):20130369. doi: 10.1098/rstb.2013.0369. [DOI] [PMC free article] [PubMed] [Google Scholar]
- Knierim JJ, Neunuebel JP. Tracking the flow of hippocampal computation: Pattern separation, pattern completion, and attractor dynamics. Neurobiol Learn Mem. 2016;129:38–49. doi: 10.1016/j.nlm.2015.10.008. [DOI] [PMC free article] [PubMed] [Google Scholar]
- Koh MT, Haberman RP, Foti S, McCown TJ, Gallagher M. Treatment strategies targeting excess hippocampal activity benefit aged rats with cognitive impairment. Neuropsychopharmacology. 2010;35:1016–25. doi: 10.1038/npp.2009.207. [DOI] [PMC free article] [PubMed] [Google Scholar]
- Lacy JW, Yassa MA, Stark SM, Muftuler LT, Stark CEL. Distinct pattern separation related transfer functions in human CA3/dentate and CA1 revealed using high-resolution fMRI and variable mnemonic similarity. Learn Mem. 2011;18:15–18. doi: 10.1101/lm.1971111. [DOI] [PMC free article] [PubMed] [Google Scholar]
- Maass A, Berron D, Libby LA, Ranganath C, Düzel E. Functional subregions of the human entorhinal cortex. eLife. 2015;4:e06426. doi: 10.7554/eLife.06426. [DOI] [PMC free article] [PubMed] [Google Scholar]
- Maurer AP, Johnson SA, Hernandez AR, Reasor J, Cossio DM, Fertal KE, Mizell JM, Lubke KN, Clark BJ, Burke SN. Age-related changes in lateral entorhinal and CA3 neuron allocation predict poor performance on object discrimination. Frontiers Sys Neurosci. 2017;11(49) doi: 10.3389/fnsys.2017.00049. [DOI] [PMC free article] [PubMed] [Google Scholar]
- McEchron MD, Weible AP, Disterhoft JF. Aging and learning-specific changes in single-neuron activity in CA1 hippocampus during rabbit trace eyeblink conditioning. Neurophysiology. 2001;86(4):1839–57. doi: 10.1152/jn.2001.86.4.1839. [DOI] [PubMed] [Google Scholar]
- Moser EI, Kropff E, Moser M-B. Place cells, grid cells, and the brain’s spatial representation system. Annu Rev Neurosci. 2008;31:69–89. doi: 10.1146/annurev.neuro.31.061307.090723. [DOI] [PubMed] [Google Scholar]
- Navarro Schröder TN, V Haak K, Jimenez NIZ, Beckmann CF, Doeller CF. Functional topography of the human entorhinal cortex. eLife. 2015;4:e06738. doi: 10.7554/eLife.06738. [DOI] [PMC free article] [PubMed] [Google Scholar]
- Olsen RK, Yeung L-K, Noly-Gandon A, D’Angelo MC, Kacollja A, Smith VM, Ryan JD, Barense MD. Human anterolateral entorhinal cortex volumes are associated with cognitive decline in aging prior to clinical diagnosis. Neurobio of Aging. 2017;57:195–205. doi: 10.1016/j.neurobiolaging.2017.04.025. [DOI] [PubMed] [Google Scholar]
- Pierce JW. PsychoPy – Psychophysics software in Python. J Neurosci Methods. 2007;162(1-2):8–13. doi: 10.1016/j.jneumeth.2006.11.017. [DOI] [PMC free article] [PubMed] [Google Scholar]
- Pierce JW. Generating stimuli for neuroscience using PsychoPy. Front Neuroinform. 2009;2:10. doi: 10.3389/neuro.11.010.2008. [DOI] [PMC free article] [PubMed] [Google Scholar]
- Poldrack RA, Mumford JA. Independence in ROI analysis: where is the voodoo? Soc Cog and Aff Neuroci. 2009;4(2):208–213. doi: 10.1093/scan/nsp011. [DOI] [PMC free article] [PubMed] [Google Scholar]
- Power JD, Barnes KA, Snyder AZ, Schlagger BL, Petersen SE. Spurious but systematic correlations in functional connectivity MRI networks arise from subject motion. NeuroImage. 2012;59(3):2142–2154. doi: 10.1016/j.neuroimage.2011.10.018. [DOI] [PMC free article] [PubMed] [Google Scholar]
- Reagh ZM, Yassa MA. Object and spatial mnemonic interference differentially engage lateral and medial entorhinal cortex in humans. PNAS. 2014;111:E4264–73. doi: 10.1073/pnas.1411250111. [DOI] [PMC free article] [PubMed] [Google Scholar]
- Reagh ZM, Yassa MA. Selective vulnerabilities and biomarkers in neurocognitive aging. F1000 Research. 2017;6:491. doi: 10.12688/f1000research.10652.1. F1000 Facuty Rev. [DOI] [PMC free article] [PubMed] [Google Scholar]
- Reagh ZM, Ho HD, Leal SL, Noche JA, Chun A, Murray EA, Yassa MA. Greater loss of object than spatial mnemonic discrimination in aged adults. Hippocampus. 2016;26(4):417–22. doi: 10.1002/hipo.22562. [DOI] [PMC free article] [PubMed] [Google Scholar]
- Reagh ZM, Roberts JM, Ly M, DiProspero N, Murray E, Yassa MA. Spatial discrimination deficits as a function of mnemonic interference in aged adults with and without memory impairment. Hippocampus. 2013;24(3):303–314. doi: 10.1002/hipo.22224. [DOI] [PMC free article] [PubMed] [Google Scholar]
- Robitsek J, Ratner MH, Stewart T, Eichenbaum H, Farb DH. Combined administration of levetiracetam and valproic acid attenuates age-related hyperactivity of CA3 place cells, reduces place field area, and increases spatial information content in aged rat hippocampus. Hippocampus. 2015;25:1541–55. doi: 10.1002/hipo.22474. [DOI] [PMC free article] [PubMed] [Google Scholar]
- Ryan L, Cardoza JA, Barense MD, Kawa KH, Wallentin-Flores J, Arnold WT, Alexander GE. Age-related impairment in a complex object discrimination task that engages perirhinal cortex. Hippocampus. 2012;22:1978–1989. doi: 10.1002/hipo.22069. [DOI] [PMC free article] [PubMed] [Google Scholar]
- Sanchez PE, Zhu L, Verret L, Vossel KA, Orr AG, Cirrito JR, Devidze N, Ho K, Yu GQ, Palop JJ, Mucke L. Leviteracetam suppresses neuronal network dysfunction and reverses synaptic and cognitive deficits in an Alzheimer’s disease model. PNAS. 2012;109(42):E2895–903. doi: 10.1073/pnas.1121081109. [DOI] [PMC free article] [PubMed] [Google Scholar]
- Schultz H, Sommer T, Peters J. Direct evidence for domain-sensitive functional subregions in human entorhinal cortex. J Neurosci. 2012;32:4716–4723. doi: 10.1523/JNEUROSCI.5126-11.2012. [DOI] [PMC free article] [PubMed] [Google Scholar]
- Šidák ZK. Rectangular confidence regions for the means of multivariate normal distributions. J American Stat Assoc. 1967;62(318):626–33. [Google Scholar]
- Smith TD, Adams MM, Gallagher M, Morrison JH, Rapp PR. Circuit-specific alterations in hippocampal synaptophysin immunoreactivity predict spatial learning impairment in aged rats. J Neurosci. 2000;20(17):6587–93. doi: 10.1523/JNEUROSCI.20-17-06587.2000. [DOI] [PMC free article] [PubMed] [Google Scholar]
- Stark CEL, Squire LR. When zero is not zero: The problem of ambiguous baseline conditions in fMRI. PNAS. 2001;98(22):12760–66. doi: 10.1073/pnas.221462998. [DOI] [PMC free article] [PubMed] [Google Scholar]
- Stark SM, Yassa MA, Lacy JW, Stark CEL. A task to assess behavioral pattern separation (BPS) in humans: Data from healthy aging and mild cognitive impairment. Neuropsychologia. 2014;51(12):2442–49. doi: 10.1016/j.neuropsychologia.2012.12.014. [DOI] [PMC free article] [PubMed] [Google Scholar]
- Stranahan AM, Mattson MP. Selective vulnerability of neurons in layer II of the entorhinal cortex during aging and Alzheimer’s Disease. Neural Plast. 2010;2010:108190. doi: 10.1155/2010/108190. [DOI] [PMC free article] [PubMed] [Google Scholar]
- Stranahan AM, Haberman RP, Gallagher M. Cognitive decline is associated with reduced reelin expression in the entorhinal cortex of aged rats. Cereb Cortex. 2011;21:392–400. doi: 10.1093/cercor/bhq106. [DOI] [PMC free article] [PubMed] [Google Scholar]
- Suzuki WA, Amaral DG. Topographic organization of the reciprocal connections between the monkey entorhinal cortex and the perirhinal and parahippocampal cortices. J Neurosci. 1994;14(3):1856–77. doi: 10.1523/JNEUROSCI.14-03-01856.1994. [DOI] [PMC free article] [PubMed] [Google Scholar]
- Thomé A, Gray DT, Erickson CA, Lipa P, Barnes CA. Memory impairment in aged primates is associated with region-specific network dysfunction. Mol Psych. 2016;21:1257–62. doi: 10.1038/mp.2015.160. [DOI] [PMC free article] [PubMed] [Google Scholar]
- Wang H, Suh JW, Das SR, Pluta JB, Craige C, Yushevich PA. Multi-atlas segmentation with joint label fusion. IEEE Trans Pattern Anal Mach Intell. 2013;35(3):611–23. doi: 10.1109/TPAMI.2012.143. [DOI] [PMC free article] [PubMed] [Google Scholar]
- Wilson IA, Ikonen S, Gallagher M, Eichenbaum H, Tanila H. Age-associated alterations of hippocampal place cells are subregion specific. J Neurosci. 2005;25(29):6877–86. doi: 10.1523/JNEUROSCI.1744-05.2005. [DOI] [PMC free article] [PubMed] [Google Scholar]
- Wisse LEM, Daugherty AM, Olsen RK, Berron D, Carr VA, Stark CEL, Amaral RSC, Amunts K, Augustinack JC, Bender AR, Bernstein JD, Boccardi M, Bocchetta M, Burggren A, Chakravarty MM, Chupin M, Ekstrom A, de Flores R, Insausti R, Kanel P, Kedo O, Kennedy KM, Kerchner GA, LaRocque KF, Liu X, Maass A, Malykhin N, Mueller SG, Ofen N, Palombo DJ, Parekh MB, Pluta JB, Pruessner JC, Raz N, Rodrigue KM, Schoemaker D, Shafer AT, Steve TA, Suthana N, Wang L, Winterburn JL, Yassa MA, Yushkevich PA, la Joie R. A harmonized segmentation protocol for hippocampal and parahippocampal regions: Why do we need one and what are the goals? Hippocampus. 2017;27(1):3–11. doi: 10.1002/hipo.22671. [DOI] [PMC free article] [PubMed] [Google Scholar]
- Yassa MA, Stark CEL. Pattern separation in the hippocampus. Trends Neurosci. 2011;34(10):515–25. doi: 10.1016/j.tins.2011.06.006. [DOI] [PMC free article] [PubMed] [Google Scholar]
- Yassa MA, Lacy JW, Stark SM, Albert MS, Gallagher M, Stark CEL. Pattern separation deficits associated with increased hippocampal CA3 and dentate gyrus activity in nondemented older adults. Hippocampus. 2010a;21(9):968–979. doi: 10.1002/hipo.20808. [DOI] [PMC free article] [PubMed] [Google Scholar]
- Yassa MA, Mattfeld AT, Stark SM, Stark CEL. Age-related memory deficits linked to circuit-specific disruptions in the hippocampus. PNAS. 2011;108:8873–78. doi: 10.1073/pnas.1101567108. [DOI] [PMC free article] [PubMed] [Google Scholar]
- Yassa MA, Muftuler LT, Stark CEL. Ultrahigh-resolution microstructural diffusion tensor imaging reveals perforant path degradation in aged humans in vivo. PNAS. 2010b;107(28):12687–91. doi: 10.1073/pnas.1002113107. [DOI] [PMC free article] [PubMed] [Google Scholar]
- Yeung L-K, Olsen RK, Bild-Enkin HEP, D’Angelo MC, Kacollja A, McQuiggan DA, Keshabyan A, Ryan JD, Barense MD. Anterolateral entorhinal cortex volume predicted by altered intra-item configural processing. J Neurosci. 2017;37(22):5527–38. doi: 10.1523/JNEUROSCI.3664-16.2017. [DOI] [PMC free article] [PubMed] [Google Scholar]
- Yushkevich, et al. Quantitative comparison of 21 protocols for labeling hippocampal subfields and parahippocampal subregions in in vivo MRI: towards a harmonized segmentation protocol. NeuroImage. 2015;111:526–541. doi: 10.1016/j.neuroimage.2015.01.004. [DOI] [PMC free article] [PubMed] [Google Scholar]
Associated Data
This section collects any data citations, data availability statements, or supplementary materials included in this article.