

Abstract
Translation is a critical process in protein synthesis, but translational regulation in antigen-specific T cells in vivo has not been well defined. Here we have characterized the translatome of virus-specific effector CD8+ T cells during acute LCMV infection of mice. Antigen-specific T cells exerted dynamic translational control of gene expression that correlated with cell proliferation and T cell antigen receptor (TCR) stimulation. Translation of mRNAs that encode translation machinery including ribosomal protein mRNAs was upregulated during the T cell expansion phase, followed by translational inhibition of these transcripts when the effector CD8+ T cells stopped dividing just prior to the contraction phase. This translational suppression was more pronounced in terminal effector cells compared to memory precursor cells, and was regulated by antigenic stimulation and mTOR signals. Our studies show that translational activity of transcripts encoding ribosomal proteins is regulated during effector CD8+ T cell differentiation and may play a role in fate decisions involved in the formation of memory cells.
CD8+ T cells play a crucial role in controlling intracellular infections and anti-tumor immunity. During acute infection, naive antigen-specific CD8+ T cells proliferate and differentiate into effector CD8+ T cells that eliminate the pathogen-infected cells1. The majority of these effector CD8+ T cells die after pathogen clearance, and then long-lived memory CD8+ T cell population is formed. The differentiation of effector and memory CD8+ T cells is accompanied by dynamic changes in the phenotype and function of antigen-specific CD8+ T cells, as revealed by genome-wide transcriptomic analyses2, 3. In addition, it is increasingly apparent that epigenetic regulation is significantly involved in effector and memory CD8+ T cell formation4, 5, 6, 7.
In addition to these transcriptional and epigenetic analyses, investigations into the post-transcriptional regulation of antigen-specific CD8+ T cell responses are required for a better understanding of the precise picture of cellular events that occur during effector and memory differentiation in these cells. Translation is a key target for post-transcriptional regulation as it is a critical process in protein synthesis from genetic information encoded in mRNAs8. The translational regulation of gene expression is involved in many cellular events, and its dysregulation can result in clinical manifestations, including cancer and mental disorders9, 10, 11. It is increasingly apparent that translation plays an important role in controlling both innate and adaptive immune responses12. Certain cytokine production in effector T cells (Teff cells) is translationally regulated13, 14, 15. Distinct translational signatures were found in Foxp3+ regulatory CD4+ T cells and Foxp3− CD4+ T cells16. Translation could also regulate the CD8+ T cell response during the antigen-triggered activation in physiological immune settings such as pathogen infections, vaccination and cancer because mTOR, a major regulator of translation17, plays an essential role in the differentiation of effector and memory CD8+ T cells18, 19. However, it has not been studied how translation of individual mRNAs is regulated in these activated CD8+ T cells, and it is unclear if translation activity is changed during the process of differentiation into effector and memory CD8+ T cells.
In this study we have examined the translational profiles and protein synthesis in CD8+ T cells isolated ex vivo during acute infection with lymphocytic choriomeningitis virus (LCMV) in mice. Genome-wide translational analyses indicated that expression of a group of genes encoding the translational machinery was dynamically regulated by translational mechanisms in activated CD8+ T cells. Furthermore, we found that antigenic stimulation as well as mTOR signals were involved in this translational regulation. Our studies provide a framework for understanding translational profiling of CD8+ T cells activated in vivo.
Results
Activated CD8+ T cells change their translational activity
To define how the translation of mRNA is regulated in activated CD8+ T cells during acute infection, we compared the translation profiles of naïve (Tn), effector (Teff) and memory (Tm) CD8+ T cells using P14 transgenic mice, which express a transgenic T cell receptor (TCR) specific for the H2-Db-restricted LCMV gp33 epitope. CD8+ Tn cells were isolated from spleen of uninfected P14 mice. To obtain Teff and Tm cells, we adoptively transferred naive CD45.1+ P14 CD8+ T cells into wild-type (CD45.2) mice, followed by infection with the Armstrong strain (Arm) of LCMV. As described previously20, LCMV Arm infection resulted in viral clearance at 8 days after infection and showed significant expansion of the population of antigen specific CD8+ T cells in the spleen, followed by the contraction phase (Fig. 1a). CD8+ Tn cells in spleen of uninfected P14 mice maintained a small cell size, did not proliferate and did not express the cytotoxic molecule granzyme B (Fig. 1b–d). On the other hand, CD8+ Teff cells isolated from spleen at day 5 post infection (D5 Teff cells hereafter) were larger in size (Fig. 1b) and were actively proliferating in response to viral antigens compared Tn cells (Fig. 1a and d). In addition, they expressed cytotoxic molecule granzyme B (Fig. 1c). On day 8 post-infection, at the peak of the CD8+ T cell response, the cell size of effector CD8+ T cells (D8 Teff cells hereafter) was comparable to that of naive CD8+ T cells (Fig. 1b), and they were not proliferating (Fig. 1d), but had high expression of granzyme B (Fig. 1c). After the contraction phase, CD8+ Tm P14 cells (> 30 days after infection) in spleen were small, did not take up BrdU, similar to Tn and D8 Teff cells, and expressed less granzyme B protein compared to D5 Teff and D8 Teff cells (Fig. 1b–d).
Figure 1. Activated CD8+ T cells change their translational activity.
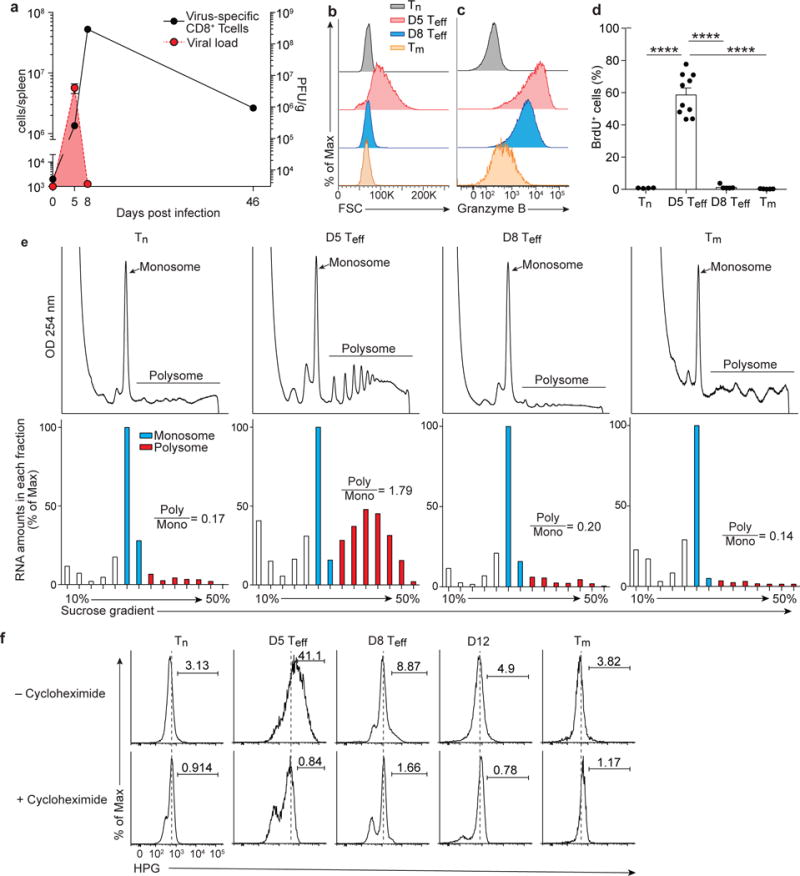
(a) Number of virus-specific P14 CD8+ T cells and viral titer in spleen of LCMV-infected mice in which P14 transgenic CD8+ T cells were adoptively transferred before infection. (b and c) Histograms showing cell size (forward scatter: FSC, b) and granzyme B expression (c) in P14 CD8+ T cells obtained from spleen of LCMV-infected mice. (d) BrdU+ P14 cells in spleen 2 hours after BrdU i.p. injection into LCMV-infected mice. (e) Sucrose ultracentrifugation showing polysome profiles (top) of purified P14 cells in spleen at the indicated time points. The amount of RNA (bottom) isolated from the sucrose gradients of the polysome profiles. The number showing ratio of the RNA amount of polysomes to that of monosomes (Poly/Mono). Signals observed in polysome fractions of the memory polysome profile data are noise due to much lower numbers of P14 cells. (f) Histograms showing HPG (homopropargylglycine) staining in P14 cells of splenocytes cultured with HPG for 2 hours in the presence or absence of cycloheximide. Naive P14 cells were obtained from uninfected P14 transgenic mice. Effector and memory P14 cells (40–60 days after infection) were obtained from LCMV-Arm infected mice in which naive P14 cells were adoptively transferred before infection. Data are representative of at least three independent experiments with samples pooled from 3–10 mice for each time point (a, e), or are representative of two independent experiments (n=3–6 mice per group) (b, c, f). Data in (d) were obtained from two independent experiments (n=4–10). Tn, D5 Teff, D8 Teff, and Tm indicate naive, day 5 effector, day 8 effector, and memory CD8+ T cells, respectively. Error bars are mean +/− s.e.m. ****p<0.0001 (one-way ANOVA).
We next examined the polysome profiles of Tn, D5 Teff, D8 Teff and Tm CD8+ T cells. CD8+ Tn cells, isolated from spleen of uninfected P14 transgenic mice and ultracentrifugated on a sucrose gradient, had a low polysome content compared to the monosome peak (Fig. 1e), confirmed by low amounts of RNA isolated from the polysome fractions compared to the monosome fraction in these cells (Fig. 1e,). These data suggest low translation activity in CD8+ Tn cells, consistent with the status of naive T cells as quiescent cells. In contrast to CD8+ Tn cells, CD8+ D5 Teff P14 cells, purified from spleen, showed multiple clear spikes in polysome fractions and a high amount of RNA in these fractions (Fig. 1e), indicating active mRNA translation during the clonal expansion phase. The polysome profile of P14 CD8+ D8 Teff cells, isolated from spleen at the peak of the T cell response (day 8 post-infection) were similar to those observed in Tn cells (Fig. 1e). These results suggest that activated CD8+ T cells down-regulate mRNA translation when they stop dividing, (at day 8 p.i). CD8+ Tm P14 cells, isolated from spleen at day 40–60 post infection, had a low polysome content (Fig. 1e), indicative of quiescent translation, and suggesting that mRNA translation in CD8+ T cells correlated with cell proliferation.
Next, we examined incorporation of L-homopropargylglycine (HPG)21, 22, a non-radioactive amino acid analog of methionine that can be measured by flow cytometry21, to assess protein synthesis in Tn, Teff and Tm CD8+ cells. Splenocytes were cultured for 2 hours at 37 °C with HPG, in the presence or absence of cycloheximide, an inhibitor of protein synthesis, used as control. In accordance with the polysome profiling data, very few Tn P14 cells incorporated HPG (Fig. 1f), indicating minimal protein synthesis. In contrast, at day 5 post-infection 40% of P14 Teff cells were HPG+ (Fig. 1f). At day 8 post-infection the frequency of HPG+ was much lower (<10%) among D8 Teff P14 cells compared to D5 Teff cells (Fig. 1f), and by day 12 post-infection the frequency of HPG+ in P14 cells became similar to that observed in Tn cells (Fig. 1f), indicating that active protein synthesis was transient. Low levels of HPG incorporation were also seen in Tm cells (Fig. 1f). Together, these results suggest that protein synthesis increased at day 5 p.i. in proliferating antigen-specific CD8+ T cells, followed by a rapid reduction of protein production concurrent with the peak of CD8+ T cell responses at day 8 p.i. as the cells stopped dividing.
Translational control of gene expression in CD8+ T cells is selective
To investigate the regulation of translation for mRNAs known to be expressed in activated CD8+ T cells, we examined the sedimentation of specific mRNAs across the fractions of a sucrose gradient. Tn CD8+ T cells were directly obtained from spleen of P14 transgenic mice, and Teff CD8+ P14 cells were isolated from spleen of LCMV Arm-infected mice, which P14 cells were adoptively transferred before infection. Translation of Ifng mRNA is known to be required for production of IFN-γ protein in in vitro activated T cells13, 14, 15. Ifng mRNA was transcriptionally up-regulated in both D5 and D8 Teff P14 cells compared to Tn P14 cells (Fig. 2a), as shown previously2, 3. In D5 Teff cells, Ifng mRNA was broadly distributed in the sedimentation gradient and about 40% of the total Ifng mRNA was located in polysome fractions, while only about 20% of Ifng mRNA was detected in polysome fractions in D8 Teff cells (Fig. 2b, c). It was previously shown that the peak of IFN-γ protein in serum and organ homogenates following LCMV infection occurs prior to day 8 p.i. and that CD8+ T cells are the main contributor of IFN-γ protein production23. We found that the amount of IFN-γ protein in serum peaked at day 5 post-LCMV infection and then significantly decreased by day 10 p.i. (Fig. 2d). Direct ex vivo intracellular cytokine staining showed that D5 Teff cells produced more IFN-γ protein compared to D8 Teff cells (Fig. 2e), consistent with the Ifng mRNA translation data and indicating the translation of Ifng mRNA was more active in proliferating activated D5 Teff cells compared to D8 Teff cells that stopped proliferating.
Figure 2. Translational activity of Ifng in effector CD8+ T cells is distinct from that of Tbx21.

(a, f) qRT-PCR data showing mRNA expression of Ifng (a) and Tbx21 (f) in total mRNA isolated from P14 cells in spleen. (b, c, g, h) qRT-PCR data showing the amount of Ifng (b) or Tbx21 (g) mRNA in fractions of sucrose gradient of P14 cell lysate, calculated as a percentage of the total in all fractions. The portion in polysome fractions, Ifng (c) or Tbx21 (h), *p<0.05 (unpaired t-test). (d) IFN-γ protein levels in serum after LCMV infection, *p<0.05, **p<0.01, ****p<0.0001 (one-way ANOVA). (e) Direct ex vivo intracellular cytokine staining (ICS) showing the frequency of IFN-γ+ cells in P14 cells of splenocytes harvested at days 5 and 8 after infection, **p<0.01 (unpaired t-test). Naive P14 cells were obtained from uninfected P14 transgenic mice. Effector P14 cells were obtained from LCMV-Arm infected mice in which naive P14 cells were adoptively transferred before infection. Data of mRNA distribution in the sucrose gradient are representative of 3 independent experiments with samples pooled from 3-10 mice per each time point (b and g). The mRNA levels in total mRNA (a and f) and polysome fractions (c and h) was calculated from the 3 independent experiments. Data of IFN-γ protein levels in serum (d) were obtained from two independent experiments (n=5–10 per each time point). n=6 per each time point for direct ex vivo ICS (e). Error bars are mean +/− s.e.m. Tn, D5 Teff, D8 Teff indicate naive, day 5 effector, and day 8 effector CD8+ P14 T cells, respectively.
We also examined the translation of Tbx21 mRNA, encoding the transcription factor T-bet. Tbx21 mRNA was induced in D5 and D8 Teff cells compared to Tn cells (Fig. 2f). However, in contrast to Ifng mRNA, there was no difference in translation of Tbx21 mRNA between D5 and D8 Teff cells (Fig. 2g, h) and about 80% of Tbx21 mRNA was detected in polysomes in both Teff cells (Fig. 2h), indicating that translation of Tbx21 mRNA was more efficient than that of Ifng and that translation of Tbx21 is distinctly regulated from that of Ifng in Teff cells.
Cd8a mRNA is constitutively expressed in CD8+ T cells through all activation and differentiation stages (Supplementary Fig. 1a). 50~70% of Cd8a mRNA was found in polysome fractions in all subsets of CD8+ T cells examined (Tn, D5 Teff, D8 Teff and Tm) (Supplementary Fig. 1a), indicating that translation of Cd8a mRNA was highly active in quiescent and activated CD8+ T cells, despite dynamic changes in overall translation status. Il7r mRNA, which encodes CD127 and is essential for memory T cell maintenance and Sell mRNA, encoding the lymph node homing receptor CD62L, were transcriptionally downregulated in D5 and D8 Teff cells compared to Tn cells, and re-expressed in Tm cells (Supplementary Fig. 1b). The amount of individual mRNAs in polysome fractions was indistinguishable between Tn and Tm cells (Supplementary Fig. 1b). Gzmb mRNA, which encodes the cytotoxic mediator gramzyme B, was transcriptionally increased in D5 Teff, D8 Teff, and Tm compared to Tn (Supplementary Fig. 1c). The amount of Gzmb mRNA in polysome fractions was similar and active in D5 Teff, D8 Teff and Tm cells (Supplementary Fig. 1c). Together, these results indicate the selective control of translation for distinct genes in activated CD8+ T cells, which can also be dynamically regulated depending on the effector CD8+ T cells status.
Translatome reveals translational program of effector CD8+ T cell differentiation
Next, to define the genome-wide control of translation in antigen specific CD8+ T cells after acute infection, we performed microarray analysis of polysome-associated mRNA isolated from splenic Tn, D5 Teff, and D8 Teff P14 cells after sucrose gradient ultracentrifugation12, as well as microarray analysis of total mRNA isolated from the same cells before sucrose gradient. To obtain basic information of translational control in antigen-specific CD8+ T cells, we plotted microarray expression values of individual genes in total mRNA against translation activity, which represents recruitment of mRNAs to polysome and was calculated by dividing expression values of polysome associated mRNA by those of total mRNA. In these analyses, four groups of genes (Fig. 3a, Supplementary Table 1–3) were determined: group I contained mRNAs with low expression and efficient recruitment to polysome, group II, low mRNA expression, inefficient recruitment to polysome, group III, high mRNA expression, efficient recruitment to polysome, and group IV, high mRNA expression, inefficient recruitment to polysome (Fig. 3a). Gene ontology analyses of these four groups of genes revealed that the pattern of translation activity of Tn and D8 Teff cells was relatively similar compared to that of D5 Teff cells (Fig. 3b). Genes with low expression but translated actively (group I) in Tn and D8 Teff cells were related to multiple biological processes, including cellular response to DNA damage and intracellular protein transport (Fig. 3b). On the other hand, genes in group IV (high mRNA expression but inefficient recruitment to polysome) were associated with mitochondrion organization, translation-ribosome, and oxidative phosphorylation. Particularly, translation activity of genes related to translation itself (translation-ribosome), which includes ribosomal protein mRNAs, was downregulated in D8 Teff compared to Tn and D5 Teff cells (Fig. 3b, Supplementary Tables 1–3).
Figure 3. Genome-wide translational activity in CD8+ T cells.

(a) Relationship between gene expression levels in total mRNA microarray data and translation activity, calculated by dividing expression values in polysome-associated mRNA microarray data by those in total mRNA microarray data. Red dot plots showing 4 groups of genes; I) low mRNA levels, efficient recruitment to polysome, II) low mRNA levels, inefficient recruitment to polysome, III) high mRNA levels, efficient recruitment to polysome, IV) high mRNA levels, inefficient recruitment to polysome. Tn, D5 Teff, and D8 Teff indicate naive, day 5 effector and day8 effector P14 CD8+ T cells. (b) Metascape analysis showing corresponding biological processes associated with genes in 4 groups categorized in (a). Effector P14 CD8+ T cells were purified from spleen of LCMV-infected mice, in which naive P14 cells were adoptively transferred before infection. Naive P14 cells were purified from uninfected P14 transgenic mice. Total RNA was isolated before sucrose gradient separation. Total RNA and polysome-associated RNA were analyzed by microarray. Data are from three independent experiments with samples pooled from 3-10 mice per each time point.
Although the above analyses provide basic information of translation activity in CD8+ Tn, D5 Teff, and D8 Teff cells, it was not clear whether and how translation activity of individual genes was changed when Tn cells differentiate into D5 and D8 Teff cells. To address this, the fold changes of gene expression of total mRNAs in D5 and D8 Teff cells relative to Tn cells were compared to those of polysome-associated mRNAs, and the relationship of the fold changes between total mRNAs and polysome-associated mRNAs was examined. We found a marked correlation of the fold changes between total mRNAs and polysome-associated mRNAs in D5 Teff cells relative Tn cells (Fig. 4a), indicating that transcriptional regulation was directly related to the amount of polysome-associated mRNAs and that the fold changes of majority of polysome-associated mRNAs could be explained by the increase or decrease of gene expression in total mRNA when Tn cells differentiate into D5 Teff cells. A similar strong correlation of the fold changes between total and polysome-associated mRNAs was observed in D8 Teff cells relative to Tn cells (Fig. 4a). Next, we examined the number of genes that were transcriptionally or translationally regulated. Compared to Tn cells, 1932 gene probes were transcriptionally upregulated, 1975 gene probes were downregulated and 12001 gene probes were unchanged in D5 Teff cells (Fig. 4b). Between 1 to 10% of genes in these three groups were identified as translationally regulated genes that were defined when fold changes of translation activity were significantly up- or down-regulated (<−1.5 fold change or >1.5 fold change) (Fig. 4b, Supplementary Table 4). Similar to D5 Teff cells, the proportion of translationally regulated genes in D8 Teff cells was in the range of about 1 to 10% (Fig 4b, Supplementary Table 4). When comparing the translationally regulated genes in D5 and D8 Teff cells relative to Tn,we found that the majority of genes were uniquely regulated in each Teff cell population (n=812 for D5 Teff, n=545 for D8 Teff, Fig. 4c), suggesting that mRNA translation was differentially and dynamically regulated between D5 and D8 Teff cells.
Figure 4. Translatome reveals translatinally regulated genes in CD8+ T cells.

(a) Microarray analysis showing correlation of the fold changes of gene expression of effector P14 CD8+ T cells relative to that of naive P14 CD8+ T cells in total mRNA (x-axis) and polysome-associated mRNA (y-axix), D5 Teff / Tn (top), D8 Teff / Tn (bottom). Pearson correlation r2 and p-values are shown.(b) Bar graphs showing the percentage of translationally regulated genes (fold change of translation activity; <−1.5 fold change or >1.5 fold change) among gene probes transcriptionally up-regulated (>2 fold change), down-regulated (<−2 fold change), or unchanged in effector P14 CD8+ T cells compared to naive P14 CD8+ T cells, D5 Teff / Tn (top), D8 Teff / Tn (bottom). The number of gene probes is shown next to the bars. (c) Venn diagram showing overlap of translationally regulated genes in day 5 effector and day 8 effector P14 CD8+ T cells compared to naive P14 cells identified in b. Tn, D5 Teff, D8 Teff indicate naive, day 5 effector, and day 8 effector CD8+ P14 T cells, respectively. Microarray data in Fig. 3 were used for this analysis.
To define the biological activity and/or the pathways regulated by translation, we used gene-set enrichment analysis (GSEA)24 to analyze the gene-expression of total mRNA and polysome-associated mRNA in Tn, D5 Teff and D8 Teff cells and compared the GSEA data of total mRNA with those of polysome-associated mRNA. This analysis indicated that compared to Tn, D5 Teff cells in total RNA upregulated substantial numbers of gene-sets related to cell proliferation and cell division including cell cycle, mitosis, DNA repair-DNA replication, RNA processing, transcription, splicing, DNA metabolism, tRNA aminoacylation and chromosome (Fig. 5a), and a comparable upregulation was observed in polysome-associated mRNA (Fig. 5a), indicating that the majority of these transcriptionally upregulated genes in D5 Teff cells were loaded on polysomes. In accordance with this notion, analysis of mRNAs responsible for enrichment of these proliferation-related gene sets by GSEA indicated a marked correlation of fold changes between total and polysome-associated mRNAs (Supplementary Fig. 2, Supplementary Table 5).
Figure 5. Translational regulation links to cellular activity during effector CD8+ T cell differentiation.

(a) Gene set enrichment analysis (GSEA) showing biological themes and pathways up- or down-regulated in total or polysome-associated RNA (Tn vs D5 Teff, Tn vs D8 Teff, and D5 Teff vs D8 Teff). Gene sets were obtained from Molecular Signatures Database (MSigDB); c2 canonical pathways, c5 gene ontology, and hallmark gene sets were combined. Mutually overlapping gene sets cluster together. Each row represents an individual gene set. Heat maps showing FDR values of GSEA data. (b) Classification of genes responsible for translationally downregulated-gene sets (ribosome/translation, biosynthetic process/translation initiation, panel (a)) in D8 Teff cells in comparison with either Tn or D5 Teff cells. (c) Corresponding gene ontology terms by metascape analysis for genes responsible for translational upregulation of the immune related gene set cluster in panel (a) in D8 Teff cells compared to D5 Teff cells. (d) Corresponding gene ontology terms for translationally up- or down-regulated genes identified from GSEA analysis using immune signature database (ImmuneSigDB) in D8 Teff cells compared to D5 Teff cells (see supplementary Fig. 3). Microarray data in Fig. 3 were used for this analysis. Tn, D5 Teff, D8 Teff indicate naive, day 5 effector, and day 8 effector CD8+ P14 T cells, respectively.
The gene-sets related to cell proliferation and division were also upregulated in both total and polysome-associated mRNA of D8 Teff cells compared to those of Tn cells (Fig. 5a). However, the number of gene sets upregulated in D8 Teff cells was substantially lower than that in D5 Teff cells (Fig. 5a), suggesting gene expression associated to cell proliferation and division was decreased in D8 Teff cells relative to D5 Teff cells, as indicated also by direct comparison of D8 Teff cells to D5 Teff cells by GSEA (Fig. 5a).
These analyses also revealed significant differences in enrichment by GSEA between total and polysome-associated mRNA. One noticeable difference was found in the ribosome-translation cluster, and gene sets related to this cluster were translationally downregulated in D8 Teff cells in comparison with Tn and D5 Teff cells (Fig. 5a). Furthermore, gene sets related to biosynthetic processes and translation initiation were translationally down-regulated in D8 Teff cells compared to D5 Teff cells (Fig. 5a). The significant differences in enrichment of the ribosome-translation cluster between total and polysome-associated mRNAs was mostly due to translational downregulation of cellular ribosomal proteins in D8 Teff cells compared to Tn and D5 Teff cells (Fig. 5b, Supplementary Table 6). Similarly, cellular ribosomal protein mRNAs were identified as translationally downregulated genes in the biosynthetic process and translation initiation cluster in D8 Teff compared to D5 Teff (Fig. 5b, Supplementary Table 6).
In addition, a substantial number of immune-related gene-sets were enriched in polysome-associated mRNA relative to total mRNA in D8 Teff cells (Fig. 5a), a wide variety of genes including transcription factors (Foxo3, Nfat5, Stat1, Stat5b), integrins (Itga1, Itgal, Itgax), and kinase or kinase-related molecules (Pik3ap1, Pik3cd, Pik3r1, Rictor) were identified as translationally upregulated genes in D8 Teff cells compared to D5 Teff cells (Supplementary Table 6). Based on metascape analysis, these genes belong to lymphocyte activation/positive regulation of immune system, intracellular signaling/kinase activity and cell adhesion/cell junction (Fig. 5c), suggesting that their translational upregulation might help maintain the cytotoxic activity of CD8+ D8 Teff cells.
To further investigate whether the translation of genes related to the immune responses was differentially regulated in D5 and D8 Teff cells, we performed GSEA using ImmuneSigDB, immunology-specific gene sets that can detect immunological gene signature25. We found that 150 out of 4872 ImmuneSigDB gene sets were translationally upregulated in D8 Teff cells compared to D5 Teff cells (Supplementary Fig. 3) and genes responsible for this enrichment could be categorized into several biological categories (Fig. 5d, Supplementary Table 6), including chromatin modification and DNA repair/regulation cell cycle. In addition, 60 gene sets that were translationally downregulated in D8 Teff cells compared to D5 Teff cells (Supplementary Fig. 3), including genes related to mitochondria, ribosome biogenesis/ribosome assembly and oxidative phosphorylation etc. (Fig. 5d). GSEA using ImmuneSigDB also revealed that the translation activity of genes related to ribosome/translation (mostly ribosomal protein mRNAs) was strikingly decreased in D8 Teff cells compared to D5 Teff cells (Fig. 5d, Supplementary Table 6). These results indicate that translation of mRNA is dynamically regulated in activated CD8+ Teff cells and that distinct translational program exists in CD8+ Teff cells at day 5, when cells are actively dividing and day 8, when cells have stop proliferating.
Dynamic translational regulation of ribosomal protein mRNA in CD8+ Teff cells
Next, to examine if most or only a fraction of mRNAs for cellular ribosomal protein were translationally regulated, we compared the fold changes of translation activity of all cellular ribosomal protein mRNAs to those of all mRNAs in the microarray data. Translation activity of ribosomal protein mRNAs between D5 Teff and Tn cells was modestly upregulated in D5 Teff cells compared to all mRNAs, while translation activity of ribosomal protein mRNAs in D8 Teff cells relative to Tn or D5 Teff showed significant downregulation compared to all mRNAs (Fig. 6a), indicating that the translation of most ribosomal protein mRNAs is suppressed at the peak of Teff response.
Figure 6. Translational inhibition of ribosomal protein mRNAs and 5′TOP mRNAs occurs in effector CD8+ T cells when the cells stopped dividing just before the contraction phase.

(a) Fold changes of translation activity of all ribosomal protein (RP) mRNAs in effector CD8+ T cells compared to all mRNAs in microarray data obtained in Fig. 3. μ and σ indicate mean and standard deviation, respectively. Fold changes of translation activity, D5 Teff relative to Tn (top), D8 Teff relative to Tn (middle), D8 Teff relative to D5 Teff (bottom). (b) qRT-PCR data showing the amount of Rpl29 mRNA in fractions of sucrose gradient of Tn, D5 Teff, and D8 Teff P14 cell lysate, calculated as a percentage of the total in all fractions. (c) Percentage of RP mRNAs in polysome fractions. (d) Fold changes of RP mRNA amount per cell in polysome fractions. (e) Percentage of 80S ribosomes- (monosome and polysome) free RP mRNAs. (f) Fold changes of translation activity of 5′TOP mRNAs except for RP mRNAs in effector CD8+ T cells. Microarray data in Fig. 3 were used for this analysis. In (b)-(e), Teff P14 cells were obtained from spleen of LCMV-infected mice, in which P14 transgenic CD8+ T cells were adoptively transferred before infection. Naive P14 cells were isolated from spleen of uninfected P14 transgenic mice. Data (b) are representative of three independent experiments with samples pooled from 3-10 mice per each group. The mean mRNA level in polysomes (c-e) was calculated from 3 independent experiments with samples pooled from 3-10 mice per each group. Error bars are mean +/− s.e.m. *p<0.05, **p<0.01, ***p<0.001, ****p<0.0001 (one-way ANOVA). Tn, D5 Teff, D8 Teff indicate naive, day 5 effector, and day 8 effector CD8+ P14 T cells, respectively.
To validate the microarray results, we examined the sedimentation of ribosomal protein mRNAs in sucrose gradient in CD8+ Tn, D5 Teff and D8 Teff P14 cells by qRT-PCR. Tn P14 cells were directly obtained from spleen of uninfected P14 transgenic mice while Teff P14 cells were isolated from spleen of LCMV Arm-infected mice in which P14 transgenic T cells were adoptively transferred before infection. About 20% of Rpl29 mRNAs, encoding ribosomal protein L29 and one of the components of the large subunit of ribosome, in Tn cells was located in the polysome fractions and there was a clear peak, about 40% of Rpl29, in the monosome fraction (Fig. 6b, c). In D5 Teff cells, a monosome peak became smaller but the amount of mRNA in polysome fractions was maintained or slightly higher compared to Tn cells (Fig. 6b, c). The amount of Rpl29 mRNA in polysome fractions was significantly decreased in D8 Teff cells compared to Tn and D5 Teff (Fig. 6b, c). In addition, all ribosomal protein mRNAs examined (Rpl13, Rpl32, Rps5, Rps6, Rps29) showed significant decrease in polysome fractions in D8 Teff cells compared to Tn and/or D5 Teff cells (Fig. 6c). The amount of mRNAs for ribosomal proteins in polysome fractions in Tn, D5 Teff, and D8 Teff cells was also examined in individual cells. Because the overall RNA content per cell is much higher in D5 Teff cells due to cell growth and proliferation, the amount of ribosomal protein mRNAs per cell in a D5 Teff cell increased relative to that of Tn and D5 Teff cell (Supplementary Fig, 4). Thus, a D5 Teff cell expressed significantly higher ribosomal protein mRNAs in polysome fractions per cell compared to Tn (Fig. 6d). On the other hand, the amount of ribosomal protein mRNA in polysome fractions per cell in D8 Teff cells decreased compared to both naive and day 5 effector CD8+ T cells (Fig. 6d). Importantly, Tn cells had a small amount (about 20%) of 80S ribosome-free ribosomal protein mRNAs, while >50% of ribosomal protein mRNAs were 80S ribosome-free in D8 Teff cells (Fig. 6b, e), indicating significant inhibition in translation of ribosomal protein mRNAs in D8 Teff cells.
Ribosomal protein mRNAs contain a 5′ terminal oligopyrimidine tract (5′TOP) sequence, which begins with cytosine and is followed by 4-15 pyrimidines, and this motif is involved in translational regulation via mTOR26, 27, 28, 29. Next, we asked whether other known 5′TOP mRNAs26 were also translationally regulated in D5 and D8 Teff cells. Compared to Tn cells, there was a modest upregulation of translation of other known 5′TOP mRNAs in D5 Teff cells, while their translation activity was substantially decreased in D8 Teff cells (Fig. 6f), similar to the translational regulation of ribosomal protein mRNAs. Taken together, these results indicate that translation of 5′TOP mRNAs including ribosomal protein mRNAs is significantly inhibited in Teff cells when the cells stopped dividing just before the contraction phase.
Distinct translation of ribosomal protein mRNA in CD8+ TTE and TMP cells
Antigen-specific effector CD8+ T cell population at day 8 post-infection contain CD127hi memory precursor T cells (TMP hereafter) that differentiate into long-lived CD8+ Tm cells, and CD127lo terminal effector CD8+ T cells (TTE hereafter), that mostly die during the contraction phase30, 31, 32. To examine if there were any differences in the translational regulation of ribosomal protein mRNAs between these two effector T cell subsets, at day 8 after infection we purified CD127hi and CD127lo antigen-specific CD8+ P14 T cells from spleen of LCMV Arm-infected mice in which P14 transgenic T cells were adoptively transferred (Supplementary Fig. 5a). CD127hi TMP cells had higher amounts of Rpl29 mRNA in the monosome fractions compared to CD127lo TTE (Fig 7a, b and Supplementary Fig. 5b). Similar observations were made for other ribosomal protein mRNAs (Rpl13, Rpl32, Rps5, Rps6, Rps29) (Fig. 7b). Although monosomes are often presumed to be translationally inactive, it was recently showed that the majority of monosomes actively contributed to translation33. Monosome-dependent translation of ribosomal protein mRNAs in TMP cells may be important for survival and generation of Tm cells from these cells. Together, these results indicate that translational suppression of ribosomal protein mRNAs is more pronounced in CD8+ TTE cells compared to CD8+ TMP cells.
Figure 7. More profound translational inhibition of ribosomal protein mRNAs in terminal effector cells compared to memory precursor cells.

(a) qRT-PCR data showing the amount of Rpl29 mRNA in fractions of sucrose gradient of CD127lo TTE and CD127hi TMP P14 cells obtained from spleen of day 8 LCMV infected mice. LCMV specific P14 transgenic CD8+ T cells were adoptively transferred into B6 mice, followed by LCMV Armstrong infection. (b) The portion of ribosomal protein mRNAs in monosome fractions. Horizontal doted lines indicating the average percentage of each gene in monosome fractions in naive CD8+ T cells (this was calculated from the data of Fig. 6). Data (a) are representative of six independent experiments with samples pooled from 3-5 mice per each group. Data in c were obtained from six independent experiments with samples pooled from 3-5 mice per each group. *p<0.05, **p<0.01, ***p<0.001 (unpaired t-test). TTE and TMP indicate terminal effector and memory precursor CD8+ T cells. (see also Supplementary Fig.6. for purification of CD127lo TTE and CD127hi TMP P14 cells and Cd8a mRNA amounts as a control.).
Antigen and mTOR regulate translation of ribosomal protein mRNA in CD8+ T cells
mTOR regulates effector and memory CD8+ T cell differentiation and plays an essential role in translation of 5′TOP mRNAs including ribosomal protein transcripts17, 18, 19, 26, 27, 28, 29. We next examined the effect of rapamycin, a specific inhibitor of mTOR, on the translation of ribosomal protein mRNAs in TMP cells. On day 8 p.i., rapamycin was injected into LCMV-infected mice in which transgenic P14 cells were adoptively transferred before infection, and CD127hi TMP P14 cells were purified 12 hours after rapamycin treatment and subjected to sucrose gradient ultracentrifugation (Supplementary Fig. 6a). There was no change in the amount of ribosomal protein mRNAs in monosome fractions between untreated and rapamycin-treated groups in TMP cells (data not shown), while rapamycin treatment decreased the amount of polysome-associated mRNAs for 5 out of the 6 ribosomal protein mRNAs tested in TMP cells (Supplementary Fig. 6b). Next, we examined the effect of rapamycin on translation of ribosomal protein mRNAs in antigen specific CD8+ T cells during the early activation. To obtain enough number of antigen-specific CD8+ T cells for sucrose gradient ultracentrifugation, P14 TCR transgenic mice were directly infected with LCMV Arm in the presence or absence of rapamycin treatment, and CD8+ T cells from these mice were purified 24 hours post-infection (Supplementary Fig. 6c). Rapamycin treatment significantly decreased the amount of Rpl13, Rpl32 and Rps5 mRNAs in polysome fractions, and Rpl29 and Rps6 mRNAs were also reduced, and showed a marginal trend toward significance (Supplementary Fig. 6d), indicating that mTOR signals regulates translation of ribosomal protein mRNAs in antigen specific CD8+ T cells in vivo.
To examine whether antigenic stimulation might be involved in translational regulation in activated CD8+ T cells, mice, in which naive P14 cells were adoptively transferred, were infected with LCMV clone13 strain, which causes a chronic infection34; in this model, persistent antigen continuously stimulate antigen-specific CD8+ T cells, and activated Teff cells gradually differentiate into exhausted T cells. P14 CD8+ T cells were isolated during acute phase (day 8) of LCMV clone 13 infection when these CD8+ T cells were still effector. As a control, Teff P14 cells were isolated from LCMV Arm-infected mice at day 8 post-infection when virus was cleared, thereby no antigenic stimulation. Sedimentation of ribosomal protein mRNAs in theses cells indicated distinct translational regulation of ribosomal protein mRNAs between LCMV clone 13 and Armstrong (Fig. 8a, b and Supplementary Fig. 7a, b). P14 D8 Teff cells isolated from clone13-infected mice had higher amounts of Rpl29, Rpl13, Rpl32, Rps5, Rps6, Rps29 mRNAs in polysome fractions compared to Arms-infected mice (Fig. 8a, b). Higher amounts of ribosomal protein mRNAs in polysome fractions were also evident on a per-cell basis in D8 Teff cells isolated from clone13-compared to Arm-infected mice (Supplementary Fig 7b). Taken together, these results indicate that mTOR signals and antigenic stimulation plays an important role in the translational regulation of ribosomal protein mRNAs in CD8+ T cells18, 19.
Figure 8. Antigen stimulation contributes to translational regulation of ribosomal protein mRNAs in virus-specific CD8+ T cells.
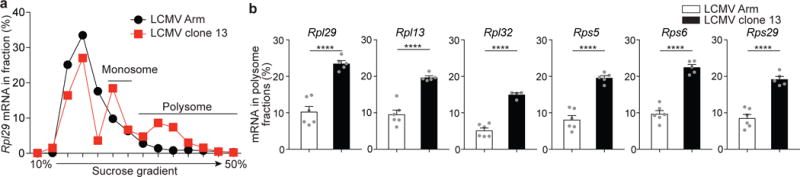
(a) qRT-PCR data showing mRNA amount of Rpl29 in sucrose gradient fractions of Teff P14 CD8+ T cells obtained from spleen of either LCMV Arm- or LCMV clone 13-infected mice at day 8 post-infection. P14 cells were adoptively transferred before infection.
(b) The portion of ribosomal protein mRNAs in polysome fractions of D8 Teff P14 cells obtained from spleen. Data (a) are representative of 5-6 independent experiments with samples pooled from 3-5 mice per each group. Data (b) were obtained from 5-6 independent experiments with samples pooled from 3-5 mice per each group. Error bars are mean +/− s.e.m. ****p<0.0001 (unpaired t-test).
Discussion
Here we found that the extent of overall translation in activated CD8+ T cells strongly correlated with cell proliferation status and was dependent on TCR stimulation. We observed the selective translational control of gene expression in activated CD8+ T cells. Translation of genes such as Tbx21, Cd8a, Il7r, Sell and Gzmb was efficient throughout the course of CD8+ T cell responses, while translation of Ifng was dynamically altered during Teff cell responses. The translation of mRNAs encoding ribosomal proteins was upregulated in activated CD8+ T cells during the clonal expansion phase, likely to help production of higher amount of proteins in proliferating cells, followed by striking downregulation of translation of these genes in D8 Teff cells, at the peak of the anti-viral response, even below levels found in naive T cells.
While both Tn and D8 Teff cells were not dividing, translational suppression of ribosomal protein mRNAs was evident in D8 Teff cells. The peak of the Teff cell response represents a turning point of metabolic reprogramming to shift from anabolic processes and rapid cell division to catabolic processes and arrest in cell proliferation accompanied by massive cell death. Thus, cellular events that trigger this Teff death might result in the translational suppression of ribosomal protein mRNAs. Alternatively, translational suppression of ribosomal protein mRNAs might contribute to induction of cell death by limiting the availability of ribosomes to synthesize proteins in Teff cells.
Tn and TMP cells had high amounts of monosome-associated ribosomal protein mRNAs but translational activity of ribosomal protein mRNAs was distinct between these cells. In particular, the amount of ribosomal protein mRNAs in polysome fractions in TMP cells was substantially lower compared to Tn cells. mTOR may be involved in the translational regulation of ribosomal protein mRNAs. mTOR has two distinct complexes, mTORC1 and mTORC217. mTORC1 promotes translation of 5′TOP mRNAs that include ribosomal protein transcripts26, 27, 28, 29 and our data showed that known 5′TOP mRNAs were translationally suppressed in D8 Teff cells, consistent with mTORC1-mediated inhibition of translation. Furthermore, D8 Teff cells showed translational downregulation of genes encoding mitochondria-related proteins, whose translation is at least partly regulated by mTORC135, 36, 37, 38. Thus, our results indicate that inhibition of translation in D8 Teff cells might be dependent on mTORC1 signals. Indeed, rapamycin treatment reduced ribosomal protein mRNAs from polysome fractions in antigen specific CD8+ T cells without changing the amount of monosome-associated ribosomal protein mRNAs. Because inhibition of mTORC1 by rapamycin or RNAi promotes Tm cell formation18, 19, polysome-dependent translation of ribosomal protein mRNAs could contribute to Tm cell differentiation. An important question is whether and how polysome-dependent translation regulates effector and memory differentiation. Inhibiting mTORC2 signals enhances generation of CD8+ Tm cells39, 40. Since mTORC2 can be activated through the interaction with ribosomes41, the inhibition of polysome-dependent translation of ribosomal protein mRNAs in D8 Teff cells may lead to limited mTORC2 activity that could have impact on Tm cell differentiation. Thus, it will be important to investigate the possible interplay between mTORC1 and mTORC2 during CD8+ Tm cell differentiation.
Transcriptional downregulation of a group of ribosomal protein mRNAs was previously reported in exhausted CD8+ T cells that arose after chronic infection2. Recently, two distinct subsets of virus-specific CD8+ T cells were identified during chronic infection: Tim3+ TCF1− PD1+ terminally-differentiated exhausted CD8+ T cells and Tim3− TCF1+ PD1+ CD8+ T cells with stem-cell like properties42, 43, 44, 45, 46. Ribosomal protein mRNAs was significantly downregulated in Tim3+ TCF1− PD1+ CD8+ T cells compared to Tim3+ TCF1− PD1+ stem-cell like CD8+ T cells42, 43, 46. In addition, similar transcriptional inhibition of a large number of ribosomal protein mRNAs was seen in CD8+ Tm cells repeatedly stimulated with multiple rounds of acute infection47. A common feature between Tim3+ TCF1− PD1+ exhausted T cells and repeatedly-stimulated Tm cells is the poor proliferative capacity. Because protein synthesis is a key process for T cell proliferation, it seems that transcriptional downregulation of ribosomal protein mRNAs plays a major role in the limited proliferative responses of these CD8+ T cells. Similarly, D8 Teff cells exhibit minimal proliferative capacity compared to Tn and primary Tm cells3. Thus, translational downregulation of ribosomal protein mRNAs in D8 Teff cells might also contribute to poor proliferative responses.
We showed that antigen stimulation and mTOR signals were involved in translational regulation of ribosomal protein mRNAs in CD8+ T cells. However, translation can be also regulated by other factors. IL-7 might have a role in translational control in CD8+ T cells. Tn cells and TMP cells express CD127 (the IL-7 receptor), while TTE cells lose CD127 expression. Our data show that the amount of monosome-associated ribosomal protein mRNAs is positively correlated with the expression levels of CD127 when T cells are not stimulated with antigen. In addition, IL-2 might be involved in translational regulation. IL-2 has an essential role in Teff and Tm cell differentiation48. IL-2Rα was transcriptionally upregulated in D5 Teff cells in our microarray data, and this increased expression of IL-2Rα was concurrent with the higher amount of polysomes. Furthermore, we found transcriptional increase of multiple inhibitory receptors including PD-1, Tim3 and 2B4 in D5 and D8 Teff cells. Thus, once antigenic TCR stimulation is lost due to viral clearance, these inhibitory receptors might contribute to translational suppression in D8 Teff cells. Thus, it will be interesting to examine if such cytokine signals and inhibitory receptors regulate translation in CD8+ T cells.
In the past two decades, there has been considerable progress to understand transcriptional program of CD8+ Tm cell formation, but little was known about translational regulation in antigen specific CD8+ T cells. Our study provides a framework for understanding translational control of gene expression when antigen-specific CD8+ T cells are activated in vivo.
Online Methods
Mice, viral infection, viral titration, and measurement of serum IFN-γ
Six- to twelve-week old female C57BL/6j (B6) mice were purchased from Jackson laboratories. CD45.1+ or Thy1.1+ P14 transgenic mice that have TCR transgene specific for GP33 epitope were maintained in our animal facility. 1-2 × 10⁴ P14 cells were adoptively transferred into B6 mice, followed by infection with LCMV Armstrong strain (2 × 10⁵ PFU, intraperitoneally). For early activation experiments (Supplementary Fig. 6c, d), P14 transgenic mice were directly infected with LCMV Armstrong strain (2 × 10⁶ PFU, intravenously). For LCMV clone 13 strain infection, mice that received 2 × 10³ P14 cells were intravenously infected with clone 13 (2 × 10⁶ PFU). Viral titers in spleen were measured by plaque assay as described previously34. Serum IFN-γ was measured by CBA kit (BD) according to manufacturer’s instruction. All animal experiments were approved by the Institutional Animal Care and Use Committee of Emory University.
BrdU labeling and detection
BrdU (1 mg/mouse, Sigma) was intraperitoneally injected into mice, and spleens were harvested from the mice 2 hours after BrdU injection. To examine cell proliferation, BrdU incorporation was measured in P14 cells by BrdU flow kit (BD, catalog#559619).
Polysome profiles
Polysome profiles were analyzed as described previously49. Briefly, to analyze polysome profiles, P14 cells were purified from spleen. To obtain naive P14 cells, single cell suspension of spleens from uninfected P14 transgenic mice was stained with APC-conjugated anti-CD8a antibody, and then CD8+ T cells were isolated by CD8a+ isolation kit (Miltenyi Biotech). These CD8+ T cells were further purified by anti-APC MicroBeads (Miltenyi Biotech). For purification of day 5 effector, day 8 effector, and memory P14 cells, single cell suspension of spleens from LCMV-infected mice (B6, CD45.2) in which P14 cells (CD45.1) were adoptively transferred were stained with biotin-conjugated anti-CD45.2, biotin-conjugated anti-Ly6G, and APC-conjugated anti-CD45.1 antibodies. P14 cells were enriched by removing recipient (B6 mice) cells with anti-biotin MicroBeads (Miltenyi Biotech), and then further purification was performed by anti-APC MicroBeads (Miltenyi Biotech). For purification of CD127High or CD127Low day 8 effector, single cell suspension of spleens from LCMV-infected mice (B6, Thy-1.2) in which P14 cells (Thy-1.1) were adoptively transferred were stained with biotin-conjugated anti-CD127 and APC-conjugated anti-Thy1.1 antibodies. P14 cells were purified with Anti-APC MultiSort Kit (Miltenyi Biotech), and then further purification was performed by anti-Biotin MicroBeads (Miltenyi Biotech). Dead cells were removed after purification by percoll density centrifugation. Cycloheximide (100 μg/ml, Sigma) were added in all buffers used during this purification process. Purified P14 cells (>90-95% purity) were lysed, and 10% of lysates were used for total RNA analyses and 90% of the rest of cell lysetes were loaded onto 10%-50% sucrose gradient, followed by ultracentrifugation as described previously. After ultracentrifugation, sucrose gradient was fractionated from the top of the tube. During fractionation, the absorbance was monitored using UV-detector with 254 nm filter. RNA was isolated from individual fractions using Trizol reagent (Life Technologies). For quantification of RNA, Ribogreen RNA assay kit (Life Technologies) was used, and RNA concentration was determined by NanoDrop 3300 fluorospectrometer.
Protein synthesis assay
Single cell suspension of splenocytes were incubated for 30 min at 37 °C in methionine-free RPMI 1640 medium (Life Technologies) containing 10% dialyzed FBS (Life Technologies), and then were further cultured for 2 hours at 37 °C in the presence of HPG (final concentration 100 μM, Life Technologies). Cycloheximide (final concentration 100 μg/ml) was added for negative control. HPG incorporation in P14 cells was stained with Click-iT Plus Alexa Fluor 488 Picolyl Azide Toolkit (Life Technologies) and was detected by flow cytometry.
qRT-PCR
Total RNA was isolated from P14 cell lysate before sucrose gradient by Trizol reagent. 18s rRNA was used as an internal control of gene expression for total RNA. To examine the sedimentation of mRNAs across the fractions of a sucrose gradient, a standard protocol was applied as described previously28. Briefly, 10 pg of luciferase mRNA was added to individual fractions of sucrose gradient for normalization and then RNA was extracted by Trizol reagent. Primers used in this study for qRT-PCR were QuantiTect primers purchased from Qiagen except for luciferase primers. The followings are sequences for luciferase primers: forward; 5′-GAGATACGCCCTGGTTCCTG-3′, reverse; 5′-ATAAATAACGCGCCCAACAC-3′. qRT-PCR was carried out by QuantiFast SYBR Green RT-PCR Kit (Qiagen). Values of gene expression determined by qRT-PCR in individual fractions of sucrose gradient were normalized to luciferase quantity, and then distribution of the gene expression in the gradient was plotted. To examine relative copy numbers of ribosomal protein mRNAs, RNA amount per cell was calculated. Briefly, 10 pg of luciferase mRNA was added to cell lysates before total RNA isolation for normalization, and then RNA was extracted by Trizol reagent. RNA extraction efficiency was calculated by qRT-PCR of luciferase mRNA, and RNA amount per cell was determined from RNA extraction efficiency, RNA concentration, and initial cell number. qRT-PCR for ribosomal protein mRNAs was performed using 200 pg of total RNA, and relative copy numbers of these mRNAs per cell was calculated from qRT-PCR data and RNA amount per cell.
Translatome analysis
Total RNA and polysome-associated RNA (3 or more ribosomes) from purified P14 cells were isolated by Trizol, and then were treated with DNase, followed by RNA purification with column. Three biological replicates for total and polysome-associated RNA of each time point (naive, day 5 effector, and day 8 effector) were prepared. Amplified cDNAs were generated from these total and polysome-associated RNA samples using Ovation Pico WTA System V2 (Nugen), and were hybridized on mouse 430.2 Affymetrix microarray chips at Dana-Farber Cancer Institute. Prior to analysis, microarray data were preprocessed and normalized with robust multichip averaging in GenePattern (Broad Institute). Microarray data are available at GEO database (GEO accession code: GSE71643). To determine the pattern of translation in naive, day 5, and day 8 effector CD8+ P14 cells, expression values in total mRNA microarray data and translation activity were plotted in Fig. 3a. Translation activity was calculated by dividing expression values in polysome-associated mRNA microarray data by those in total mRNA microarray data. High or low expression levels of genes in total mRNA (x-axis) were defined using z-score cut-off of +/−1. To determine significant difference in translation activity, we used a cut off of p-value<0.05, FDR<0.05, and translation activity values +/−1.5. 4 groups of genes were determined; I) low mRNA levels, efficient recruitment to polysome, II) low mRNA levels, inefficient recruitment to polysome, III) high mRNA levels, efficient recruitment to polysome, IV) high mRNA levels, inefficient recruitment to polysome. To define transcirptionally up- or down-regulated genes (Fig, 4b), we used a cut off of p-value<0.05, FDR<0.05, and fold-changes of expression values >2. GSEA analysis was performed in GenePattern24. Gene-sets used for GSEA analysis in Fig. 5a was generated by combining three gene set groups (c2 canonical pathways, c5 GO, and hallmark gene-sets) obtained from GSEA Molecular Signatures Database. Gene-sets used in Fig 5d and Supplementary Fig. 3 were c7 ImmuneSigDB from GSEA Molecular Signatures Database. In these GSEA analyses, we used a cut off of FDR<0.01 and p<0.001. Mutually overlapping gene-sets in GSEA data were clustered together using Enrichment Map and Auto Annotate programs on a Cytoscape software50. These gene-set cluster data made in Cytoscape were further visualized with a heat map in which FDR values were plotted. Translationally regulated gene sets were determined when FDR values of GSEA data in polysome-associated RNA were less than 1/100 compared to those in total RNA. To identify genes responsible for translational regulation of gene set enrichment, we determined leading-edge genes in translationally regulated gene sets of polysome-associated RNA microarray data. The leading-edge genes are a core group of genes essential for the gene set enrichment signal. From these leading-edge genes, translationally regulated genes were further extracted. Translationally regulated genes were defined as below. First, translational activity for each gene was calculated as (polysome-associated RNA microarray expression value)/(total RNA microarray expression value). Second, values of the translation activity from biological replicates were averaged, and then fold changes of translation activity was calculated between two different stages of CD8+ T cells (e.g. naive versus day 8 effector). Third, p-values of translation activity between two different stages were determined by a two-tailed Student’s t test, and then FDR was calculated by qvalue program in R software. Finally, we used a cut off of p-value<0.05, FDR<0.15, and fold-changes of translation activity>1.5 as a translationally regulated gene. In Fig. 3 and Fig. 5c, d, the translationally regulated genes were further analyzed by Metascape (http://metascape.org/gp/index.html#/main/step1) to determine gene ontology categories overrepresented in a set of genes51.
Rapamycin administration
Rapamycin was intraperitoneally injected to mice. As previously published, 600 μg/kg of rapamycin was administered at day 8 after infection (Supplementary Fig. 6a, b), and 75 μg/kg of rapamycin was injected 12 hours before and after infection (Supplementary Fig. 6c, d)18.
Flow cytometry
Flow cytometric analyses were performed with LSR II or Canto II (BD Biosciences). Single cell suspensions of spleen cells and PBMCs were prepared, and cell surface staining were carried out as shown previously20. The following antibodies were purchased from BD Biosciences; anti-CD8a (53-6.7), anti-IFN-γ (XMG1.2), and isotype (R3-34) control for IFN-γ. Anti-KLRG1 (2F1) antibody was purchased from SouthernBiotech. Anti-CD127 (A7R34) antibody was purchased from eBioscience. Anti-CD45.1 (A20), anti-CD45.2 (104), anti-Thy-1.1 (OX-7) and anti-Ly6G (1A8) antibodies were purchased from Biolegend. For direct ex vivo intracellular IFN-g staining, cell surface staining of spleen cells was performed to detect P14 cells, and then spleen cells were stained with anti-IFN-g antibody after permeabilization. Isotype control antibody for IFN-g was used to determine the background.
Statistical analysis
P-values were determined by a two-tailed unpaired or paired Student’s t test for comparison of two groups. To compare three or more groups, one-way ANOVA was used to calculate p-values. Pearson correlation analysis was performed in Fig. 4a and Supplementary Fig. 2. Statistical values in GSEA and Metascape were calculated in individual programs.
Supplementary Material
Acknowledgments
This study is supported by grants from NIH R01 AI030048 to R.A. and the Mérieux Foundation to R.A.
Footnotes
Data availability
The data that support the findings of this study are available from the corresponding author upon request.
Accession codes
Microarray data: GEO accession code, GSE71643
Author Contributions
K.A. and R.A. designed the experiments. K.A., H.T.K., and R.A. analyzed the data. K.A., A.G.B., and B.T.K. performed the experiments. M.M. and N.S. provided critical guidance to perform the experiments. K.A. and R.A. wrote the paper.
Competing financial interests
The authors declare no competing financial interests.
References
- 1.Kaech SM, Cui W. Transcriptional control of effector and memory CD8+ T cell differentiation. Nature reviews Immunology. 2012;12(11):749–761. doi: 10.1038/nri3307. [DOI] [PMC free article] [PubMed] [Google Scholar]
- 2.Wherry EJ, Ha SJ, Kaech SM, Haining WN, Sarkar S, Kalia V, et al. Molecular signature of CD8+ T cell exhaustion during chronic viral infection. Immunity. 2007;27(4):670–684. doi: 10.1016/j.immuni.2007.09.006. [DOI] [PubMed] [Google Scholar]
- 3.Kaech SM, Hemby S, Kersh E, Ahmed R. Molecular and functional profiling of memory CD8 T cell differentiation. Cell. 2002;111(6):837–851. doi: 10.1016/s0092-8674(02)01139-x. [DOI] [PubMed] [Google Scholar]
- 4.Russ BE, Olshanksy M, Smallwood HS, Li J, Denton AE, Prier JE, et al. Distinct epigenetic signatures delineate transcriptional programs during virus-specific CD8(+) T cell differentiation. Immunity. 2014;41(5):853–865. doi: 10.1016/j.immuni.2014.11.001. [DOI] [PMC free article] [PubMed] [Google Scholar]
- 5.Shin HM, Kapoor VN, Guan T, Kaech SM, Welsh RM, Berg LJ. Epigenetic modifications induced by Blimp-1 Regulate CD8(+) T cell memory progression during acute virus infection. Immunity. 2013;39(4):661–675. doi: 10.1016/j.immuni.2013.08.032. [DOI] [PMC free article] [PubMed] [Google Scholar]
- 6.Scharer CD, Barwick BG, Youngblood BA, Ahmed R, Boss JM. Global DNA methylation remodeling accompanies CD8 T cell effector function. Journal of immunology. 2013;191(6):3419–3429. doi: 10.4049/jimmunol.1301395. [DOI] [PMC free article] [PubMed] [Google Scholar]
- 7.Youngblood B, Oestreich KJ, Ha SJ, Duraiswamy J, Akondy RS, West EE, et al. Chronic virus infection enforces demethylation of the locus that encodes PD-1 in antigen-specific CD8(+) T cells. Immunity. 2011;35(3):400–412. doi: 10.1016/j.immuni.2011.06.015. [DOI] [PMC free article] [PubMed] [Google Scholar]
- 8.Sonenberg N, Hinnebusch AG. Regulation of translation initiation in eukaryotes: mechanisms and biological targets. Cell. 2009;136(4):731–745. doi: 10.1016/j.cell.2009.01.042. [DOI] [PMC free article] [PubMed] [Google Scholar]
- 9.Bhat M, Robichaud N, Hulea L, Sonenberg N, Pelletier J, Topisirovic I. Targeting the translation machinery in cancer. Nature reviews Drug discovery. 2015;14(4):261–278. doi: 10.1038/nrd4505. [DOI] [PubMed] [Google Scholar]
- 10.Santini E, Klann E. Reciprocal signaling between translational control pathways and synaptic proteins in autism spectrum disorders. Science signaling. 2014;7(349):re10. doi: 10.1126/scisignal.2005832. [DOI] [PMC free article] [PubMed] [Google Scholar]
- 11.Silvera D, Formenti SC, Schneider RJ. Translational control in cancer. Nature reviews Cancer. 2010;10(4):254–266. doi: 10.1038/nrc2824. [DOI] [PubMed] [Google Scholar]
- 12.Piccirillo CA, Bjur E, Topisirovic I, Sonenberg N, Larsson O. Translational control of immune responses: from transcripts to translatomes. Nature immunology. 2014;15(6):503–511. doi: 10.1038/ni.2891. [DOI] [PubMed] [Google Scholar]
- 13.Chang CH, Curtis JD, Maggi LB, Jr, Faubert B, Villarino AV, O’Sullivan D, et al. Posttranscriptional control of T cell effector function by aerobic glycolysis. Cell. 2013;153(6):1239–1251. doi: 10.1016/j.cell.2013.05.016. [DOI] [PMC free article] [PubMed] [Google Scholar]
- 14.Blagih J, Coulombe F, Vincent EE, Dupuy F, Galicia-Vazquez G, Yurchenko E, et al. The energy sensor AMPK regulates T cell metabolic adaptation and effector responses in vivo. Immunity. 2015;42(1):41–54. doi: 10.1016/j.immuni.2014.12.030. [DOI] [PubMed] [Google Scholar]
- 15.Scheu S, Stetson DB, Reinhardt RL, Leber JH, Mohrs M, Locksley RM. Activation of the integrated stress response during T helper cell differentiation. Nature immunology. 2006;7(6):644–651. doi: 10.1038/ni1338. [DOI] [PubMed] [Google Scholar]
- 16.Bjur E, Larsson O, Yurchenko E, Zheng L, Gandin V, Topisirovic I, et al. Distinct translational control in CD4+ T cell subsets. PLoS genetics. 2013;9(5):e1003494. doi: 10.1371/journal.pgen.1003494. [DOI] [PMC free article] [PubMed] [Google Scholar]
- 17.Zoncu R, Efeyan A, Sabatini DM. mTOR: from growth signal integration to cancer, diabetes and ageing. Nature reviews Molecular cell biology. 2011;12(1):21–35. doi: 10.1038/nrm3025. [DOI] [PMC free article] [PubMed] [Google Scholar]
- 18.Araki K, Turner AP, Shaffer VO, Gangappa S, Keller SA, Bachmann MF, et al. mTOR regulates memory CD8 T-cell differentiation. Nature. 2009;460(7251):108–112. doi: 10.1038/nature08155. [DOI] [PMC free article] [PubMed] [Google Scholar]
- 19.Pearce EL, Walsh MC, Cejas PJ, Harms GM, Shen H, Wang LS, et al. Enhancing CD8 T-cell memory by modulating fatty acid metabolism. Nature. 2009;460(7251):103–107. doi: 10.1038/nature08097. [DOI] [PMC free article] [PubMed] [Google Scholar]
- 20.Wherry EJ, Teichgraber V, Becker TC, Masopust D, Kaech SM, Antia R, et al. Lineage relationship and protective immunity of memory CD8 T cell subsets. Nature immunology. 2003;4(3):225–234. doi: 10.1038/ni889. [DOI] [PubMed] [Google Scholar]
- 21.Signer RA, Magee JA, Salic A, Morrison SJ. Haematopoietic stem cells require a highly regulated protein synthesis rate. Nature. 2014;509(7498):49–54. doi: 10.1038/nature13035. [DOI] [PMC free article] [PubMed] [Google Scholar]
- 22.Narita M, Young AR, Arakawa S, Samarajiwa SA, Nakashima T, Yoshida S, et al. Spatial coupling of mTOR and autophagy augments secretory phenotypes. Science. 2011;332(6032):966–970. doi: 10.1126/science.1205407. [DOI] [PMC free article] [PubMed] [Google Scholar]
- 23.Pien GC, Nguyen KB, Malmgaard L, Satoskar AR, Biron CA. A unique mechanism for innate cytokine promotion of T cell responses to viral infections. Journal of immunology. 2002;169(10):5827–5837. doi: 10.4049/jimmunol.169.10.5827. [DOI] [PubMed] [Google Scholar]
- 24.Subramanian A, Tamayo P, Mootha VK, Mukherjee S, Ebert BL, Gillette MA, et al. Gene set enrichment analysis: a knowledge-based approach for interpreting genome-wide expression profiles. Proceedings of the National Academy of Sciences of the United States of America. 2005;102(43):15545–15550. doi: 10.1073/pnas.0506580102. [DOI] [PMC free article] [PubMed] [Google Scholar]
- 25.Godec J, Tan Y, Liberzon A, Tamayo P, Bhattacharya S, Butte AJ, et al. Compendium of Immune Signatures Identifies Conserved and Species-Specific Biology in Response to Inflammation. Immunity. 2016;44(1):194–206. doi: 10.1016/j.immuni.2015.12.006. [DOI] [PMC free article] [PubMed] [Google Scholar]
- 26.Meyuhas O, Kahan T. The race to decipher the top secrets of TOP mRNAs. Biochimica et biophysica acta. 2015;1849(7):801–811. doi: 10.1016/j.bbagrm.2014.08.015. [DOI] [PubMed] [Google Scholar]
- 27.Miloslavski R, Cohen E, Avraham A, Iluz Y, Hayouka Z, Kasir J, et al. Oxygen sufficiency controls TOP mRNA translation via the TSC-Rheb-mTOR pathway in a 4E-BP-independent manner. Journal of molecular cell biology. 2014;6(3):255–266. doi: 10.1093/jmcb/mju008. [DOI] [PMC free article] [PubMed] [Google Scholar]
- 28.Thoreen CC, Chantranupong L, Keys HR, Wang T, Gray NS, Sabatini DM. A unifying model for mTORC1-mediated regulation of mRNA translation. Nature. 2012;485(7396):109–113. doi: 10.1038/nature11083. [DOI] [PMC free article] [PubMed] [Google Scholar]
- 29.Hsieh AC, Liu Y, Edlind MP, Ingolia NT, Janes MR, Sher A, et al. The translational landscape of mTOR signalling steers cancer initiation and metastasis. Nature. 2012;485(7396):55–61. doi: 10.1038/nature10912. [DOI] [PMC free article] [PubMed] [Google Scholar]
- 30.Kaech SM, Tan JT, Wherry EJ, Konieczny BT, Surh CD, Ahmed R. Selective expression of the interleukin 7 receptor identifies effector CD8 T cells that give rise to long-lived memory cells. Nature immunology. 2003;4(12):1191–1198. doi: 10.1038/ni1009. [DOI] [PubMed] [Google Scholar]
- 31.Joshi NS, Cui W, Chandele A, Lee HK, Urso DR, Hagman J, et al. Inflammation directs memory precursor and short-lived effector CD8(+) T cell fates via the graded expression of T-bet transcription factor. Immunity. 2007;27(2):281–295. doi: 10.1016/j.immuni.2007.07.010. [DOI] [PMC free article] [PubMed] [Google Scholar]
- 32.Sarkar S, Kalia V, Haining WN, Konieczny BT, Subramaniam S, Ahmed R. Functional and genomic profiling of effector CD8 T cell subsets with distinct memory fates. The Journal of experimental medicine. 2008;205(3):625–640. doi: 10.1084/jem.20071641. [DOI] [PMC free article] [PubMed] [Google Scholar]
- 33.Heyer EE, Moore MJ. Redefining the Translational Status of 80S Monosomes. Cell. 2016;164(4):757–769. doi: 10.1016/j.cell.2016.01.003. [DOI] [PubMed] [Google Scholar]
- 34.Wherry EJ, Blattman JN, Murali-Krishna K, van der Most R, Ahmed R. Viral Persistence Alters CD8 T-Cell Immunodominance and Tissue Distribution and Results in Distinct Stages of Functional Impairment. Journal of virology. 2003;77(8):4911–4927. doi: 10.1128/JVI.77.8.4911-4927.2003. [DOI] [PMC free article] [PubMed] [Google Scholar]
- 35.Morita M, Gravel SP, Chenard V, Sikstrom K, Zheng L, Alain T, et al. mTORC1 controls mitochondrial activity and biogenesis through 4E-BP-dependent translational regulation. Cell metabolism. 2013;18(5):698–711. doi: 10.1016/j.cmet.2013.10.001. [DOI] [PubMed] [Google Scholar]
- 36.Larsson O, Morita M, Topisirovic I, Alain T, Blouin MJ, Pollak M, et al. Distinct perturbation of the translatome by the antidiabetic drug metformin. Proceedings of the National Academy of Sciences of the United States of America. 2012;109(23):8977–8982. doi: 10.1073/pnas.1201689109. [DOI] [PMC free article] [PubMed] [Google Scholar]
- 37.Albert V, Hall MN. mTOR signaling in cellular and organismal energetics. Current opinion in cell biology. 2015;33:55–66. doi: 10.1016/j.ceb.2014.12.001. [DOI] [PubMed] [Google Scholar]
- 38.Chauvin C, Koka V, Nouschi A, Mieulet V, Hoareau-Aveilla C, Dreazen A, et al. Ribosomal protein S6 kinase activity controls the ribosome biogenesis transcriptional program. Oncogene. 2014;33(4):474–483. doi: 10.1038/onc.2012.606. [DOI] [PubMed] [Google Scholar]
- 39.Pollizzi KN, Patel CH, Sun IH, Oh MH, Waickman AT, Wen J, et al. mTORC1 and mTORC2 selectively regulate CD8(+) T cell differentiation. The Journal of clinical investigation. 2015;125(5):2090–2108. doi: 10.1172/JCI77746. [DOI] [PMC free article] [PubMed] [Google Scholar]
- 40.Zhang L, Tschumi BO, Lopez-Mejia IC, Oberle SG, Meyer M, Samson G, et al. Mammalian Target of Rapamycin Complex 2 Controls CD8 T Cell Memory Differentiation in a Foxo1-Dependent Manner. Cell reports. 2016;14(5):1206–1217. doi: 10.1016/j.celrep.2015.12.095. [DOI] [PubMed] [Google Scholar]
- 41.Zinzalla V, Stracka D, Oppliger W, Hall MN. Activation of mTORC2 by association with the ribosome. Cell. 2011;144(5):757–768. doi: 10.1016/j.cell.2011.02.014. [DOI] [PubMed] [Google Scholar]
- 42.He R, Hou S, Liu C, Zhang A, Bai Q, Han M, et al. Follicular CXCR5-expressing CD8+ T cells curtail chronic viral infection. Nature. 2016;537(7620):412–428. doi: 10.1038/nature19317. [DOI] [PubMed] [Google Scholar]
- 43.Im SJ, Hashimoto M, Gerner MY, Lee J, Kissick HT, Burger MC, et al. Defining CD8+ T cells that provide the proliferative burst after PD-1 therapy. Nature. 2016;537(7620):417–421. doi: 10.1038/nature19330. [DOI] [PMC free article] [PubMed] [Google Scholar]
- 44.Leong YA, Chen Y, Ong HS, Wu D, Man K, Deleage C, et al. CXCR5+ follicular cytotoxic T cells control viral infection in B cell follicles. Nature immunology. 2016;17(10):1187–1196. doi: 10.1038/ni.3543. [DOI] [PubMed] [Google Scholar]
- 45.Utzschneider DT, Charmoy M, Chennupati V, Pousse L, Ferreira DP, Calderon-Copete S, et al. T Cell Factor 1-Expressing Memory-like CD8(+) T Cells Sustain the Immune Response to Chronic Viral Infections. Immunity. 2016;45(2):415–427. doi: 10.1016/j.immuni.2016.07.021. [DOI] [PubMed] [Google Scholar]
- 46.Wu T, Ji Y, Moseman EA, Xu HC, Manglani M, Kirby M, et al. The TCF1-Bcl6 axis counteracts type I interferon to repress exhaustion and maintain T cell stemness. Science immunology. 2016;1(6) doi: 10.1126/sciimmunol.aai8593. [DOI] [PMC free article] [PubMed] [Google Scholar]
- 47.Wirth TC, Xue HH, Rai D, Sabel JT, Bair T, Harty JT, et al. Repetitive antigen stimulation induces stepwise transcriptome diversification but preserves a core signature of memory CD8(+) T cell differentiation. Immunity. 2010;33(1):128–140. doi: 10.1016/j.immuni.2010.06.014. [DOI] [PMC free article] [PubMed] [Google Scholar]
- 48.Chang JT, Wherry EJ, Goldrath AW. Molecular regulation of effector and memory T cell differentiation. Nature immunology. 2014;15(12):1104–1115. doi: 10.1038/ni.3031. [DOI] [PMC free article] [PubMed] [Google Scholar]
- 49.Colina R, Costa-Mattioli M, Dowling RJ, Jaramillo M, Tai LH, Breitbach CJ, et al. Translational control of the innate immune response through IRF-7. Nature. 2008;452(7185):323–328. doi: 10.1038/nature06730. [DOI] [PubMed] [Google Scholar]
- 50.Merico D, Isserlin R, Stueker O, Emili A, Bader GD. Enrichment map: a network-based method for gene-set enrichment visualization and interpretation. PloS one. 2010;5(11):e13984. doi: 10.1371/journal.pone.0013984. [DOI] [PMC free article] [PubMed] [Google Scholar]
- 51.Tripathi S, Pohl MO, Zhou Y, Rodriguez-Frandsen A, Wang G, Stein DA, et al. Meta- and Orthogonal Integration of Influenza “OMICs” Data Defines a Role for UBR4 in Virus Budding. Cell host & microbe. 2015;18(6):723–735. doi: 10.1016/j.chom.2015.11.002. [DOI] [PMC free article] [PubMed] [Google Scholar]
Associated Data
This section collects any data citations, data availability statements, or supplementary materials included in this article.