Abstract
Several classes of ligands for Protease-Activated Receptors (PARs) have shown impressive anti-inflammatory and cytoprotective activities, including PAR2 antagonists and the PAR1-targeting parmodulins. In order to support medicinal chemistry studies with hundreds of compounds and to perform detailed mode-of-action studies, it became important to develop a reliable PAR assay that is operational with endothelial cells, which mediate the cytoprotective effects of interest. We report a detailed protocol for an intracellular calcium mobilization assay with adherent endothelial cells in multiwell plates that was used to study a number of known and new PAR1 and PAR2 ligands, including an alkynylated version of the PAR1 antagonist RWJ-58259 that is suitable for the preparation of tagged or conjugate compounds. Using the cell line EA.hy926, it was necessary to perform media exchanges with automated liquid handling equipment in order to obtain optimal and reproducible antagonist concentration-response curves. The assay is also suitable for study of PAR2 ligands; a peptide antagonist reported by Fairlie was synthesized and found to inhibit PAR2 in a manner consistent with reports using epithelial cells. The assay was used to confirm that vorapaxar acts as an irreversible antagonist of PAR1 in endothelium, and parmodulin 2 (ML161) and the related parmodulin RR-90 were found to inhibit PAR1 reversibly, in a manner consistent with negative allosteric modulation.
Keywords: Protease-Activated Receptor, PAR1, PAR2, GPCR, Calcium mobilization, Parmodulin, ML161, Vorapaxar, RWJ-58259, Negative allosteric modulator
1. Introduction
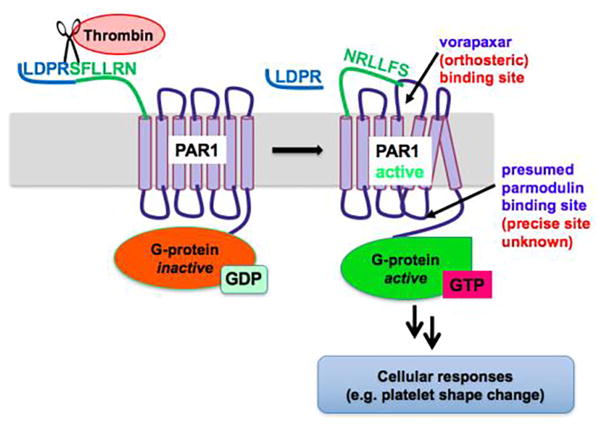
Protease-activated receptors (PARs)1–3 comprise a category of class A G-protein coupled receptors (GPCRs) that are activated by extracellular proteases via cleavage of their N-termini, revealing tethered ligands that serve to self-activate the receptors. This process is illustrated with one of 4 PAR subtypes, PAR1, in Fig. 1.4,5 PARs mediate a wide range of biological effects in numerous tissues, in particular platelet activation and inflammation in vascular tissues. One consequence of the intramolecular mode of activation of PARs is that competitive antagonism can be very challenging due to the high effective concentration of the tethered ligands. Nonetheless, highly potent antagonists have been discovered and progressed to clinical studies as platelet inhibitors: the PAR1 antagonist vorapaxar6 is FDA-approved for treatment of coronary artery disease in certain patients, and the pepducin7 PAR1 antagonist PZ-1288 and the PAR4 antagonist BMS-9861209 were recently in Phase 1 clinical trials.
Fig. 1.
Thrombin-mediated PAR1 signaling.
As part of our program exploring alternative approaches to the modulation of PAR-mediated signaling,10 we have been exploring the medicinal chemistry and pharmacology of the parmodulins, a series of small molecules that act as biased ligands at PAR1 via a postulated intracellular, allosteric mechanism (Fig. 1).11–13 Parmodulins were initially of interest to us as antithrombotic agents, due to their biased antagonism of platelet activation: they inhibit Gα q-driven granule secretion without substantially affecting Gα 12/13 signaling and platelet shape change. More recently, our lead compound ML161 (also known as parmodulin 2 or PM2) has shown significant promise for its cytoprotective effects in cellular and animal studies, results that are complementary to extensive literature documenting that the PAR-targeting protease Activated Protein C (aPC) can promote cytoprotective effects via PAR1 and/or PAR2,14–25 studies that have been reviewed in recent years.26–31 In contrast to vorapaxar, ML161 did not block the cytoprotective effects of aPC in endothelial cells exposed to the cytotoxic agents staurosporine and TNF-α ,13 and more recently it was found to promote on its own a cytoprotective program via PAR1 in the same cells.32 ML161 also significantly decreased cardiac infarct size in a murine model of myocardial ischemia–reperfusion injury.33 We hypothesize that the biased, cytoprotective signaling of the parmodulins may be due to their presumed allosteric site of action on PAR1 in endothelial cells (Fig. 1).
Despite the promising in vivo properties of the parmodulins and other PAR ligands, our efforts to study their effects in endothelial cells30 have been hindered by the lack of a reported medium throughput assay protocol. Our present cell lines of interest are Human Umbilical Vein Endothelial Cells (HUVEC) and EA. hy926,34 a hybrid endothelial cell line well-established for in vitro measurements of cytoprotective and barrier-protective effects.21,22 In order to quantify the signaling bias of the parmodulins and other PAR ligands in these cells, our first objective was to identify a reliable method for the measurement of intracellular calcium mobilization (iCa2+), which can be driven by agonism of PARs through the G-protein Gα q. Single cell imaging of PAR-driven intracellular calcium mobilization in endothelial cells with different calcium-binding dyes has been reported by several investigators, including Zlokovic35 and Kuckleburg,36 but these assays would not be ideal for rapid analysis of large numbers of compounds. Protocols of PAR-mediated calcium mobilization using plate readers or FLIPR® apparatus have been reported in epithelial cells with PAR2 ligands,37 and with PAR1 ligands in human dermal microvascular endothelial cells (HMEC-1),38 but we are not aware of reports with detailed protocols using adherent endothelial cell lines that were used to generate concentration-responses of PAR1 ligands. Fairlie has, however, reported concentration-responses of PAR2 agonists and antagonists with HUVEC and provided assay protocols.39
2. Results
2.1. Synthesis of tool compounds
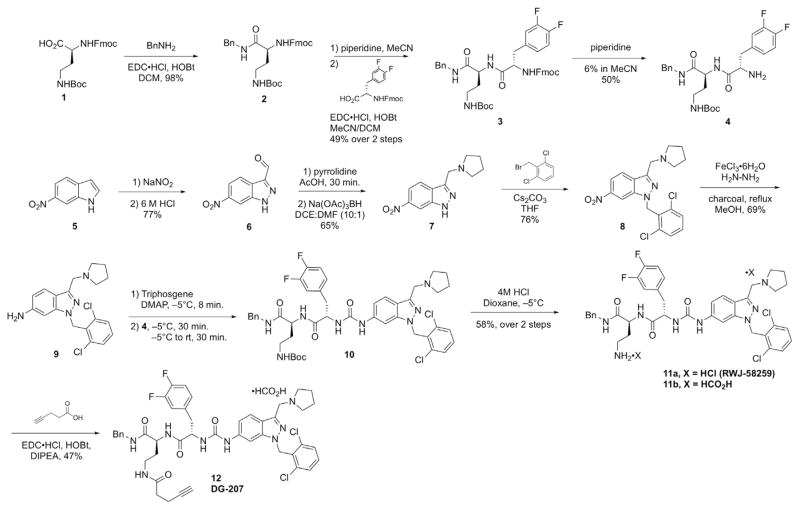
We commenced our studies with the syntheses of several tool compounds and functionalized analogs to support future mode-of-action studies. Our interest in building modified and/or labeled versions of various PAR1 antagonists led us to synthesize the tethered ligand peptidomimetic RWJ-58259 (Scheme 1),40 versions of which had been under preclinical investigation as antiplatelet agents.41–43 Consideration of published structure-activity relationship (SAR) data with platelets suggested that modification of the primary amine could be tolerated. To this end, we synthesized RWJ-58259 using protocols slightly modified from the original report.40 The commercially-available amino acid 1 was coupled sequentially at the acid and amine moieties using standard amide coupling (EDC) and Fmoc-removal conditions (piperidine) to yield dipeptide 4. According to the protocols reported by Zhang and Maryanoff,40 6-nitroindole 5 underwent nitrosation and rearrangement to yield 3-formylindazole 6, followed by reductive amination and N-alkylation, providing nitroindazole 8. Several nitro reduction protocols gave high-yielding reactions, including stoichiometric SnCl2, but these often gave minor byproducts that proved difficult to remove later in the synthesis. The reported protocol using hydrazine and catalytic FeCl3 gave the desired 7-aminoindazole 9 in high purity after column chromatography. The synthesis of urea 10 via an intermediate 4-nitrophenylcarbamate proved to be low-yielding in our hands, which was also consistent with the original report and a subsequent report from Herranz, who found improved yields using triphosgene and propylene oxide as an acid scavenger. 44 High-purity urea 10 was obtained by us in acceptable yields via a slow addition of triphosgene to 9, followed by the addition of dipeptide 4, as reported by Caddick.45 Boc removal using HCl provided RWJ-58259 (11), which was profiled with several other PAR1 antagonists (vide infra). Additionally, in order to use RWJ-58259 as a scaffold for the attachment of e.g. fluorophores for future studies, we wished to expand the range of applicable conjugation reactions. We therefore explored the attachment of several different alkyne building blocks for use in copper-catalyzed alkyne/azide cycloadditions (CuAAC).46 These efforts were hampered by the poor solubility of several of the intermediates (2–4, 10) involved in the synthesis of RWJ-58259. However, we successfully coupled 11 with 4-pentynoic acid using EDC/HOBt in DMF (Scheme 1) to yield alkyne DG-207 (12).
Scheme 1.
Synthesis of PAR1 antagonist RWJ-58259 and alkynylated analog DG-207.
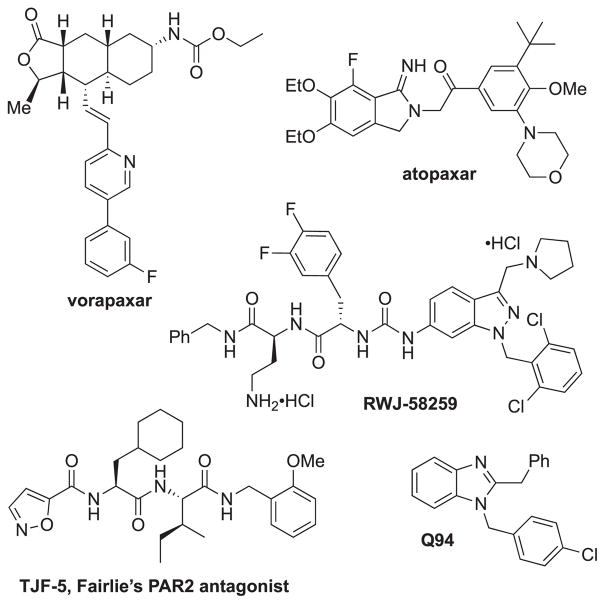
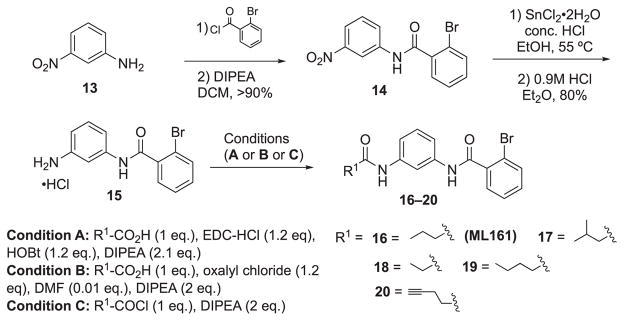
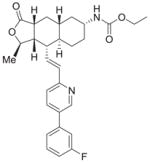
In addition to RWJ-58259 and the commercially available PAR1 antagonists vorapaxar6 and atopaxar47 (Fig. 2), we aimed to profile a selection of our parmodulin analogs (Table 1). “Western” analogs (ML161, CJD-125, RR-90, EMG-21, EMG-23, and RR-10) were prepared as described previously,12 or via the protocol summarized in Scheme 2. The alkyne RR-10 (20, Scheme 2) and the aryl azide DG-5 (26, Scheme 3) were also prepared to investigate the possibility of generating photoaffinity ligands (via aryl azide to nitrene conversion), with alkyne handles for pulldown experiments.
Fig. 2.
Previously-reported PAR antagonists used in these studies.
Table 1.
Inhibition data of select antagonists in the PAR1-mediated iCa2+ mobilization assay.
| Entry | ID# | Structure | % Inhibition & IC50a | Log IC50 ± Std. Error |
|---|---|---|---|---|
| 1 | Vorapaxar |
|
95%; 0.032 μM |
− 7.5 ± 0.084 |
| 2 | Atopaxar |

|
94%; 0.033 μM |
− 7.5 ± 0.10 |
| 3 | RWJ-58259 11a |

|
94%; 0.020 μM |
− 7.7 ± 0.065 |
| 4 | DG-207 12 |

|
76%; 0.29 μM |
− 6.5 ± 0.074 |
| 5 | ML161 16 |

|
82%; 0.85 μM |
− 6.7 ± 0.099 |
| 6 | CJD-125 17 |

|
74%; 3.16 μMb |
N.D. |
| 7 | EMG-21 18 |

|
68%; 3.31 μM |
− 5.5 ± 0.26 |
| 8 | EMG-23 19 |

|
49% | N.D. |
| 9 | RR-90 21 |

|
77%; 0.97 μM |
− 6.0 ± 0.19 |
| 10 | DG-5 26 |

|
77%; 94 μM |
− 4.0 ± 2.9 |
| 11 | RR-10 20 |

|
79%; 81 μM |
− 4.0 ± 5.1 |
%Inhibition of PAR1 antagonists in presence of 5 μM TFLLRN-NH2. N.D. = not determined.
Estimated IC50 (incomplete curve at high concentration).
Scheme 2.
General synthesis of parmodulins with west side modifications.
Scheme 3.
Synthesis of azido analog DG-5.
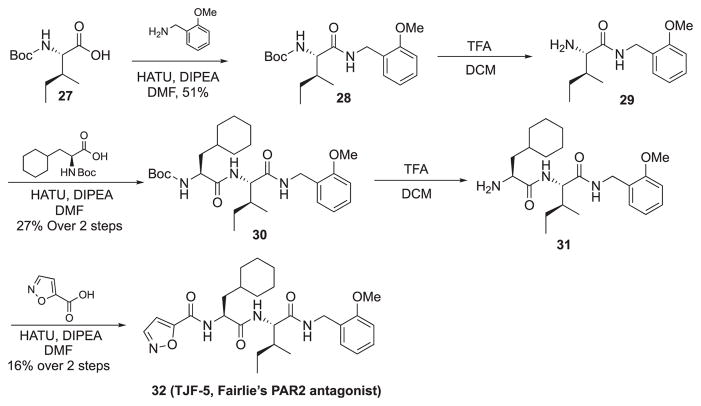
Our additional interest in the modulation of PAR2 required us to obtain a reliable PAR2 antagonist for confirming that our assay could also be applicable to measuring PAR2 activation in endothelium. For this purpose, we selected Fairlie’s peptidic PAR2 antagonist (termed by us TJF-5, Fig. 2), which was previously prepared via solid-phase peptide synthesis.48 Since we wished to potentially access larger quantities of this compound, we investigated a solution-phase synthesis of TJF-5, which proceeded uneventfully using Boc-protected building blocks and HATU as coupling agent (Scheme 4).
Scheme 4.
Solution-phase synthesis of TJF-5 (Fairlie’s PAR2 antagonist).
2.2. Initial studies of calcium mobilization with adherent endothelial cells
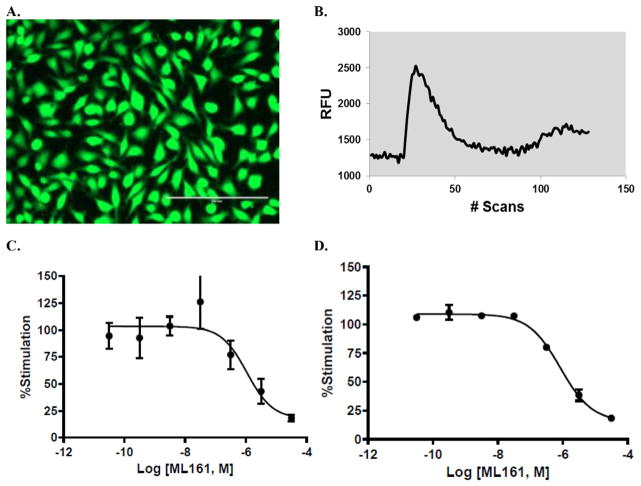
Our assay development studies commenced with the testing of several options for measuring calcium mobilization in adherent endothelial cells. The transformed endothelial cell line EA. hy926,34 widely used in other PAR-related studies, could be grown reliably in tissue culture-treated 96-well plates. Cell seeding of approximately 25,000 cells/well gave confluent monolayers within 48 h. The calcium binding fluorescent dye Fluo-4, dosed as its acetoxymethyl ester (Fluo-4/AM), generated adequate emission signals at 525 nm for us to reliably measure PAR activation using peptide agonists for human PAR1 and PAR2, which correspond to their tethered ligands: TFLLRN-NH2 (PAR1 selective), SLIGKV-NH2 (PAR2 selective), and SFLLRN-NH2 (PAR1/2 selective). Resting cells containing Fluo-4 are depicted in Fig. 3A, prior to agonist addition. As with other calcium-binding dyes, the acetoxymethyl ester permeates the cells and is cleaved by esterases, retaining it in the cell.49 Anionic transporters are blocked by the concurrent application of probenecid, which slows the efflux of Fluo-4, according to standard protocols. However, we did observe the efflux of Fluo-4 and decreased calcium responses over time. Assays were performed on 16 wells at a time (2 columns of a 96 well plate) using a plate reader (PerkinElmer EnSpire® ); increased throughput could be easily obtained using an instrument imaging all wells concurrently (e.g. FLIPR® ).50,51 A representative trace of response versus time is shown in Fig. 3B. The difference between the maximal emission and the average of the baseline emission at 525 nm was used for all response measurements, which were normalized to the agonist response with no inhibitor present (only vehicle, set to 100%).
Fig. 3.
A: Adherent Ea.hy926 cells containing Fluo-4 dye. Cells were imaged in a clear-bottom, black wall 96-well plate, using an Evos Fl inverted microscope (20X) with GFP setting. B: Representative Fluo-4-Ca2+ emission curve (525 nm) in response to TFLLRN-NH2 (3.16 μM). C: Concentration–response curve of a typical (unsuccessful) assay with the PAR1 antagonist ML161 and 3.16 μM TFLLRN-NH2 before optimization (manual media exchanges), n = 3. D: Representative concentration–response curve with the PAR1 antagonist ML161 and 5 μM TFLLRN-NH2 after assay optimization (automated liquid handling).
We were pleased to see acceptable signal/noise and measured concentration–response curves with the PAR1 and PAR2 agonists, however we were disappointed to see inconsistent results when measuring antagonist activities. Deviations in normalized emission levels were unacceptably high; a representative plot is given for ML161 in Fig. 3C. Adverse effects on the endothelial cells (retraction) were observed when incubated in media containing DMSO required to dissolve the antagonists (1% final concentration). Retraction was minimized when working with 0.1–0.2% DMSO, but high deviations were still observed in many, but not all, assays. We reasoned that the low aqueous solubility of many PAR antagonists, including vorapaxar and ML161, may cause inconsistent results, particularly since turbid suspensions were observed at high concentrations. Several excipients were tested in order to keep compounds in solution at the highest concentrations (10– 100 μM), including Tween-20, Tween-80, Triton X-100, BSA, and Pluronic F-127 (0.01–0.1%). Pluronic F-127 (up to 0.05%) was effective at solubilizing compounds and did not have observable toxic effects on the cells. Assays proceeded with this excipient in the antagonist solutions, but as previously, inconsistent antagonist concentration-response curves were still obtained. Interestingly, the high deviations themselves were inconsistent, and it became clear that certain wells contained poorly-responding cells. We reasoned that inconsistent pipetting technique, particularly for introduction of the agonists immediately before scanning in the plate reader, could be the source of inconsistencies, but this also did not prove to be the case after extensive experimentation, including the use of higher volumes.
We next examined the process of loading the dye (Fluo-4/AM) into the cells. Omitting the probenecid did not have a productive effect. Buffer containing the Fluo-4/AM was added to the cells, then incubated for 0.5–1 h. Longer incubation times with the dye were not helpful and simply led to lower maximum signals, with the Fluo-4 slowly leaking from the cells, which can be problematic for longer experiments. An additional variable was the manner in which the media was changed. Our initial protocol used simple “flicking” of the plates by hand into paper towels to remove media or buffer from the plates, followed by multichannel pipetting of fresh buffer during liquid exchanges. Ensuring that the pipet tips did not touch the bottom of the plate did not improve the quality of the data. Finally, we reasoned that the force of the flicking was inconsistent and could disturb the cells in unpredictable ways, even though wells were confirmed to contain evenly distributed cells that had not obviously detached. Our inconsistent results disappeared after we gained access to an automated liquid handler (Beckman-Coulter BioMek 3000) for media changes. Antagonist concentration-response curves were then consistently obtained with low deviations (e.g. Fig. 3D).
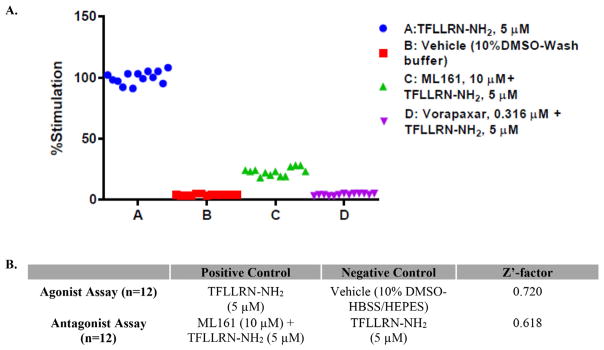
To determine the suitability of our assay for screening hundreds of compounds, we performed experiments to determine the signal window of the assay by measuring the average response and standard deviation for the PAR1 agonist TFLLRN-NH2 (5 μM) (designated as the positive control, Fig. 4, column A), and comparing to the responses obtained after the same agonist was added to cells treated with the PAR1 antagonists ML161 (10 μM) (column C) or vorapaxar (0.316 μM) (column D). The resulting Z′ factors were >0.5, and the assay is thus considered to be highly suitable for high-throughput screening.52
Fig. 4.
A: Calcium mobilization responses with PAR1 agonist 5 μM TFLLRN-NH2 (column A) plus optional PAR1 antagonists 10 μM ML161 (column C) or 0.316 μM vorapaxar (column D). B: Table of calculated Z′-factors.
2.3. Concentration-responses of PAR1 and PAR2 antagonists with endothelial cells
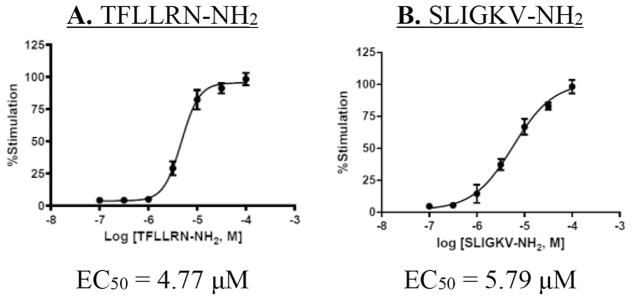
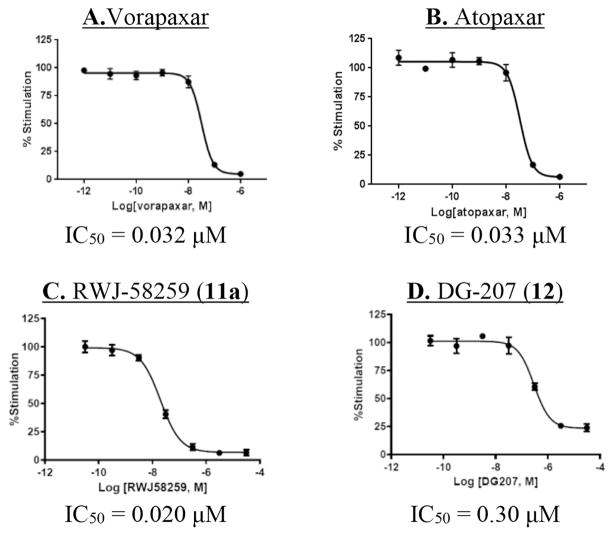
With a reliable calcium mobilization assay in hand, we proceeded to determine concentration-responses with the peptide agonists for PAR1 (Fig. 5A) and PAR2 (Fig. 5B), which gave EC50s of 4.8 μM and 5.8 μM, respectively. Using 5 μM TFLLRN-NH2 as agonist, concentration–response curves were also measured with the PAR1 antagonists vorapaxar (Fig. 6A, IC50 = 0.032 μM), atopaxar (Fig. 6B, IC50 = 0.033 μM), and RWJ-58259 (Fig. 6C, IC50 = 0.020 μM). Of special interest to us was the performance of our alkynylated analog of RWJ-58259, DG-207 (12). It was 15-fold less potent in this assay than RWJ-58259 (Fig. 6D), but with an IC50 of 0.30 μM it is still anticipated to have sufficient potency for our planned conjugate molecules.
Fig. 5.
PAR agonist concentration–response with EA.hy926 cells: A) TFLLRN-NH2 (PAR1)-mediated iCa2+ mobilization; B) SLIGKV-NH2 (PAR2)-mediated iCa2+.
Fig. 6.
Concentration-response for PAR1 antagonists in the TFLLRN-NH2-mediated iCa2+ mobilization assay (5 μM) with EA.hy926 cells: A) vorapaxar, B) atopaxar, (C) RWJ-58259 D) DG-207.
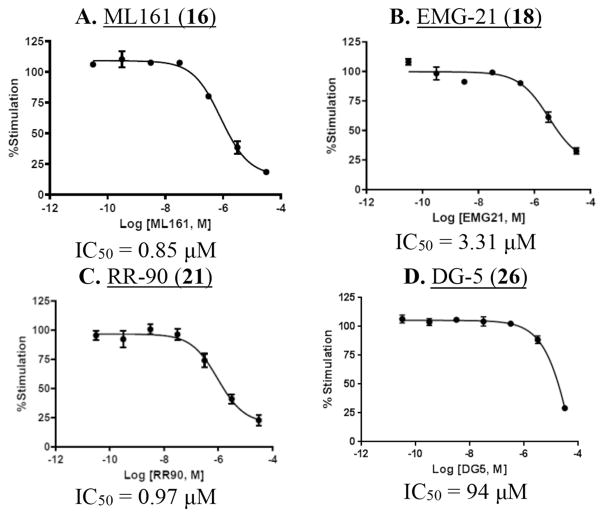
Concentration-responses were also obtained with several representative parmodulins (Fig. 7). With ML161, optimal signal/noise was obtained with 5 μM TFLLRN-NH2; at this concentration, an IC50 of 0.85 μM was measured (Fig. 7A). As previously reported in an alternative P-selectin expression assay with platelets,12 the analog with one carbon less on the aliphatic chain on the western side (EMG-21) was active but less potent than ML161 (Fig. 7B, IC50 = 3.3 μM), and the analog with one additional carbon (EMG-23) was poorly active (Table 1, entry 8). Also in line with our previous results in platelets, the aniline RR-90 was similar in potency to ML161 (Fig. 7C, IC50 = 0.97 μM). However, the branched aliphatic amide CJD-125, an analog of ML161 with improved plasma stability and equipotency in the platelet P-selectin assay,12 was less potent than ML161 and did not give a good concentration-response with EA.hy926 cells (Table 1, entry 6). Of note is the fact that efficacy (maximal inhibition) of the parmodulins does not appear to be quite as high as with the presumably orthosteric inhibitors of Fig. 6, though this comparison is complicated by concentration–limiting solubilities of some of the parmodulins.
Fig. 7.
Concentration-response for parmodulins (ML161 analogs) in the TFLLRN-NH2-mediated (5 μM) iCa2+ mobilization assay.
Our collaborators in the Flaumenhaft lab have performed experiments with chimeric PAR receptors which support our hypothesis that the parmodulins act at an intracellular location,13 which is highly unusual for small molecule GPCR ligands. In order to identify a precise binding site on PAR1 for the parmodulins, we were interested in generating analogs of ML161 suitable for photoaffinity studies. To this end, we prepared analogs possessing aryl azides (for photochemical generation of reactive nitrenes), and alkynes for conjugation or pulldown experiments. Unfortunately, the aryl azide DG-5 (Fig. 7D; Table 1, entry 10) had only modest activity. The western alkyne RR-10 (entry 11) also had only modest inhibition of PAR1. Results with all PAR1 ligands are summarized in Table 1.
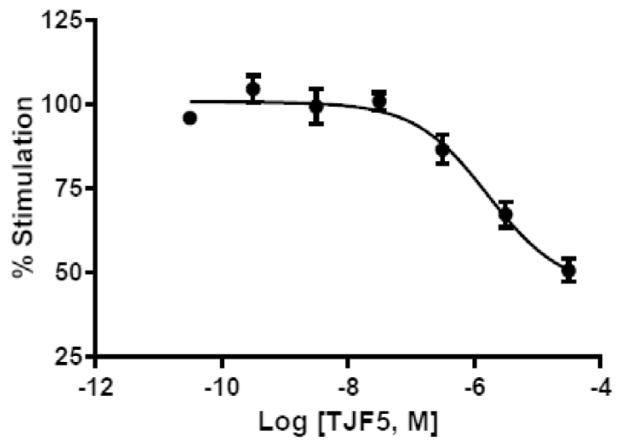
Our assay also proved to be reliable for measuring the inhibition of calcium mobilization with PAR2 antagonists: the peptide inhibitor TJF-5 inhibited the action of the PAR2 activating peptide SLIGKV-NH2 (5 μM) with an IC50 of 1.7 μM (Fig. 8).
Fig. 8.
Concentration-response for the PAR2 antagonist TJF5 (Fairlie’s PAR2 antagonist, 32) in the SLIGKV-NH2-mediated (5 μM) iCa2+ mobilization assay.
2.4. Selectivity and mode-of-action studies
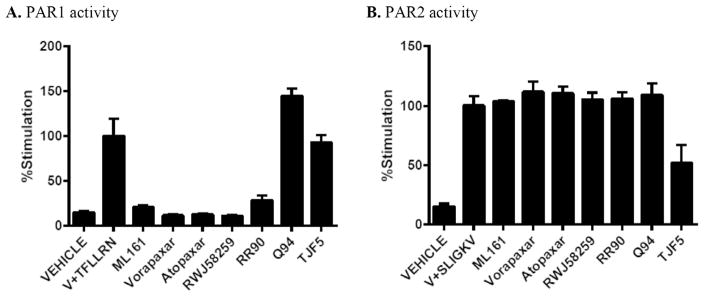
The activity of the parmodulins and other PAR1 antagonists at PAR2 has not previously been reported, to our knowledge, perhaps because human platelets do not express PAR2. The ability of compounds to inhibit the action of the PAR1 agonist TFLLRN-NH2 is summarized in Fig. 9A. The more potent PAR1 antagonists described previously vorapaxar, atopaxar, and RWJ-58259 were used at concentrations of 0.316 μM, and as expected largely inhibit the activation of the EA.hy926 cells and mobilization of calcium. The parmodulins ML161 (IC50 = 0.85 μM) and RR-90 (IC50 = 0.97 μM) also significantly inhibited the PAR1 agonist TFLLRN-NH2, which can be compared to the potencies we previously reported with these compounds in a P-selectin assay using human platelets (0.26 and 0.34 μM, respectively).12 Q94 (Fig. 2) is a commercially available benzimidazole that was reported to selectively inhibit PAR1 Gα q-mediated calcium mobilization in HMEC-1 endothelial cells.38 It did not act as an antagonist in this assay using EA. hy926 cells, and actually boosted the response to TFLLRN-NH2. As expected, the PAR2 antagonist TJF-5 also had no measurable effect on TFLLRN-NH2-induced calcium mobilization. None of the PAR1 ligands had any measurable effect on PAR2-mediated calcium mobilization with SLIGKV-NH2 (Fig. 9B), confirming that they have excellent selectivity for PAR1 over PAR2 in EA.hy926 endothelial cells. These cells did not respond to high concentrations (up to 100 μM) of the PAR4 agonist AYPGFK-NH2.
Fig. 9.
Selectivity data of antagonists in PAR1 (TFLLRN-NH2)- and PAR2 (SLIGKV-NH2)-driven iCa2+ mobilizationa aML161, RR90, Q94, TJF5 (Fairlie’s PAR2 antagonist) were used at 10 μM; Vorapaxar, Atopaxar, and RWJ-58259 were at 0.316 μM. TFLLRN-NH2 and SLIGKV-NH2 were used at 3.16 μM; Vehicle (V) = 10% DMSO-HBSS/HEPES.
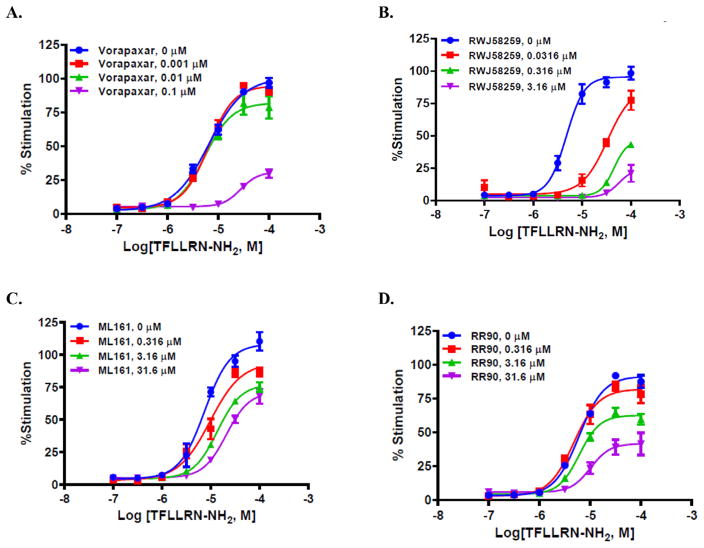
Next, we evaluated if the PAR1 ligands inhibited PAR1 in EA. hy926 cells in an allosteric, non-competitive manner; we have previously shown that ML161 acts as a non-competitive inhibitor of SFLLRN-NH2 in a platelet P-selectin assay,12 and it does not significantly inhibit binding of [3H] high-affinity thrombin receptor activating peptide ([3H]TRAP) to platelet membranes.13 We measured the concentration-responses of TFLLRN-NH2 in the presence of increasing concentrations of PAR1 antagonists (Fig. 10). Both the presumed orthosteric antagonists (vorapaxar and RWJ-58529) and the parmodulins (ML161 and RR-90) induced a dose-dependent decrease in efficacy of the PAR1 agonist that is consistent with either a lack of reversibility OR action as a negative allosteric modulator. However, it should be noted that the fitted concentration-response curves of TFLLRN-NH2 in the presence of RWJ-58259 suggest that competitive inhibition might also be possible, whereby the curves are shifted rightward, but the agonist concentrations are not high enough to detect maximum response. The nearly identical ligand RWJ-56110 (with an indole instead of indazole) is a competitive inhibitor of binding of the radiolabeled PAR1 activating peptide [3H]S-(p-F-Phe)-homoarginine-L-homoarginine-KY-NH2.41 Vorapaxar6 is well known to act as a poorly reversible inhibitor of PAR1, with a very low off rate and extended half-life, likely due to its binding site on the top of PAR1 whereby it becomes covered by extracellular loop 2 (ECL-2), as seen in the crystal structure reported by Coughlin and Kobilka.53
Fig. 10.
iCa2+ concentration–response of the PAR1 agonist TFLLRN-NH2 in the presence of increasing concentrations of (A) vorapaxar, (B) RWJ 58259, (C) ML161, (D) RR-90.
To differentiate between irreversible (presumably orthosteric) inhibition and negative allosteric modulation, we performed “wash” studies whereby the endothelial cells were treated with inhibitor, then washed twice with buffer prior to addition of the agonist and measurement of intracellular calcium levels (Fig. 11). The activity of vorapaxar was completely retained after washing the cells, confirming that its binding is poorly reversible in endothelial cells. RWJ-58259 and the parmodulins ML161, RR-90, and CJD-125 lost most or all of their activities after washing. Therefore, we conclude that the parmodulins, at least ML161 and RR-90, act as negative allosteric modulators of TFLLRN-NH2 at PAR1.
Fig. 11.
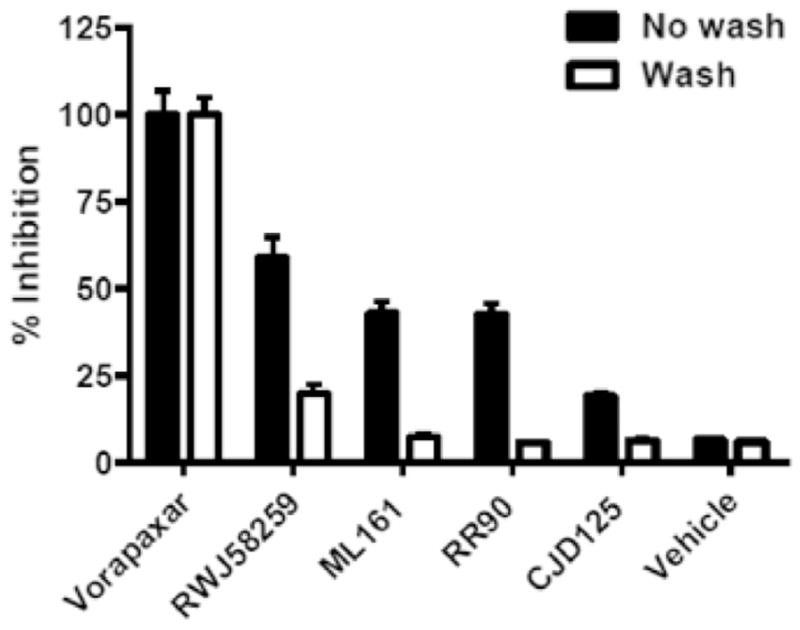
Reversibility studies of the PAR1 antagonists vorapaxar, RWJ-58259, ML161, and RR-90 in the iCa2+ assay. Cells containing antagonists were optionally washed with buffer prior to treatment with the PAR1 agonist TFLLRN-NH2 (5 μM). Vorapaxar and RWJ-58259 were used at 0.316 μM; ML161, CJD125, RR-90 were used at 10 μM.
3. Conclusions
A protocol for a medium-throughput assay measuring calcium mobilization in adherent endothelial cells was developed and used to measure concentration-responses of a variety of PAR1 and PAR2 ligands. An alkyne-tethered version of the PAR1 antagonist RWJ-58259 (DG-207) was synthesized. It was a less potent inhibitor of the PAR1 agonist TFLLRN-NH2 than the parent compound, but still anticipated to have adequate potency for future use in conjugate compounds. In contrast, several alkyne- and azide-containing analogs of the parmodulin ML161 were found to have moderate (micromolar inhibition) or low potency in this assay. A selection of PAR1 and PAR2 ligands were profiled in further detail, and were found to be highly selective for PAR1 or PAR2. The parmodulins ML161 and RR-90 were found to decrease the efficacy of TFLLRN-NH2 in a dose-dependent manner, but unlike the FDA-approved inhibitor vorapaxar, washing studies showed that their action is reversible in a manner consistent with negative allosteric inhibition of PAR1. Such compounds possess significant potential for the modulation of PARs in a therapeutic manner, in particular for inflammation-related disorders such as sepsis or reperfusion injury.54 Our future work is aimed towards measuring the signaling biases of the parmodulins at PAR1 and optimizing their cytoprotective effects.
4. Experimental section
4.1. General information: Synthesis
All reagents and solvents, including anhydrous solvents, were purchased from commercial vendors and used as received. Compound 1 (CAS# 125238-99-5) was obtained from ChemImpex. Compounds 14, 15, 16 (ML161), 17, 21 (RR-90), and 22 were synthesized as previously described.12 Deionized water was purified by charcoal filtration and used for reaction workups and in reactions with water. NMR spectra were recorded on Varian 300 MHz or 400 MHz spectrometers as indicated. Proton and carbon chemical shifts are reported in parts per million (ppm; δ ) relative to tetramethylsilane (1H δ 0), or CDCl3 (13C δ 77.16), (CD3)2CO (1H δ 2.05, 13C δ 29.84), d6-DMSO (1H δ 2.50, 13C δ 39.5), or CD3OD (1H δ 3.31, 13C δ 49.00). NMR data are reported as follows: chemical shifts, multiplicity (obs = obscured, app = apparent, br = broad, s = singlet, d = doublet, t = triplet, q = quartet, sxt = sextet, m = multiplet, comp = complex overlapping signals); coupling constant(s) in Hz; integration. Unless otherwise indicated, NMR data were collected at 25 °C. Filtration was performed by vacuum using VWR Grade 413 filter paper, unless otherwise noted. Flash chromatography was performed using Biotage SNAP cartridges filled with 40–60 μm silica gel on Biotage Isolera automated chromatography systems with photodiode array UV detectors. Analytical thin layer chromatography (TLC) was performed on Agela Technologies glass plates with 0.25 mm silica gel and F254 indicator. Visualization was accomplished with UV light (254 nm) and KMnO4 stain, unless otherwise noted. Chemical names were generated and select chemical properties were calculated using either ChemAxon Marvin suite (https://www.chemaxon.com) or ChemDraw Professional 15.1. NMR data were processed using either MestreNova or ACD/NMR Processor Academic Edition (http://www.acdlabs.com) using the JOC report format. High-resolution mass spectra (HRMS) were obtained at the University of Wisconsin-Milwaukee Mass Spectrometry Laboratory with a Shimadzu LCMS-IT-TOF with ESI and APCI ionization.
4.2. LC/MS characterization methods
Tandem liquid chromatography/mass spectrometry (LC-MS) was performed on a Shimadzu LCMS-2020 with autosampler, photodiode array detector, and single-quadrupole MS with ESI and APCI dual ionization using a Peak Scientific nitrogen generator.
Method A
Column: Phenomenex Gemini C18 (100 × 4.6 mm, 3 μm particle size, 110 Å pore size)
Column temperature: 40 °C
Sample Injection: 1–5 μL of sample in MeCN or MeOH
Chromatographic monitoring: UV absorbance at 210 or 254 nm
Mobile Phase: Solvent A: H2O w/0.1% formic acid; Solvent B: MeCN w/0.1% formic acid
Flow Rate: 1.0 mL/min
Gradient
0–0.5 min: 25% MeCN
0.5–5 min: 25–95% MeCN
5–7.3 min: 95% MeCN
7.3–7.5 min: 95–25% MeCN
4.3. Preparative HPLC purification methods
Preparative liquid chromatography was performed on a Shimadzu LC-20AP preparative HPLC with autosampler, dual wavelength detector, and fraction collector.
Method A
Column: Phenomenex Gemini C18 Semi Preparative Column (250 × 10 mm, 5 μm particle size, 110 Å pore size)
Column temperature: 23 °C
Mobile Phase: Solvent A: H2O w/0.1% formic acid; Solvent B: MeCN w/0.1% formic acid
Peak collection: measured by UV absorbance at 210 or 254 nm
Sample Injection: 0.1–1.9 mL (2 mL sample loop) of sample in DMSO
Flow Rate: 6.0 mL/min
Gradient
0–1.5 min: 25% MeCN
1.5–8 min: 25–95% MeCN
8–10.5 min: 95% MeCN
4.4. Synthesis of RWJ-58259 and alkynylated analog DG-207
4.4.1. (9H-Fluoren-9-yl)methyl tert-butyl (4-(benzylamino)-4- oxobutane-1,3-diyl)(S)-dicarbamate (2)
To a round bottomed flask with stir bar under nitrogen was added carboxylic acid 1 (500 mg, 1.13 mmol) and anhydrous DCM (25 mL). Benzylamine (0.15 mL, 1.4 mmol), HOBt (229 mg, 1.50 mmol), and EDC· HCl (433 mg, 2.26 mmol) were added and the reaction was stirred under nitrogen for 2 h. A sample aliquot was taken from the reaction, concentrated under reduced pressure, dissolved in a minimal amount of HPLC grade MeCN, and analyzed with LC-MS to confirm reaction completion. The reaction was diluted with DCM (75 mL) and washed with saturated NaHCO3 (30 mL), 1 M HCl (30 mL), brine, dried over MgSO4, filtered, and concentrated under reduced pressure to give 2 (588 mg) as a white solid in 98% yield. mp = 154–156 °C; LC-MS tR = 6.09 min (Characterization Method A); m/z = 530.05 (M+H+); 1H NMR (300 MHz, CDCl3) δ = 7.76 (d, J = 7.6 Hz, 2H), 7.61–7.49 (overlapping signals, 3H), 7.43–7.22 (m, 9H), 5.96 (d, J = 6.7 Hz, 1H), 5.11 (br. m., 1H), 4.50–4.13 (overlapping m, 6H), 3.48–3.32 (br s., 1H), 3.04–2.90 (br m., 1H), 1.97–1.71 (overlapping signals, 2H), 1.45–1.37 (m, 9H); 13C NMR (75 MHz, CDCl3) δ = 171.2, 157.2, 156.3, 143.9, 141.5, 138.0, 128.8, 127.9, 127.8, 127.6, 127.3, 125.3, 120.2, 80.1, 67.2, 52.2, 47.3, 43.8, 37.0, 34.9, 28.6.
4.4.2. tert-butyl ((S)-3-((S)-2-((((9H-Fluoren-9-yl)methoxy)carbonyl) amino)-3-(3,4-difluorophenyl)propanamido)-4-(benzylamino)-4-oxobutyl) carbamate (3)
Part 1: Fmoc removal
Intermediate 2 (550 mg, 1.03 mmol) was added to a round bottomed flask with stir bar and sealed under nitrogen, then MeCN (25 mL), DCM (10 mL), and piperidine (0.220 mL, 2.22 mmol) were added. The reaction was stirred for 2 h. A sample aliquot was taken from the reaction, concentrated under reduced pressure, dissolved in a minimal amount of HPLC grade MeCN, and analyzed with LCMS to confirm reaction completion. The reaction was concentrated under reduced pressure and then re-dissolved in (CHCl3/EtOAc, 1: 1, 75 mL), washed with H2O (2 × 20 mL) and brine (20 mL). The organic phase was dried over MgSO4, filtered, and concentrated under reduced pressure to give crude material (496 mg) as a white solid that was carried onto the next reaction without further purification.
Part 2: Coupling
To a round bottomed flask with stir bar already containing crude material from Part 1 (496 mg crude material, max. yield is 319 mg) was added anhydrous MeCN (30 mL) and anhydrous DCM (15 mL). (S)-2-((((9H-Fluoren-9-yl)methoxy)carbonyl) amino)-3-(3,4-difluorophenyl)propanoic acid (300 mg, 0.709 mmol), HOBt (191 mg, 1.41 mmol), and EDC· HCl (272 mg, 1.41 mmol) were added, and the resulting white suspension was stirred for 2 h. A sample aliquot was taken from the reaction, concentrated under reduced pressure, dissolved in a minimal amount of HPLC grade MeCN, and analyzed with LC-MS to confirm reaction completion. The reaction was concentrated under reduced pressure, re-suspended in EtOAc (100 mL), and washed with H2O (20 mL), 0.5 M HCl (20 mL), saturated NaHCO3 (20 mL), and brine. The organic phase was dried over MgSO4, filtered, and concentrated under reduced pressure to give crude material (yellow oil) that was dry loaded using silica onto a 5 g silica gel column and purified with flash chromatography (EtOAc/hexanes, 1–100%) to give 3 (368 mg, 49%) as a white solid over 2 steps. m.p. = 183–185 °C; LC/MS tR = 6.43 min (Characterization Method A); m/z = 713.15 (M+H+), m/z = 757.35 (formic acid adduct); 1H NMR (300 MHz, DMSO d6) δ = 8.43 (dd, J = 5.0, 5.9 Hz, 1H), 8.22 (d, J = 7.9 Hz, 1H), 7.86 (d, J = 7.6 Hz, 2 H), 7.68–7.53 (m, 2 H), 7.52–7.43 (br s., 1H), 7.43–7.07 (m, 11H), 6.74 (br s, 1 H), 4.28 (br d, J = 5.6 Hz, 4 H), 4.15 (br s, 3 H), 3.05–2.85 (overlapping br s, 3 H), 2.73 (app t, J = 12.0 Hz, 1 H), 1.86–1.73 (m, 1 H), 1.73–1.58 (m, 1H), 1.34 (s, 9 H); 13C NMR (75 MHz, DMSO-d6) δ = 171.8, 171.7, 156.4, 156.1, 150.8 (dd, J = 45.2, 13 Hz), 147.6 (dd, J = 45.8, 12.1 Hz), 144.4, 144.3, 141.35, 141.33, 139.8, 136.6, 128.9, 128.2, 127.7, 127.6, 127.4, 126.7, 125.9, 120.7, 118.9, 118.6, 117.6, 117.4, 78.3, 66.3, 56.4, 51.5, 47.2, 42.7, 37.5, 37.1, 33.1, 28.9
4.4.3. tert-butyl ((S)-3-((S)-2-Amino-3-(3,4-difluorophenyl) propanamido)-4-(benzylamino)-4-oxobutyl)carbamate (4)
Intermediate 3 (250 mg, 0.351 mmol) was added to a round bottomed flask with stir bar and sealed under nitrogen, then anhydrous MeCN (30 mL) and piperidine (2 mL) were added and the reaction was stirred for 90 min. A sample aliquot was taken from the reaction, concentrated under reduced pressure, dissolved in a minimal amount of HPLC grade MeCN, and analyzed with LC-MS to confirm reaction completion. The reaction was concentrated under reduced pressure to give crude material (light yellow solid) that was triturated with 75/25hexanes/ether. The material was then dry loaded using silica onto a 10 g silica gel column and purified with flash chromatography (IPA/DCM, 0 to 20%) to give 4 (86 mg) as a white solid in 50% yield. mp = 216–219 °C; LC/MS tR = 3.15 min (Characterization Method A); m/z = 491.35 (M+H+), m/z = 489.30 (M–H+), 535.30 (formic acid adduct); 1H NMR (300 MHz, CDCl3) δ = 8.06 (d, J = 7.9 Hz, 1H), 7.72 (br t, J = 5.0 Hz, 1H), 7.37–7.20 (m, 5H), 7.14–6.95 (m, 2H), 6.94–6.83 (br m, 1H), 5.37 (app t J = 5.3, 6.2 Hz, 1H), 4.56–4.47 (m, 1H), 4.47–4.35 (m, 2H), 3.53–3.42 (m, 1H), 3.39–3.25 (br m, 1H), 3.09 (dd, J = 3.8, 9.7 Hz, 1H), 3.02–2.89 (br m, 1H), 2.66 (dd, J = 4.7, 9.1 Hz, 1H), 2.00–1.85 (br m, 1H), 1.84–1.67 (br m, 1H), 1.54 (br m., 2H), 1.43 (s, 9H); 13C NMR (75 MHz, CDCl3) δ = 174.4, 171.2, 156.9, 151.6 (dd, J = 53.5, 12.7 Hz), 148.4 (dd, J = 52.1, 12.4 Hz), 138.1, 134.8 (app dd, J = 5.3, 3.9 Hz), 128.8, 127.9 (partially obs) 127.8, 127.6, 125.4 (app dd, J = 6.2, 3.6 Hz), 118.2 (d, J = 17 Hz), 117.6 (d, J = 17.3 Hz), 79.8, 56.4, 50.4, 43.7, 40.3, 37.0, 34.5, 28.6.
4.4.4. 6-Nitro-1H-indazole-3-carbaldehyde (6)
To a 500 mL round bottomed flask with stir bar was added NaNO2 (6.38 g, 92.5 mmol) and H2O (150 mL). 6-Nitroindole (5, 1.5 g, 9.3 mmol) was added to the above solution at 20 °C and the resultant mixture was stirred vigorously until evenly suspended (over 5 min.). To this bright yellow suspension was added 6 M HCl (14 mL) via addition funnel over 30 min. at 20 °C, and the resultant suspension was stirred for 90 min. A sample aliquot was taken from the reaction, filtered, and the precipitate was dissolved in a minimal amount of HPLC grade MeCN. Analysis with LC-MS confirmed reaction completion. The product was vacuum filtered and the precipitate was washed with additional H2O (50 mL). The precipitate was dried to give 6 (1.37 g) as an orange solid in 77% yield. mp: changed color from orange to brown between 120 and 160 °C, decomposed after 200 °C; LC/MS tR = 2.40 min (Characterization Method A); m/z = 190.05 (M–H+); 1H NMR (400 MHz, DMSO-d6) δ = 10.22 (s, 1H), 8.57 (d, J = 1.5 Hz, 1H), 8.29 (dd, J = 0.5, 8.9 Hz, 1H), 8.13 (dd, J = 2.0, 8.9 Hz, 1H); 13C NMR (100 MHz, DMSO-d6) δ = 187.7, 146.9, 124.0, 122.4, 118.7, 108.6.
4.4.5. 6-Nitro-3-(pyrrolidin-1-ylmethyl)-1H-indazole (7)
Aldehyde 6 (1.3 g, 6.80 mmol) was added to a round bottomed flask with stir bar and sealed under nitrogen. A pre-mixed solution of anhydrous DCE: DMF: AcOH (300: 30: 0.3 mL), and pyrrolidine (2.8 mL, 34.0 mmol) was then added. The resulting yellow suspension became a reddish brown solution immediately after the addition of pyrrolidine, and the reaction was stirred for 20 min. Sodium triacetoxyborohydride (8.32 g, 39.2 mmol) was added in 3 portions at 5 min. intervals and the resultant suspension was stirred at 20 °C for 4 h. A sample aliquot was taken from the reaction, diluted with DCM, and washed with half saturated Na2CO3. The organic layer was separated, concentrated under reduced pressure, dissolved in a minimal amount of HPLC grade MeCN, and analyzed with LC-MS to confirm reaction completion. The reaction was diluted with DCM (100 mL), washed with aqueous NaHCO3 solution (100 mL), brine, dried over Na2SO4, vacuum filtered, and concentrated under reduced pressure to give 2.2 g of dark brown solid. The crude material was dissolved in minimal DCM and loaded onto a 50 g SiO2 column and purified by flash chromatography (1N NH3 in MeOH/DCM, 0–18%) to give 7 (1.09 g) as a shiny orange solid in 65% yield. mp = 37–40 °C; LC/MS tR = 0.91 min (Characterization Method A); m/z = 247.05 (M+H+); m/z = 245.15 (M - H+); 1H NMR (400 MHz, CD3OD) δ = 8.44 (d, J = 1.5 Hz, 1H), 8.05 (d, J = 8.8 Hz, 1H), 7.99 (dd, J = 2.0, 7.0 Hz, 1H), 4.16 (s, 2H), 2.78–2.71 (m, 4H), 1.84 (spt, J = 3.3 Hz, 4H); 13C NMR (75 MHz, CD3OD) δ = 147.0, 142.8, 140.1, 125.2, 121.3, 114.9, 106.8, 53.9, 50.6, 23.1.
4.4.6. 1-(2,6-Dichlorobenzyl)-6-nitro-3-(pyrrolidin-1-ylmethyl)-1Hindazole (8)
Amine 7 (1.06 g, 4.30 mmol) and 2-(bromomethyl)-1,3-dichlorobenzene (1.03 g, 4.30 mmol) were added to a round bottomed flask with stir bar and sealed under nitrogen. Anhydrous THF (50 mL) was added, followed by Cs2CO3 (1.4 g, 4.30 mmol) added in 3 portions (1 portion every 5 min.), and the flask was flushed with nitrogen. The resultant orange solution was stirred for 16 h at 20 °C. A sample aliquot was taken from the reaction, diluted with EtOAc, and washed with H2O. The organic phase was separated, concentrated under reduced pressure, dissolved in CDCl3 and analyzed with NMR to confirm reaction completion. The reaction was diluted with EtOAc (200 mL), washed with H2O (200 mL) and brine, dried over Na2SO4, vacuum filtered, and concentrated under reduced pressure. The brown crude material (1.5 g) was dissolved in minimal DCM and loaded onto a 50 g column and purified with flash chromatography (MeOH/DCM, 0–18%) to give 8 (1.33 g) as an orange brown shiny solid (containing ~10% dibenzylated side-product) in 76% yield. 8 was carried forward to the next step without additional purification. LC/MS tR = 3.15 min (Characterization Method A); m/z = 404.80 (M+H+); for dibenzylated impurity LC-MS tR = 3.63 min (Characterization Method A); m/z = 579.95 (M+H+).
4.4.7. 1-(2,6-Dichlorobenzyl)-3-(pyrrolidin-1-ylmethyl)-1H-indazol-6-amine (9)
To an oven dried pressure tube with stir bar was added indazole 8 (18 mg, 0.044 mmol) l3· 6H2O (25 mol%, 2.6 mg), hydrazine monohydrate solution (65% active hydrazine, 0.05 mL, 0.7 mmol), and activated charcoal (20 mg) were added, the tube was capped tightly, and the reaction was stirred at 100 °C for 2 h. A sample aliquot was taken from the reaction, concentrated under reduced pressure, dissolved in a minimal amount of HPLC grade MeCN, and analyzed with LCMS to confirm reaction completion. The reaction was filtered, the charcoal and filtered solids were washed with MeOH (10 mL), and the filtrate was concentrated under reduced pressure to give crude material that was dry loaded using silica onto a 5 g silica column and purified with flash chromatography (0–20% MeOH/DCM) to give 9 (11.5 mg) as a white solid in 69% yield. LC-MS tR = 1.44 min (Characterization Method A); m/z = 374.95 (M+H+); 1H NMR (300 MHz, CDCl3) δ = 7.57 (d, J = 8.5 Hz, 1H), 7.37 (d, J = 8.2 Hz, 2H), 7.31–7.20 (s, 1H), 6.63 (d, J = 8.8 Hz, 1H), 6.58 (s, 1H), 5.63 (s, 2H), 4.29 (s, 2H), 3.96 (br. s., 2H), 3.13 (br. s., 4H), 1.84 (br. s., 4H); 13C NMR (75 MHz, CDCl3) δ = 146.5, 142.5, 137.0, 131.6, 130.3, 128.8, 121.0, 117.7, 113.7, 92.2, 52.3, 48.5, 48.2, 23.9.
4.4.8. (S)-4-Amino-N-benzyl-2-((S)-2-(3-(1-(2,6-dichlorobenzyl)-3- (pyrrolidin-1-ylmethyl)-1H-indazol-6-yl)ureido)-3-(3,4- difluorophenyl)propanamido)butanamide (11a-b, RWJ-58259)
Part 1: Coupling reaction
Aniline 9 (40 mg, 0.11 mmol) was added to an oven-dried round bottom flask with stir bar and sealed under nitrogen, then anhydrous THF (16 mL) was added. The solution was cooled in a NaCl/H2O bath (− 5 °C) for 15 min., and then both DMAP (34.6 mg, 0.282 mmol) and triphosgene (12 mg, 0.04 mmol) were added consecutively. Immediately the reaction became a light orange suspension. The reaction was stirred at − 5 °C for 8 min., and then amine 4 (35 mg, 0.071 mmol) was added and the reaction was stirred at − 5 °C for 1 h, then for an additional 1 h while warming to room temperature. A sample aliquot was taken from the reaction, concentrated under reduced pressure, dissolved in a minimal amount of HPLC grade MeCN, and analyzed with LC-MS to confirm reaction completion. The reaction was concentrated under reduced pressure to give crude material 10 that could be either carried onto the next reaction without purification, or triturated with DCM/hexanes (1: 1) to provide purer material.
Part 2: Boc removal
The round bottomed flask already containing either the crude or triturated material 10 was cooled in a NaCl/H2O bath for 10 min (− 5 °C), and then HCl in dioxane (4 M, 3 mL) was slowly added. The reaction immediately became a heterogeneous dark red mixture and was stirred for 40 min. at − 5 °C. A sample aliquot was taken from the reaction, concentrated under reduced pressure, dissolved in a minimal amount of HPLC grade MeCN, and analyzed with LC-MS to confirm reaction completion. The reaction was concentrated under reduced pressure to give a red–orange solid that was free-based with 0.075 N NH3 in MeOH and concentrated under reduced pressure. The crude product was dissolved in a minimal amount of DCM, loaded onto a 10 g normal phase silica column, and purified with flash chromatography (0–18% (0.75 N NH3 in MeOH)/DCM,) to give amine 11 (free base) as a light pink oily solid. The product was converted to the bis HCl salt 11a by adding 1 N HCl (1 mL) and lyophilizing overnight to give bis HCl salt as a light pink solid. LC-MS Data tR = (Characterization Method A); m/z = 396.65 [(M/2) + H+], 835.30 (M - H+, formic acid adduct); 1H NMR (400 MHz, CD3OD, free base) δ = 7.98 (s, 1H), 7.75 (d, J = 8.7 Hz, 1H), 7.45–7.38 (m, 2H), 7.37–7.05 (m, 10H), 5.56 (br. s., 2H), 4.64 (s, 2H), 4.60–4.48 (m, 2H), 4.40 (d, J = 4.5 Hz, 2H), 3.57–3.45 (m, 2H), 3.29–3.12 (m, 3H), 3.12–2.93 (m, 3H), 2.35–2.20 (m, 1H), 2.15–1.85 (m, 5H); 13C NMR (75 MHz, CD3OD, free base) δ = 173.3, 171.0, 156.2, 141.7, 139.0, 138.2, 136.6, 135.1, 134.3, 131.4, 130.3, 128.3, 128.1, 126.9, 126.7, 125.6, 119.7, 118.3, 118.1, 117.8, 117.0, 116.7, 115.2, 97.4, 55.6, 53.5, 51.0, 48.8, 42.6, 36.8, 36.6, 29.5, 22.6. Alternatively, the crude product could be dissolved in DMSO, filtered, and purified in batches with preparative HPLC (method A). Pooled fractions were concentrated under reduced pressure in lukewarm water (to remove MeCN) and lyophilized overnight to give 11b (36.3 mg) as a light pink oil in 58% yield over 2 steps.
4.4.9. N-((S)-4-(Benzylamino)-3-((S)-2-(3-(1-(2,6-dichlorobenzyl)-3-(pyrrolidin-1-ylmethyl)-1H-indazol-6-yl)ureido)-3-(3,4-difluorophenyl)propanamido)-4-oxobutyl)pent-4-ynamide (12, DG-207)
Note
If using 11b, it is necessary to convert this compound to the bis HCl salt (11a) prior to performing this EDC coupling reaction as it has been seen that the formate salt will give a mixture of products. To a 5 mL scintillation vial with stir bar was added 11b (5.5 mg, 6.4 μmol). The vial was purged with N2 for 5 min and then dry dioxane (0.5 mL) and 4 M HCl in dioxane (0.3 mL, 172 eq.) was added. The reaction was stirred for 5 min, concentrated under reduced pressure, and then lyophilized overnight to give the bis HCl salt (11a). The vial containing 11a was purged with nitrogen and then dissolved in dry DMF (0.5 mL). 4-Pentynoic acid (1 mg, 10 μmol), HOBt (1.2 mg, 8.9 μmol), EDC· HCl (3 mg, 12 μmol), and DIPEA (9.6 μL, 55 μmol) were added consecutively and the reaction was stirred for 5 h under N2. A sample aliquot was taken from the reaction, diluted with a minimal amount of HPLC grade MeCN, and analyzed with LC-MS to confirm reaction completion. The reaction was diluted with EtOAc (5 mL) and washed with saturated NaHCO3 (5 mL × 2) and brine (5 mL × 2). The organic layer was dried over MgSO4, filtered, and concentrated under reduced pressure to give crude material that was dissolved in DMSO, filtered, and purified with preparative HPLC (method A) to give 12 (2.4 mg) as a colorless oily residue in 47% yield. 1H NMR (600 MHz, CD3OD) δ = 8.54 (br. s, 1H, formate CHO), 7.94 (d, J = 1.2 Hz, 1H), 7.67 (d, J = 8.8 Hz, 1H), 7.44 (s, 1H), 7.42 (s, 1H), 7.33 (dd, J = 1.2, 7.6 Hz, 1H), 7.28–7.11 (m, 7H), 7.09–7.05 (br m, 1H), 6.99 (dd, J = 1.8, 7.0 Hz, 1H), 5.61 (dd, J = 14.1, 2.3 Hz, 2H), 4.55 (dd, J = 2.9, 5.3 Hz, 1H), 4.44–4.41 (m, 1H), 4.39 (s, 2H), 4.37–4.34 (br. m, 2H), 3.58 (dd, J = 4.7, 6.5 Hz, 1H), 3.51 (dd, J = 4.7, 6.5 Hz, 1H), 3.20–3.13 (m, 2H), 3.12–3.04 (br s, 3H), 2.99 (dd, J = 5.9, 8.2 Hz, 1H), 2.41–2.37 (m, 2H), 2.34–2.29 (m, 2H), 2.21–2.20 (m, 1H), 2.07–1.98 (m, 2H), 1.93–1.86 (m, 4H). 19F NMR (376 MHz, DMSOd6) δ = -139.53, -142.40; 13C NMR (101 MHz, DMSO-d6) δ = 171.6, 171.5, 170.6, 164.5, 155.1, 150.2 (dd, J = 58.7, 12.2 Hz), 147.8 (dd, J = 58, 12.2 Hz), 142.4, 141.7, 139.6, 139.3, 136.4, 135.69, 135.67, 132.3, 131.0, 129.1, 128.6, 127.4, 127.1, 126.6, 121.3, 118.7 (d, J = 16.8 Hz), 118.1, 117.2 (d, J = 16.8 Hz), 113.7, 96.6, 84.1, 71.7, 63.4, 54.0, 53.7, 51.4, 47.2, 42.4, 37.9, 36.2, 34.6, 32.4, 23.5, 14.6. LC-MS tR = 3.46 min (Characterization Method A); m/z = 871.15 (M+H+), m/z = 915.30 (M–H+, formic acid adduct). HRMS (ESITOF) calcd. for C45H47Cl2F2N8O4 (M+H+) 871.3060, found 871.2988.
4.5. General procedures for the syntheses of parmodulins and Fairlie’s PAR2 antagonist (32, TJF-5)
4.5.1. Method A: Amide coupling using EDC
To a round bottomed flask with stir bar under nitrogen were added the appropriate carboxylic acid and anhydrous DCM/DMF (85: 15; 0.2–0.6 M). The amine HCl salt to be coupled (1.2 eq.), HOBt (1.2 eq.), EDC· HCl (1.2 eq.), and DIPEA (2.1 eq.) were added and the reaction was stirred under nitrogen. The reaction was diluted with DCM (75 mL), washed with saturated NaHCO3, 1M HCl (30 mL), brine, dried over Na2SO4, filtered, and concentrated under reduced pressure to give crude product.
4.5.2. Method B: Formation and acylation with acid chloride
To an oven-dried round bottomed flask with stir bar under nitrogen were added the carboxylic acid, dry DCM, and 3 Å molecular sieves. Oxalyl chloride (1.2 eq.) and a catalytic amount of DMF (1–2 mol%) were added and the reaction was stirred while attached to a bubbler (to monitor production of CO2) at 20 °C for 2–3 h. The amine HCl salt (1 eq.) in DCM and DIPEA (2 eq.) were added and the reaction was stirred under nitrogen for 3–6 h. The reaction was diluted with EtOAc and washed with half-saturated aqueous NaHCO3, 1 M HCl (30 mL), brine, dried over Na2SO4, filtered, and concentrated under reduced pressure to give crude material.
4.5.3. Method C: Acylation with acid chloride
To an oven-dried round bottomed flask with stir bar and under nitrogen were added the acid chloride, dry DCM, and 3 Å molecular sieves. The amine HCl salt (1 eq.) in DCM and DIPEA (2 eq.) were added and the reaction was stirred under nitrogen for 3–6 h. The reaction was diluted with EtOAc and washed with half-saturated aq. NaHCO3, 1 M HCl (30 mL), brine, dried over Na2SO4, filtered, and concentrated under reduced pressure to give crude product.
4.5.4. Method D: Amide coupling using HATU
To a round bottomed flask with stir bar under nitrogen was added the carboxylic acid and anhydrous DCM. The amine (1.2 eq.), HATU (1.2 eq.), and DIPEA (1.2 eq.) were added and the reaction was stirred under nitrogen. The reaction was diluted with DCM (75 mL) and washed with saturated NaHCO3, 1 M HCl (30 mL), brine, dried over Na2SO4, filtered, and concentrated under reduced pressure to give crude material.
4.5.5. Method E: Boc removal
To an 8 mL vial with stir bar and under nitrogen was added the Boc-protected amine, dry DCM, and a large excess of TFA. The reaction was allowed to stir at 20 °C for 1–2 h. The reaction mixture was concentrated under reduced pressure (passed through a base trap) to give crude material that was suspended in EtOAc and washed with half-saturated aq. NaHCO3, and brine. The reaction was dried over Na2SO4, filtered, and concentrated under reduced pressure to give crude material that was carried onto the next peptide coupling step without further purification.
4.6. Synthesis of parmodulins
4.6.1. 2-Bromo-N-(3-propionamidophenyl)benzamide (18, EMG-21)
Analogue 18 (EMG-21) was synthesized by coupling of aniline-HCl salt 15 with propionic acid (16 uL, 0.20 mmol) according to general method A. The crude material was loaded using Celite onto a 5 g silica gel column and purified by flash chromatography (EtOAc: hexanes, 0–100%) to give 18 as an off-white solid (19 mg) in 32% yield. LC-MS tR = 4.47 min (Characterization Method A); m/z = 348.70 (M+H); 1H NMR (300 MHz, CD3OD) δ = 7.98 (t, J = 2.0 Hz, 1H), 7.69 (dd, J = 7.9, 1.1 Hz, 1H), 7.56–7.43 (m, 2H), 7.42–7.35 (m, 3H), 7.29 (t, J = 8.0 Hz, 1H), 2.39 (q, J = 7.6 Hz, 2H), 1.20 (t, J = 7.6 Hz, 3H); HRMS (ESI): m/z [M+H]+ calcd. for C16H15N2O2Br, 347.0390; found, 347.0357. This compound was previously obtained from commercial sources.12
4.6.2. 2-Bromo-N-(3-pentanamidophenyl)benzamide (19, EMG-23)
Analogue 19 was synthesized by amide coupling of pentanoyl chloride (22 μL, 0.19 mmol) with aniline· HCl salt 15 according to general method C. The crude material was then dry loaded using Celite onto a 5 g silica gel column and purified by flash chromatography (EtOAc: hexanes, 0–100%) to give 19 as an off white solid (25 mg) in 39% yield. LC-MS tR = 5.12 min (characterization method A); m/z = 376.75 (M+H+); 1H NMR (300 MHz, CD3OD) δ = 7.99 (t, J = 2.0 Hz, 1H), 7.69 (dd, J = 7.9, 1.0 Hz, 1H), 7.56–7.43 (m, 2H), 7.42–7.34 (m, 3H), 7.29 (t, J = 8.0 Hz, 1H), 2.38 (t, J = 7.3 Hz, 2H), 1.73–1.68 (m, 2H), 1.41 (app sxt, J = 7.3 Hz, 2H), 0.97 (t, J = 7.3 Hz, 3H); HRMS (ESI): m/z [M+H]+ calcd. for C18H19N2O2Br, 375.0703; found, 375.0669. This compound was previously obtained from commercial sources.12
4.6.3. 2-Bromo-N-(3-(pent-4-ynamido)phenyl)benzamide (20, RR-10)
Alkyne analog 20 was synthesized by acylation of pent-4-ynoic acid (50 mg, 0.51 mmol) with aniline· HCl salt 15 according to general method B. The crude material was dissolved in a minimal amount of DCM, loaded onto a 10 g silica column, and purified by flash chromatography (EtOAc: hexanes, 0–100%) to give 20 as a white solid (13 mg) in 7% yield. LC/MS tR = 6.44 min (characterization method A); m/z = 372.60 (M+H+); 1H NMR (400 MHz, CDCl3) δ = 7.95 (s, 1H), 7.71 (s, 1H), 7.67–7.58 (m, 2H), 7.52 (br s., 1H), 7.46–7.27 (m, 5H), 2.66–2.52 (m, 4H), 2.09–2.05 (m, 1H); 13C NMR (75 MHz,CDCl3, 1% CD3OD) δ = 170.5, 167.0, 138.8, 138.4, 133.5, 131.6, 129.6, 129.2, 127.7, 119.6, 116.4, 116.1, 111.7, 83.0, 69.5, 36.0, 14.8. HRMS (ESI) calcd. for C18H15BrN2O2 (M+H+), 371.0390, found 371.0364.
4.6.4. N-(3-Aminophenyl)butyramide HCl salt (23)
A solution of nitroarene 22 (5.95 g, 28.7 mmol) in MeOH (85 mL) was flushed with nitrogen for 5 min. To a 10 mL scintillation vial under nitrogen was suspended 10% Pd/C (0.95 g, 0.88 mmol) in MeOH/H2O (4: 1) and the resultant suspension was added to the solution of 22. A balloon was filled with H2 gas and inserted into the flask and the reaction was purged with H2 gas for 2 min. The reaction was left to stir under a full balloon of H2 for 16 h, after which an aliquot was taken from the reaction, filtered through Celite and cotton, and concentrated under reduced pressure. The aliquot was dissolved in a minimal amount of HPLC grade MeCN, and analyzed with LC-MS to confirm reaction completion. The reaction was filtered through a funnel packed with Celite. The filter cake was washed with MeOH and the filtrate was concentrated under reduced pressure, to give crude material that was dissolved in DCM and added to 0.9 M HCl in ether (40 mL). The reaction was stirred for 5 min at 20 °C to give a precipitate that was filtered and washed with excess DCM. The precipitate was dried to give the previously described aniline 2312 (5.60 g) as a grey solid in 92% yield.
4.6.5. 2-Azido-N-(3-butyramidophenyl)benzamide (26, DG-5)
Part 1: Diazotization
To a round bottomed flask with stir bar was added 2-aminobenzoic acid 24 (1.50 g, 10.9 mmol) and deionized H2O (100 mL). The reaction was cooled to 0 °C and conc. aq. HCl (5 mL) was added dropwise over 5 min. A solution of NaNO2 (0.75 g, (11 mmol) in H2O (1 mL) was added, and the reaction was stirred for 10 min. at 2 °C. A solution of NaOAc (0.63 g, 11 mmol) in H2O (1 mL) and a solution of NaN3 (0.71 g, 10.9 mmol) in H2O (1 mL) were added consecutively and the reaction was stirred for 30 min at 2 °C. A sample aliquot was taken from the reaction, diluted with TBME, extracted and the organic phase was separated, concentrated under reduced pressure, dissolved in a minimal amount of HPLC grade MeCN, and analyzed with LC-MS to confirm reaction completion. The reaction was extracted with TBME (100 mL) and the organic layer was washed with brine, dried over Na2SO4, filtered, and concentrated under reduced pressure to give 2-azidobenzoic acid 25 (1.5 g) as a yellow solid in 85% yield. TLC: mobile phase: Ethyl acetate/hexanes/formic acid (25/25/1), Rf: 0.4; 1H NMR (300 MHz, CDCl3) δ = 8.19–8.14 (m, 1H), 7.67–7.59 (m, 1H), 7.29 (dd, J = 2.0, 7.3 Hz, 2H).
Part 2: Acylation
Crude azide analog 26 was synthesized by acylation of aniline· HCl salt 23 with 2-azidobenzoic acid 25 according to general method B. The crude material was dissolved in a minimal amount of DCM, loaded onto a 25 g column, and purified with flash chromatography (EtOAc/hexanes, 0–80%) to give 26 (160 mg) as a colorless oil in 80% yield. TLC: mobile phase: ethyl acetate/hexanes (50: 50), Rf: 0.6; LC/MS tR = 5.01 min (characterization method A); m/z = 323.80 (M+H+) 368.00 (M+formate); 1H NMR (400 MHz, CDCl3) δ = 9.36 (br. s., 1H), 8.26–8.19 (m, 1H), 7.98 (br. s., 1H), 7.61–7.50 (m, 1H), 7.41 (d, J = 7.6 Hz, 2H), 7.36–7.23 (m, 5H), 2.33 (t, J = 7.4 Hz, 2H), 1.76 (app sxt, J = 7.4 Hz, 2H), 0.99 (t, J = 7.3 Hz, 3H); 13C NMR (101 MHz, CDCl3) δ = 162.7, 138.6, 138.4, 136.9, 132.1, 129.6, 125.4, 118.4, 115.6, 111.6, 39.7, 19.0, 13.7; HRMS calcd. for C17H17N5O2 (M+H+) 324.1455, found 324.1415.
4.7. Synthesis of TJF-5
4.7.1. tert-butyl ((2S,3S)-1-((2-Methoxybenzyl)amino)-3-methyl-1-oxopentan-2-yl)carbamate (28)
Analogue 28 was synthesized by peptide coupling of (2S,3S)-2-(tert-butoxycarbonylamino)-3-methyl-pentanoic acid 27 (81 mg, 0.35 mmol) with (2-methoxybenzylamine (38 μL, 0.29 mmol) according to general method D. The crude material was dissolved in a minimal amount of DCM, loaded onto a 10 g silica gel column, and purified by flash chromatography (EtOAc/hexanes, 0–100%) to give 2848 (62 mg) as a white foam in 51% yield. 1H NMR (300 MHz, CDCl3) δ = 7.24 (d, J = 7.4 Hz, 1H), 6.93–6.83 (m, 2H), 6.44 (br s, 1H), 5.16 (br s, 1H), 4.43 (ddd, J = 6.3, 8.6 Hz, 2H), 3.92 (t, J = 7.0 Hz, 1H), 3.84 (s, 3H), 2.05–1.78 (m, 1H), 1.41 (s, 9H), 1.14–1.01 (m, 1H), 0.87 (t, J = 7.2 Hz, 6H).
4.7.2. tert-butyl ((S)-3-Cyclohexyl-1-(((2S,3S)-1-((2-methoxybenzyl) amino)-3-methyl-1-oxopentan-2-yl)amino)-1-oxopropan-2-yl)carbamate (30)
Part 1. Boc removal
Intermediate 28 was deprotected to give 29 according to general method E and was advanced to the amide coupling step.
Part 2. Amide coupling
Analogue 30 was synthesized from 29 (29.0 mg, 0.12 mmol) and (2S)-2-(tert-butoxycarbonylamino)-3- cyclohexyl-propanoic acid hydrate (40 mg, 0.14 mmol) according to general method D. The crude material was dissolved in a minimal amount of DCM, loaded onto a 10 g silica gel column, and purified by flash chromatography (MeOH/DCM, 0–12%) to give 3048 (51 mg) as a white solid in 37% yield over 2 steps. 1H NMR (300 MHz, CDCl3) δ =7.23 (d, J = 7.6 Hz, 2H), 6.89 (q, J = 7.6 Hz, 2H), 6.69 (d, J = 8.8 Hz, 1H), 6.56–6.46 (m, 1H), 4.90 (br d, J = 7.3 Hz, 1H), 4.42 (ddd, J = 9.7, 16.4 Hz, 2H), 4.25 (t, J = 8.8 Hz, 1H), 3.84 (s, 3H), 3.07 (s, 1H), 2.95 (s, 1H), 1.75–1.55 (m, 8H), 1.48–1.35 (m, 15H), 1.23–1.01 (m, 6H).
4.7.3. N-((S)-3-Cyclohexyl-1-(((2S,3S)-1-((2-methoxybenzyl)amino)-3-methyl-1-oxopentan-2-yl)amino)-1-oxopropan-2-yl)isoxazole-5-carboxamide (32)
Part 1. Boc removal
Intermediate 30 was deprotected to give free amine 31 according to general method E and advanced to the amide coupling step.
Part 2. Amide coupling
Crude 32 (TJF-5) was synthesized from amine intermediate 31 (21.5 mg, 0.05 mmol) and isoxazole-5-carboxylic acid (7.3 mg, 0.06 mmol) according to general method D. The crude material was dissolved in a minimal amount of DCM, loaded onto a 10 g silica gel column, and purified by flash chromatography (MeOH/DCM, 0–5%) to give 3248 (9.1 mg) as a white solid in 16% yield over 2 steps. LC/MS tR = 6.46 min (Characterization Method A); m/z = 499.00 (M+H+), 521.00 (M+Na+), 498.25 (M - H+), 543.25 (M+formic acid adduct); 1H NMR (300 MHz, CDCl3) δ = 8.32 (d, J = 1.5 Hz, 1H), 7.30 (s, 1H), 7.33–7.21 (m, 1H), 6.96–6.82 (m, 4H), 6.46 (app t, J = 5.6 Hz, 1H), 4.74 (dd, J = 8.5 Hz, 1H), 4.44 (ddd, J = 8.8, 20.8 Hz, 2H), 4.27 (t, J = 7.6 Hz, 1H), 3.86 (s, 3H), 1.89–1.73 (m, 3H), 1.72–1.58 (m, 7H), 1.52–1.38 (m, 1H), 1.37–1.24 (m, 2H), 1.22–1.02 (m, 4H), 0.98–0.88 (m, 2H), 0.88–0.79 (m, 6H).
4.8. General Information: Assays
Water for solutions was deionized and filtered through charcoal (Milli-Q by Millipore) to a resistance of 18 MΩ . TFLLRN-NH2 (PAR1 agonist) was obtained from AnaSpec (cat# AS-62937) or was synthesized (as the TFA salt) by Trudy Holyst, Blood Research Institute Protein Chemistry Core. SFLLRN-NH2 (TFA salt) (PAR1/2 agonist) was obtained from Bachem (cat# H-2936.0005) or was synthesized (as the TFA salt) by Trudy Holyst, Blood Research Institute Protein Chemistry Core. SLIGKV-NH2 (TFA salt) (PAR2 agonist) was obtained from Bachem (cat# H-5042.0025) or AnaSpec (cat# AS- 60217-1). AYPGFK-NH2 (TFA salt) (PAR4 agonist) was obtained from AnaSpec (cat# AS-60218-1). Atopaxar (E5555 HBr) was obtained from Axon Medchem (cat# 2030). Vorapaxar (SCH 530348) was obtained from Axon Medchem (cat# 1755). Q94 (HCl) was obtained from Axon Medchem (cat# 2055).
Adherent EA.hy926 cells (ATCC CRL-2922) were used for all assays performed. The cells were cultured using the suggested protocol from the manufacturer (ATCC), except that 150 cm2 tissue culture flasks were used, and DMEM complete media was prepared as described below. Cells were frozen in 40% fetal bovine serum (FBS), 50% complete media, and 10% DMSO in liquid nitrogen, and used between passages 2 and 11. All manipulations prior to the assays were performed in a sterile laminar flow cell culture hood.
Cell counting was performed with an automated cell counter (Countess, Invitrogen) using Invitrogen cell counting chamber slides and trypan blue stain. All assays were run in 96-well plates (Corning Costar #3603, polystyrene black wall, clear bottom). Unless otherwise noted, media exchanges with 96-well plates were performed using an automated liquid handler (Beckmann- Coulter, Biomek 3000) with 220 μL pipette tips. Cells were imaged with an EVOS Fl inverted microscope. All assays were run on a multimode plate reader (Perkin Elmer EnSpire). Data was exported to Microsoft Excel for nominal processing then analyzed with Graph-Pad Prism (versions 5 or 6).
4.9. Preparation of stock solutions
Complete cell media (for EA.hy926 cells). Dulbecco’s Modified Eagle Medium (DMEM) with 4.5 g/L glucose (500 mL) was supplemented with 200 mM L-glutamine (10 mL, 4 mM final conc.), 100 mM sodium pyruvate (2.5 mL, 1 mM final conc.), 7.5% (w/v) sodium bicarbonate (5.0 mL, 0.75 g/L final conc.), 100× penicillin and streptomycin (Corning #30-002-CI, 2.0 mL) and heat inactivated FBS (50 mL). The prepared media was stored in a refrigerator (5 °C) until needed.
4.9.1. Probenecid solution (250 mM, aqueous)
Probenecid (Alfa Aesar, catalog #B20010-88, 36 mg) was added to a 1 mL microcentrifuge tube and dissolved in 0.6 M NaOH (500 μL). NaOH (0.6 M) was prepared by dissolving NaOH (480 mg) in H2O (20 mL). This solution was made the day of the experiment and was sufficient for up to 50 mL of buffer (for one 96-well plate).
4.9.2. HBSS-HEPES wash buffer
HEPES (1.19 g) was added to a 500 mL bottle of Ca/Mg/phenol red-free HBSS to make a 10 mM solution in HEPES. MgCl2 (1 M solution, 500 μL) and CaCl2 (1 M solution, 500 μL) were added and the solution was stored in the refrigerator. Before use, the desired amount (46 mL total per 96 well plate) was warmed to room temperature and added to a 50 mL centrifuge tube, then supplemented with 250 mM probenecid solution (1: 100, i.e. 46 mL of buffer needs 460 μL of probenecid solution) to give a 2.5 mM probenecid solution. The pH was adjusted to 7.4 if necessary by adding aq. HCl.
4.9.3. 10% Pluronic F-127 in DMSO
Pluronic F-127 (Sigma Aldrich, 20 mg) was added to a 1 mL microcentrifuge tube and dissolved with DMSO (200 μL), to make a 10% w/v solution. This solution was stored at room temperature.
4.9.4. Fluo-4/AM loading buffer
Fluo-4/AM (Invitrogen via Fisher, catalogue # F23917, 50 μg) was dissolved in DMSO (24 μL), then 6 μL of the solution (light-sensitive) was transferred to a 200 μL microcentrifuge tube and mixed with 6 μL of 10% pluronic F-127 in DMSO (sufficient for 1 96-well plate). The remainder of the Fluo-4/AM solution was stored in the freezer at − 30 °C. The solution was then transferred to a foil-covered 14 mL centrifuge tube already containing HBSS–HEPES wash buffer (6 mL) and vortexed for 5 s. 50 μL of this prepared dye solution (2 μM) can be added to each well of a 96-well plate containing adherent cells.
4.10. Preparation of agonist/antagonist solutions
Prior to the assay, stock solutions of PAR1 and PAR2 agonists were prepared by dissolving the agonists in 100% H2O (sterile, deionized) to give stock solutions (10 mM, 5 mM, or 1 mM depending on agonist). These were aliquoted into sterile microcentrifuge tubes and stored in a − 30 °C freezer, and thawed before use. Stock solutions of antagonists were prepared by dissolving with 100% DMSO, generally in glass vials, to give stock solutions (31.6 mM, 10 mM, or 1 mM depending on antagonist used) that were stored in the freezer at − 30 °C, and thawed in a desiccator before use.
Agonist solutions
Prepared as 10 mM stock solutions in 100% water (sterile, deionized). Diluted solutions were then prepared with water to give half log concentrations.
Antagonist solutions
Vehicle (diluent) was prepared by mixing 1: 9 DMSO: HBSS-HEPES wash buffer. An aliquot from the antagonist stock solution (in 100% DMSO) was then diluted 10× with vehicle to give a 10% DMSO solution, then subsequent dilutions were made with vehicle to give a consistent concentration of DMSO (10%).
4.11. Protocol for calcium mobilization assay with adherent endothelial cells
4.11.1. Part 1. Cell preparations (Aseptic Conditions)
Unless otherwise noted, cells were plated at 25,000 cells per well in 100 μL, which corresponds to 250,000 cells/mL. Complete cell media (25 mL per plate) was transferred to a 50 mL centrifuge tube and warmed to 37 °C in a water bath. A vial of frozen EA. hy926 cells (ATCC CRL-2922) was taken from liquid N2 storage and warmed to 37 °C in a water bath for 5 min. Complete cell media (1 mL) was added dropwise to the vial and the contents were mixed and transferred to a 14 mL centrifuge tube. The cells were centrifuged at 130g for 3 min and the supernatant was removed via aspiration with a Pasteur pipet. The cells were re-suspended in complete cell media (2 mL) and the suspension was mixed thoroughly with a pipette to gently break up the cell pellet to give an evenly distributed suspension in the tube. A small fraction of this suspension (25 μL) was mixed with 25 μL of trypan blue solution and a cell count was taken. Based on the cell count, an appropriate volume of complete cell media was added to the 2 mL of cell suspension to assure that each well of the 96-well plate would have 25,000 cells. The suspension was gently mixed, and the contents of the tube were slowly poured into a sterile disposable pipetting reservoir. This suspension containing the cells was then added (column by column, 100 μL per well) to a 96-well plate (Corning Costar #3603, black wall, clear bottom) with a multichannel pipette. The plate was gently rocked back and forth to get even coverage of cells and the plate was incubated at 37 °C (5% CO2) for 40–48 h.
4.11.2. Part 2. Loading of Fluo-4 dye
The 96-well plate was removed from the incubator after 40–48 h and then checked with an EVOS Fl microscope and optionally imaged (20× magnification) to confirm that cells were >80% confluent and viable. Note: All media exchanges were performed with the Biomek 3000, unless otherwise noted. The complete cell media was removed and HBSS–HEPES wash buffer (100 μL) was added to each well. The plate was left to sit at room temperature for 5 min. to allow the probenecid to be absorbed, then the media was removed. Fluo-4/AM solution (50 μL per well) was added (in the dark), and the plate was incubated at 37 °C (5% CO2) for 40–50 min. The dye solution was removed from each well and the wells were washed with HBSS–HEPES wash buffer (50 μL/well) twice. HBSS-HEPES wash buffer (200 μL/well) was added to each well and the plate was imaged with the EVOS Fl microscope (20× magnification) to verify that the dye has been absorbed into the cells.
4.11.3. Part 3. Running the assay
Basic plate reader info and settings:
Instrument: Perkin Elmer EnSpire plate reader Temperature: 37 °C
Excitation wavelength: 485 nm
Emission wavelength: 525 nm
Measurement height: 7.8 mm (optimized)
Number of flashes: 100
Number of repeats: 250, every 5 s. Experiment was halted after the emission signal started to decrease from the maximum.
Vehicle or antagonist (2 μL) were added (single or multichannel pipette) to each well, and the plate was incubated in the plate reader for 15 min at 37 °C. Assays were performed 2 columns at a time, by adding agonist solutions (2 μL) to 16 wells, and then immediately starting the scanning in the plate reader. Plate readers that measure wells concurrently could optionally support assays with all agonists added concurrently, for higher throughput. Upon starting the assay, the basal level of the 2 columns was measured (20 scans) prior to the addition of the agonist. The agonist (2 μL) was then added (over 10 s with a multichannel pipette or over 90–120 s with a single channel pipette), and the wells were analyzed with the plate reader using the settings above.
4.11.4. Part 4. Data analysis
Concentration-response curves were obtained by measuring the maximal increase in emission intensity (Δ Relative Fluorescence Units, RFU) from basal levels (average of 20 scans prior to agonist addition), then dividing by the average basal levels to give Δ RFU/basal. From this data,% stimulation was obtained by normalizing Δ RFU/basal for each column of the plate with a control well from the same column where vehicle had been added instead of antagonist solution. The Δ RFU/basal value from the vehicle well was considered to be 100% stimulation for each column. This normalization was necessary due to increasing background signal over time, presumably due to dye efflux. Data (% stimulation versus log concentration) was then plotted for 3 or more repetitions and analyzed using GraphPad Prism (versions 5 or 6). All concentration-response curves were fitted using 4-variable non-linear regression, showing the standard error of the mean (SEM) for each concentration.
4.12. Reversibility assay protocol
4.12.1. Part 1. Preparation of plate for assay
Cell preparations (under aseptic conditions), loading of probenecid and Fluo-4 dye, the washing/removal of dye, and the replacement with HBSS-HEPES buffer solution (200 μL) were performed as detailed above.
4.12.2. Part 2. Wash procedure
Vehicle or antagonist (2 μL) was added to the wells of interest (already containing 200 μL of HBSS-HEPES wash buffer) and the plate was incubated in the plate reader for 20–30 min. The wash buffer was carefully removed from the wells with a multichannel pipette, replaced with fresh HBSS-HEPES wash buffer (200 μL) and incubated in the plate reader for 10 min. at 37 °C. Wash buffer was carefully removed from the wells again with a multichannel pipette and replaced with fresh HBSS-HEPES wash buffer (200 μL). The plate was incubated again in the plate reader for 10 min., then the assay was performed according to the regular protocol above. Note that the washing steps can alternatively be performed with the automated liquid handler.
Acknowledgments
We thank Irene Hernandez and Dr. Hartmut Weiler (Blood Research Institute) for assisting with cell culture and providing access to reagents, equipment and facilities; Trudy Holyst (Blood Research Institute) for assisting with plate reader operation and troubleshooting, and for providing quantities of PAR agonists used in our studies; Dr. Omoz Aisiku, Dr. Karen De Ceunynck, and Dr. Robert Flaumenhaft (Beth Israel Deaconess Medical Center) for helpful discussions; Dr. Sheng Cai (Marquette University) for assistance with LC-MS and NMR instruments; ACD Labs and ChemAxon Inc. for NMR processing and prediction software; Shimadzu Inc. for a grant to support the purchase of the LC-MS used to support synthetic chemistry efforts, Marquette University for startup funding and research grants for D.G., K.K., and T.F., and the National Heart, Lung, and Blood Institute (R15HL127636) for support of our research program.
Footnotes
Author contributions
D.M.G.: Synthesized parmodulins; validated and completed the synthesis of RWJ-58259 and derivatives; developed the calcium mobilization assay; assayed compounds; trained and mentored junior contributors; wrote sections of the S.I. and manuscript; M. W.M.: Validated and completed the synthesis of RWJ-58259 and derivatives; developed the calcium mobilization assay; assayed compounds; wrote sections of the S.I. and manuscript; R.R.: Synthesized parmodulins, trained and mentored junior contributors. K.K.: Assisted with the synthesis of RWJ-58259. T.J. F.: Synthesized Fairlie’s PAR2 antagonist. E.G.: Synthesized parmodulins. C.D.: Conceived the project; developed the calcium mobilization assay; trained and mentored junior contributors; wrote the manuscript.
Notes
An earlier version of this manuscript was published at the preprint server ChemRxiv: https://doi.org/10.26434/chemrxiv.5907394.v1.
References
- 1.Coughlin SR. Nature. 2000;407:258–264. doi: 10.1038/35025229. [DOI] [PubMed] [Google Scholar]
- 2.Adams MN, Ramachandran R, Yau M-K, et al. Pharmacol Ther. 2011;130:248–282. doi: 10.1016/j.pharmthera.2011.01.003. [DOI] [PubMed] [Google Scholar]
- 3.Hamilton JR, Trejo J. Annu Rev Pharmacol Toxicol. 2017;57:349–373. doi: 10.1146/annurev-pharmtox-011613-140016. [DOI] [PubMed] [Google Scholar]
- 4.Vu T-KH, Hung DT, Wheaton VI, Coughlin SR. Cell. 1991;64:1057–1068. doi: 10.1016/0092-8674(91)90261-v. [DOI] [PubMed] [Google Scholar]
- 5.Hein L, Ishii K, Coughlin SR, Kobilka BK. J Biol Chem. 1994 [PubMed] [Google Scholar]
- 6.Chackalamannil S, Wang Y, Greenlee WJ, et al. J Med Chem. 2008;51:3061–3064. doi: 10.1021/jm800180e. [DOI] [PubMed] [Google Scholar]
- 7.O’Callaghan K, Kuliopulos A, Covic L. J Biol Chem. 2012;287:12787–12796. doi: 10.1074/jbc.R112.355461. [DOI] [PMC free article] [PubMed] [Google Scholar]
- 8.Gurbel PA, Bliden KP, Turner SE, et al. Arteriosclerosis. Thrombosis, Vascular Biol. 2016;36:189–197. doi: 10.1161/ATVBAHA.115.306777. [DOI] [PMC free article] [PubMed] [Google Scholar]
- 9.Wong PC, Seiffert D, Bird JE, et al. Sci Transl Med. 2017;9:4. doi: 10.1126/scitranslmed.aaf5294. [DOI] [PubMed] [Google Scholar]
- 10.Ramachandran R, Noorbakhsh F, DeFea K, Hollenberg MD. Nat Rev Drug Discov. 2012;11:69–86. doi: 10.1038/nrd3615. [DOI] [PubMed] [Google Scholar]
- 11.Dowal L, Sim DS, Dilks JR, et al. Proc Natl Acad Sci. 2011;108:2951–2956. doi: 10.1073/pnas.1014863108. [DOI] [PMC free article] [PubMed] [Google Scholar]
- 12.Dockendorff C, Aisiku O, Verplank L, et al. ACS Med Chem Lett. 2012;3:232–237. doi: 10.1021/ml2002696. [DOI] [PMC free article] [PubMed] [Google Scholar]
- 13.Aisiku O, Peters CG, De Ceunynck K, et al. Blood. 2015;125:1976–1985. doi: 10.1182/blood-2014-09-599910. [DOI] [PMC free article] [PubMed] [Google Scholar]
- 14.Riewald M, Petrovan RJ, Donner A, Mueller BM, Ruf W. Science. 2002;296:1880–1882. doi: 10.1126/science.1071699. [DOI] [PubMed] [Google Scholar]
- 15.Cheng T, Liu D, Griffin JH, et al. Nat Med. 2003;9:338–342. doi: 10.1038/nm826. [DOI] [PubMed] [Google Scholar]
- 16.Feistritzer C, Lenta R, Riewald M. J Thromb Haemost. 2005;3:2798–2805. doi: 10.1111/j.1538-7836.2005.01610.x. [DOI] [PubMed] [Google Scholar]
- 17.Bae J-S, Yang L, Manithody C, Rezaie AR. Blood. 2007;110:3909–3916. doi: 10.1182/blood-2007-06-096651. [DOI] [PMC free article] [PubMed] [Google Scholar]
- 18.Kerschen EJ, Fernandez JA, Cooley BC, et al. J Exp Med. 2007;204:2439–2448. doi: 10.1084/jem.20070404. [DOI] [PMC free article] [PubMed] [Google Scholar]
- 19.Soh UJ, Trejo J. Proc Natl Acad Sci USA. 2011;108:E1372–E1380. doi: 10.1073/pnas.1112482108. [DOI] [PMC free article] [PubMed] [Google Scholar]
- 20.Madhusudhan T, Wang H, Straub BK, et al. Blood. 2012;119:874–883. doi: 10.1182/blood-2011-07-365973. [DOI] [PMC free article] [PubMed] [Google Scholar]
- 21.Schuepbach RA, Madon J, Ender M, Galli P, Riewald M. J Thromb Haemost. 2012;10:1675–1684. doi: 10.1111/j.1538-7836.2012.04825.x. [DOI] [PMC free article] [PubMed] [Google Scholar]
- 22.Mosnier LO, Sinha RK, Burnier L, Bouwens EA, Griffin JH. Blood. 2012;120:5237–5246. doi: 10.1182/blood-2012-08-452169. [DOI] [PMC free article] [PubMed] [Google Scholar]
- 23.Burnier L, Mosnier LO. Blood. 2013;122:807–816. doi: 10.1182/blood-2013-03-488957. [DOI] [PMC free article] [PubMed] [Google Scholar]
- 24.Liang HPH, Kerschen EJ, Hernandez I, et al. Blood. 2015;125:2845–2854. doi: 10.1182/blood-2014-11-610717. [DOI] [PMC free article] [PubMed] [Google Scholar]
- 25.Áinle FN, O’Donnell JS, Johnson JA, et al. J Biol Chem. 2011;286:1323–1330. doi: 10.1074/jbc.M110.159475. [DOI] [PMC free article] [PubMed] [Google Scholar]
- 26.Rothmeier AS, Ruf W. Semin Immunopathol. 2012;34:133–149. doi: 10.1007/s00281-011-0289-1. [DOI] [PubMed] [Google Scholar]
- 27.Bouwens E, Stavenuiter F, Mosnier LO. J Thromb Haemost. 2013;11:242–253. doi: 10.1111/jth.12247. [DOI] [PMC free article] [PubMed] [Google Scholar]
- 28.Hollenberg MD, Mihara K, Polley D, et al. British J Pharmacol. 2014;171:1180–1194. doi: 10.1111/bph.12544. [DOI] [PMC free article] [PubMed] [Google Scholar]
- 29.Bock F, Shahzad K, Vergnolle N, Isermann B. Thromb Haemost. 2014;111:610–617. doi: 10.1160/TH13-11-0967. [DOI] [PubMed] [Google Scholar]
- 30.Rezaie AR. Thromb Haemost. 2014;112:876–882. doi: 10.1160/TH14-02-0167. [DOI] [PMC free article] [PubMed] [Google Scholar]
- 31.Griffin JH, Zlokovic BV, Mosnier LO. Blood. 2015;125:2898–2907. doi: 10.1182/blood-2015-02-355974. [DOI] [PMC free article] [PubMed] [Google Scholar]
- 32.De Ceunynck K, Peters CG, Jain A, Higgins SJ, Aisiku O, Fitch-Tewfik JL, Chaudhry C, Dockendorff C, Parikh SM, Ingber DE, Flaumenhaft R. Proc Natl Acad Sci USA. 2018;115:E982–E991. doi: 10.1073/pnas.1718600115. [DOI] [PMC free article] [PubMed] [Google Scholar]
- 33.Nazir S, Gadi I, Al-Dabet MM, Elwakiel A, Kohli S, Ghosh S, Manoharan J, Ranjan F, Bock F, Braun-Dullaeus RC, Esmon CT, Huber TB, Camerer E, Dockendorff C, Griffin JH, Isermann B, Shahzad K. Blood. 2017;130:2664–2677. doi: 10.1182/blood-2017-05-782102. [DOI] [PMC free article] [PubMed] [Google Scholar]
- 34.Ahn K, Pan S, Beningo K, Hupe D. Life Sci. 1995;56:2331–2341. doi: 10.1016/0024-3205(95)00227-w. [DOI] [PubMed] [Google Scholar]
- 35.Dömötö r E, Benzakour O, Griffin JH, Yule D, Fukudome K, Zlokovic BV. Blood. 2003;101:4797–4801. doi: 10.1182/blood-2002-12-3680. [DOI] [PubMed] [Google Scholar]
- 36.Kuckleburg CJ, Newman PJ. Arteriosclerosis. Thromb Vasc Biol. 2013;33:275–284. doi: 10.1161/ATVBAHA.112.300474. [DOI] [PMC free article] [PubMed] [Google Scholar]
- 37.Barry GD, Suen JY, Le GT, Cotterell A, Reid RC, Fairlie DP. J Med Chem. 2010;53:7428–7440. doi: 10.1021/jm100984y. [DOI] [PubMed] [Google Scholar]
- 38.Asteriti S, Daniele S, Porchia F, et al. British J Pharmacol. 2012;167:80–94. doi: 10.1111/j.1476-5381.2012.01974.x. [DOI] [PMC free article] [PubMed] [Google Scholar]
- 39.Suen JY, Barry GD, Lohman RJ, et al. British J Pharmacol. 2012;165:1413–1423. doi: 10.1111/j.1476-5381.2011.01610.x. [DOI] [PMC free article] [PubMed] [Google Scholar]
- 40.Zhang H-C, Derian CK, Andrade-Gordon P, et al. J Med Chem. 2001;44:1021–1024. doi: 10.1021/jm000506s. [DOI] [PubMed] [Google Scholar]
- 41.Andrade-Gordon P, Maryanoff BE, Derian CK, et al. Proc Natl Acad Sci USA. 1999;96:12257–12262. doi: 10.1073/pnas.96.22.12257. [DOI] [PMC free article] [PubMed] [Google Scholar]
- 42.Zhang H-C, White KB, McComsey DF, et al. Bioorg Med Chem Lett. 2003;13:2199–2203. doi: 10.1016/s0960-894x(03)00325-1. [DOI] [PubMed] [Google Scholar]
- 43.Derian CK, Damiano BP, Addo MF, et al. J Pharmacol Exp Ther. 2003;304:855–861. doi: 10.1124/jpet.102.042663. [DOI] [PubMed] [Google Scholar]
- 44.Valdivielso ÁM, García-López MT, Herranz R. Arkivoc. 2008;2008:287. [Google Scholar]
- 45.Robinson E, Knight E, Smoktunowicz N, et al. Org Biomol Chem. 2016;14:3198–3201. doi: 10.1039/c6ob00332j. [DOI] [PubMed] [Google Scholar]
- 46.Meldal M, Tornøe CW. Chem Rev. 2008;108:2952–3015. doi: 10.1021/cr0783479. [DOI] [PubMed] [Google Scholar]
- 47.Suzuki S, Kotake M, Miyamoto M, Kawahara T, Kajiwara A, Hishinuma I, Okano K, Miyazawa S, Clark R, Ozaki F, Sato N, Shinoda M, Kamada A, Tsukada I, Matsuura F, Naoe Y, Terauchi T, Oohashi Y, Ito O, Tanaka H, Musya T, Kogushi M, Kawada T, Matsuoka T, Kobayashi H, Chiba K-I, Kimura A, Ono N. 2002/085855A1 WO.
- 48.Yau M-K, Liu L, Lim J, et al. Bioorg Med Chem Lett. 2016;26:986–991. doi: 10.1016/j.bmcl.2015.12.048. [DOI] [PubMed] [Google Scholar]
- 49.Tsien RY. Nature. 1981;290:527–528. doi: 10.1038/290527a0. [DOI] [PubMed] [Google Scholar]
- 50.Gopalakrishnan SM, Mammen B, Schmidt M, et al. J Biomol Screen. 2005;10:46–55. doi: 10.1177/1087057104270017. [DOI] [PubMed] [Google Scholar]
- 51.Tovey SC, Sun Y, Taylor CW. Nat Protoc. 2006;1:259–263. doi: 10.1038/nprot.2006.40. [DOI] [PubMed] [Google Scholar]
- 52.Zhang J, Chung T, Oldenburg K. J Biomol Screen. 1999;4:67–73. doi: 10.1177/108705719900400206. [DOI] [PubMed] [Google Scholar]
- 53.Zhang C, Srinivasan Y, Arlow DH, et al. Nature. 2012;492:387–392. doi: 10.1038/nature11701. [DOI] [PMC free article] [PubMed] [Google Scholar]
- 54.Flaumenhaft R, De Ceunynck K. Trends Pharmacol Sci. 2017;38:701–716. doi: 10.1016/j.tips.2017.05.001. [DOI] [PMC free article] [PubMed] [Google Scholar]


