

Abstract
INTRODUCTION
Examine associations between midlife cardiovascular health (CVH) and 20-year cognitive decline among Blacks and Whites.
METHODS
Midlife CVH metrics (American Heart Association’s Life’s Simple 7; LS7) were calculated and examined in relation to midlife and 20-year change in cognitive function among 13,270 Whites and Blacks from the Atherosclerosis Risk in Communities Cohort Study. We used linear mixed models to estimate adjusted associations of midlife CVH with midlife cognitive status and change.
RESULTS
Higher midlife (LS7) scores and individual metrics, particularly blood pressure and glucose, were associated with better midlife cognition and reduced 20-year decline. Midlife CVH 20-year neuroprotection was more pronounced among Whites than Blacks.
DISCUSSION
Better midlife CVH was associated with higher midlife and reduced decline in cognitive function 20-years later. However, the benefits of midlife CVH on cognition were stronger for Whites than for Blacks. Our findings suggest that improved midlife CVH may promote enduring cognitive health.
Keywords: Epidemiology, cognition, neurocognition, cardiovascular health, African Americans, Caucasians, Whites
INTRODUCTION
Cardiovascular disease (CVD) risk factors are modifiable determinants of heart disease and stroke,1 and are increasingly recognized as modifiable risks for cognitive decline and dementia in later life.2 This recognition stems from several population-level studies that have reported that midlife CVD risks (i.e., from medical histories) are associated with cognitive decline and dementia in later-life.3–8 A recent large randomized clinical trial reported that non-demented, but at-risk older Finnish adults maintained or improved cognitive function with 2-years of exercise, lifestyle (e.g., diet) and cognitive training interventions.9 Less is known from long-term cohort studies that examine how cardiovascular health and health behaviors in midlife shape cognitive function, decline and disorders into later life.10–12 This study uses a prospective cohort data to examine how cardiovascular health and health behaviors measured in midlife relate to cognitive function in later in life among African Americans and non-Latino Whites.
In 2010, the American Heart Association’s set goals to improve cardiovascular health (CVH) and reduce morbidity and mortality from CV disease by 20%. This comprehensive set of goals include seven behavioral (e.g., diet) and biomarker (e.g., cholesterol) components (aka Life’s Simple 7™; LS7) that can be combined to yield a CVH score.13 Higher LS7 scores are indicative of better CVH and are associated with reduced CVD incidence and other adverse health outcomes.14–16 Higher LS7 that are indicative of better CVH have been associated with more favorable cognitive function and lower incident cognitive impairment in diverse populations.17–19 Recently, higher LS7 was linked to lower rates of stroke and dementia among Whites.12 As such, it is possible that initiatives, like LS7, may have favorable by-products for cognitive health.
In this study, we examine cognitive function in relation to CVH among African Americans and Whites over a 20-year span of the Atherosclerosis Risk in Communities (ARIC) study. We hypothesized that higher midlife CVH (i.e., LS7 scores) would be associated with healthier brain function (i.e., cognitive performance) at midlife and across 20-years of ARIC follow-up.
METHODS
Participants/Data
A detailed description of the ARIC study has been published elsewhere.20 Briefly, ARIC is a prospective epidemiologic study conducted in four U.S. communities beginning in 1987. ARIC recruited 15,792 men and women aged 45-64 years, approximately 4,000 at each of four communities in the US from probability samples: Forsyth County, NC; Jackson, MS (African-Americans only); selected suburbs of Minneapolis, MN; and Washington County, MD. ARIC was designed as an observational longitudinal study of cardiovascular disease risk factors and sequelae. Batteries of cognitive assessments were administered for the ARIC cohort at Exam 2 (1990–1992; n=14,040), for a subset at exam 3 undergoing magnetic resonance imaging (MRI) (1994–1995: n=2,066), for the exam 4 cohort (1996–1999: n=11,027), for subsets of participants at two ancillary studies (Brain MRI: 2003–2006; n=1,121 and Carotid MRI: 2005–2006; n=2,013) and for the exam 5 cohort (2011–2013: n=6,199). Cognitive measures at each of these visits included the Delayed Word recall (DWR), Digit Symbol Substitution (DSS) test from the Wechsler Adult Intelligence Scale – Revised, and phonemic Word Fluency (WF). Detailed information about these cognitive tests has been previously published.21
Outcome Variables
In line with previous longitudinal work from ARIC,22–25 z-scores for each cognitive test were created at each testing occasion by scaling to their mean and standard deviation (SD) at baseline (1990–1992). The baseline means and standard deviations (SD) for DWR, DSS, and WF were 6.6 (1.5), 45.1 (14.1), and 33.4 (12.4), respectively. The means and standard deviations in the original metric as well as the standardized scores are presented in Supplemental Table 17. Consistent with previous studies in this cohort, the average of these 3 test-specific z scores was used to create a global longitudinal composite score that was then scaled to its baseline SD. A one-unit decrease in this global z-score measure is thus interpreted as a full SD decline in cognition from the baseline.26
Primary Predictor
Individual CVH indicators were measured at ARIC Exam 1 (1987–1989) and coded to reflect American Heart Association (AHA) specifications for Ideal CVH.13 A description is provided in Supplemental Table 1 with additional details for the diet variable provided in Supplemental Table 2.27 Briefly, each LS7 measure was coded as a three-category indicator that grouped individuals’ scores as meeting Ideal (2 points), Intermediate (1 point), or Poor (0 points) criteria. Participants’ LS7 criterion scores were then summed (range 0–14) with higher scores indicating better CVH. The LS7 indicators included three behavioral (diet, physical activity, and smoking) and four biological (body mass index (BMI), blood pressure (BP), total cholesterol, and fasting blood glucose) markers.
Covariates
Analyses controlled for sex and baseline age in years, a combined race/study site composite indicator (for examining any potential study site confounding effects), and educational attainment (basic, intermediate, and advanced). Basic education was defined as less than high school graduate; intermediate education was defined as having a high school degree; and advanced education as having some college education or higher.
Statistical analysis
This study focuses on n=13,270/14,040 (92%) Exam 2 participants (10,272 White and 2,998 Black) with midlife cognitive tests and CVH (excluding 308 with no cognitive tests and 534 without CVH). We also excluded n=223 participants reporting a stroke prior to Exam 2, and n=13 participants missing educational achievement information. The inclusion criteria and sample exclusion numbers as well as the final analytical sample size are included in Supplemental Table 16. This study protocol was reviewed and approved by institutional review boards of participating sites. All participants provided written informed consent.
Data analyses were conducted in four steps. First, we calculated descriptive statistics for the LS7 score, its individual items, and the model covariates by racial grouping. Second, we present a detailed characterization of the distribution of the LS7 score by racial grouping (Supplemental Table 3). Third, we fit a series of linear mixed models28,29 with random intercepts and robust Huber-White variance estimates to examine the relationships between cognitive function over the study period and 1) our primary exposure (LS7 score), and 2) each of the individual LS7 items.29 Mixed models are elegant for these data as they include inherent missing at random (MAR) assumptions, which allow missingness by dropout or design to be addressed via appropriate inclusion of terms in the design matrix. We examine potential non-MAR effects in the sensitivity analyses below. Time-in-study vs. attained-age time-scales in longitudinal and survival models have received considerable attention in the literature.30–33 In our analysis, we used the number of years since Exam 2 as the longitudinal metric for time following standard ARIC analysis protocol. In all models we allowed for race-specific covariates effects by including race by education, age, and sex interactions. In models where the effects of individual LS7 items were considered, we used a dummy variable for “ideal” and set the reference to the non-ideal group. To account for nonlinear cognitive change trajectories over the course of the study we used linear splines with knots at 6 and 12 years to characterize nonlinear decline trajectories, similar to previous ARIC cognitive analyses. Knot placement was informed by Akaike information criterion (AIC) and sensitivity analyses to knot placement yielded similar results. We include more technical details on the fitted models as a supplementary appendix (SA1) for interested readers. Fourth, to examine the within racial group relationships between LS7, and its component items, and cognitive change all models detailed above were refit in race stratified analyses. To facilitate interpretation, and for each analytic set, we present 1) the estimated marginal effects, their 95% confidence intervals, and calculated p-values for the total LS7 score and its component items, 2) the predicted marginal means at pre-specified LS7 scores (LS7=10 and LS7=6) and component item groups (Ideal and Non-Ideal), and 3) the difference (attenuation) in predicted marginal means between these pre-specified values. All estimated marginal effects and predicted values are presented with respect to the 1) midlife cognitive status, 2) the overall (0–20 years) of change in cognitive status, and 3) cognitive status after 20 years. Additionally, to facilitate the interpretation of our results we include forest plots that combine the 1) estimated attenuations (and their 95% confidence intervals) in cognitive decline slopes for each cognitive test (Figure 2), and 2) the difference in cognitive status at 20 years for each LS7 component item (Figure 3).
Figure 2.
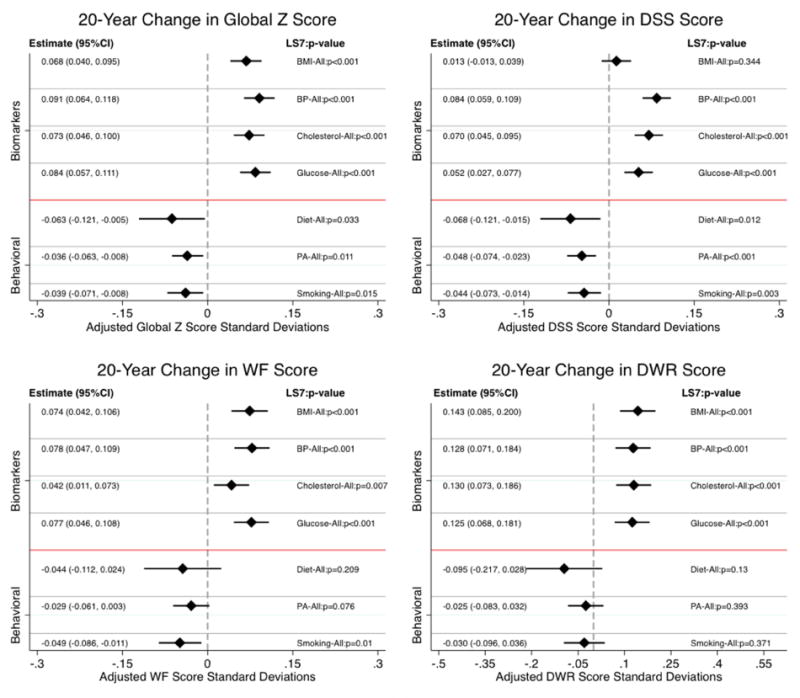
Estimated differences in 20-years average change (slope) in cognitive function between respondents satisfying Ideal and non-Ideal criteria on Life Simple 7 (LS7) components. Results are based on a pooled sample (n=13,270) of Black and White participants from the 1987-2013 Atherosclerosis Risk in Communities (ARIC) data.
Note 1: Cognitive measures at each of the visits included the Delayed Word recall (DWR), Digit Symbol Substitution (DSS) test from the Wechsler Adult Intelligence Scale – Revised, and phonemic Word Fluency (WF). Z-scores for each 0f these tests were created at each testing occasion by scaling to their mean and standard deviation (SD) at baseline (1990–1992). The average of these 3 test-specific z scores was used to create a global longitudinal composite (Global Z) score that was then scaled to its baseline SD.
Note 2: Bars around the estimates represent 95% confidence intervals.
Figure 3.
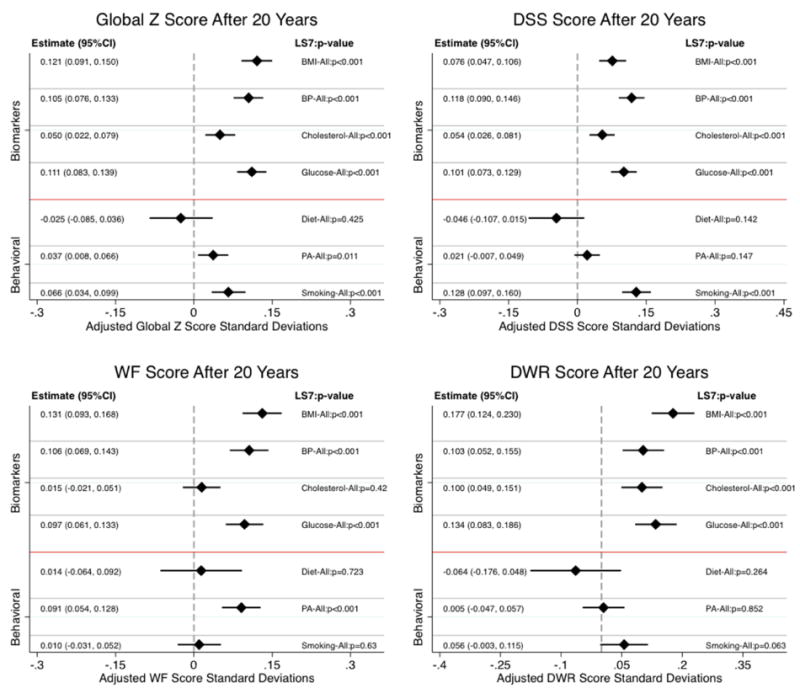
Estimated differences in average cognitive function at 20-years between respondents satisfying Ideal and non-Ideal criteria on Life Simple 7 (LS7) components. Results are based on a pooled sample (n=13,270) of Black and White participants from the 1987-2013 Atherosclerosis Risk in Communities (ARIC) data.
Note 1: Cognitive measures at each of the visits included the Delayed Word recall (DWR), Digit Symbol Substitution (DSS) test from the Wechsler Adult Intelligence Scale – Revised, and phonemic Word Fluency (WF). Z-scores for each 0f these tests were created at each testing occasion by scaling to their mean and standard deviation (SD) at baseline (1990–1992). The average of these 3 test-specific z scores was used to create a global longitudinal composite (Global Z) score that was then scaled to its baseline SD.
Note 2: Bars around the estimates represent 95% confidence intervals.
Sensitivity analyses
We conducted two sensitivity analyses (available from authors). In the first, we refit the models, detailed in step 3 above, to include simultaneous adjustments for all LS7 items. Second, to investigate possible bias in our results due to informative dropout during the study period, we reran our analyses, as detailed in step 3 above, using joint modeling of longitudinal and survival data (SA1 includes a brief explanation and technical details).34,35
All data were analyzed using Stata 14.1 (Stata Corp, College Station, TX) and SAS 9.4 (SAS Institute, Cary, NC).
RESULTS
Sociodemographic and health characteristics
Descriptive statistics for ARIC participants at midlife by racial groups are provided in Table 1. Blacks were more likely to be female (64% vs. 53% for Whites), slightly younger (53.3 vs. 54.3 years), and more than twice as likely to report basic education (<12 years) (38% vs. 16%).
Table 1.
Descriptive characteristics of overall (n=13,270), Black (n=2,998) and White (n=10,272) participants from the Atherosclerosis Risk in Communities (ARIC) cognitive baseline data.
| Participants’ Characteristics | All Participants | Whites | Blacks | P-value |
|---|---|---|---|---|
|
|
||||
| Female, N (%) | 7397 (56%) | 5467 (53%) | 1930 (64%) | <0.001 |
| Age, years, Mean (SD) | 54.06 (5.72) | 54.29 (5.69) | 53.30 (5.74) | <0.001 |
| Education | <0.001 | |||
| Basic Education, N (%) | 2739 (21%) | 1596 (16%) | 1143 (38%) | |
| Intermediate Education, N (%) | 5572 (42%) | 4711 (46%) | 861 (29%) | |
| Advanced Education, N (%) | 4959 (37%) | 3965 (39%) | 994 (33%) | |
| Body Mass Index, kg/m2, Mean (SD) | 27.58 (5.24) | 26.95 (4.77) | 29.74 (6.13) | <0.001 |
| Systolic Blood Pressure, mm Hg, Mean (SD) | 120.26 (17.93) | 118.21 (16.76) | 127.31 (19.91) | <0.001 |
| Diastolic Blood Pressure, mm Hg, Mean (SD) | 73.27 (10.84) | 71.52 (9.93) | 79.28 (11.64) | <0.001 |
| Antihypertensive Medication Use, N (%) | 3803 (29%) | 2531 (25%) | 1272 (42%) | <0.001 |
| Total Cholesterol, mg/dL, Mean (SD) | 214.99 (41.67) | 214.77 (40.47) | 215.73 (45.53) | 0.265 |
| Antihypercholesterolemia Medication Use, N (%) | 380 (3%) | 339 (3%) | 41 (1%) | <0.001 |
| Ideal Diet, N (%) | 724 (5%) | 587 (6%) | 137 (5%) | 0.015 |
| Fasting Glucose, mg/dL, Mean (SD) | 107.21 (36.68) | 104.63 (29.54) | 116.06 (53.52) | <0.001 |
| Antidiabetic Medication Use, N (%) | 583 (5%) | 295 (3%) | 288 (12%) | <0.001 |
| Ideal Physical Activity, N (%) | 5104 (38%) | 4447 (43%) | 657 (22%) | <0.001 |
| Smoking Status | <0.001 | |||
| Never-smoker, N (%) | 5710 (43%) | 4242 (41%) | 1468 (49%) | |
| Former-smoker, N (%) | 4358 (33%) | 3649 (36%) | 709 (24%) | |
| Current-smoker, N (%) | 3202 (24%) | 2381 (23%) | 821 (27%) | |
| Life’s Simple Seven Score, 0-14 Scale, Mean (SD) | 8.00 (2.37) | 8.37 (2.29) | 6.75 (2.19) | <0.001 |
|
| ||||
| Sample Size | 13270 | 10272 | 2998 | |
LS7 profiles
Blacks had higher average midlife BMI, systolic and diastolic BP, and fasting glucose levels (all p<0.001), but did not differ from Whites on average total cholesterol (p=0.27) (Table 1). Blacks were also less likely to satisfy criteria for ideal physical activity (22% vs. 43%), more likely to report never smoking (49% vs. 41% for Whites) and being current smokers (27% vs. 23% respectively), and slightly less likely (but statistically significantly so) to satisfy criteria for ideal diet (5% vs. 6%).
Very few participants satisfied Ideal criteria on all 7 measures (0.2%; Supplemental Table 3). The distribution of the LS7 score was largely normal with both the mean and median scores estimated at 8 (range 0–14; interquartile interval 6–10). Blacks had a significantly (p<0.001) lower LS7 score (Mean= 6.8, SD=2.2) compared to Whites (Mean=8.4, SD=2.3).
Midlife association between cognitive scores and LS7
Results from linear mixed models indicated positive, significant, and consistent associations between midlife LS7 and midlife cognitive status (Table 2). A one-unit higher LS7 score was associated with 0.03 (p<0.001), 0.02 (p<0.001), 0.03 (p<0.01), and 0.03 (p<0.001) standard deviation (SD) higher score in midlife global cognitive functioning, DWR, DSS, and WF, respectively. Stated differently, the differences in average midlife cognitive performance status between participants with an LS7 score of 10 and a score of 6 (LS7 quartiles) was equivalent to 0.10, 0.06, 0.14, and 0.11 SD for the global cognition, DWR, DSS, and WF, respectively (all p<0.01).
Table 2.
Estimates of neurocognitive baseline scores (Exam 2) and longitudinal changes in adjusted scores associated with Exam 1 American Heart Association Life Simple 7s (LS7; range 0–14) scores. Results are based on a pooled sample (n=13,270) of Black and White participants from the 1987–2013 Atherosclerosis Risk in Communities (ARIC) data.
| At NC Baseline | 20-Year Change | After 20-Years | |
|---|---|---|---|
|
|
|||
| Global Z | |||
| LS7 = 10 | 0.098*** | −0.614*** | −0.516*** |
| (0.085,0.111) | (−0.630,−0.598) | (−0.533,−0.498) | |
| LS7 = 6 | −0.007 | −0.688*** | −0.695*** |
| (−0.020,0.007) | (−0.709,−0.668) | (−0.716,−0.674) | |
| Δ 4-Units (LS7=10 vs LS=6) | 0.104*** | 0.075*** | 0.179*** |
| (0.087,0.122) | (0.051,0.099) | (0.154,0.204) | |
| Δ 1-Unit | 0.026*** | 0.019*** | 0.045*** |
| (0.022,0.030) | (0.013,0.025) | (0.039,0.051) | |
| Delayed Recall | |||
| LS7 = 10 | 0.071*** | −0.958*** | −0.887*** |
| (0.051,0.092) | (−0.992,−0.925) | (−0.918,−0.856) | |
| LS7 = 6 | 0.008 | −1.102*** | −1.094*** |
| (−0.013,0.028) | (−1.144,−1.060) | (−1.134,−1.055) | |
| Δ 4-Units (LS7=10 vs LS=6) | 0.064*** | 0.144*** | 0.207*** |
| (0.037,0.091) | (0.094,0.193) | (0.162,0.253) | |
| Δ 1-Unit | 0.016*** | 0.036*** | 0.052*** |
| (0.009,0.023) | (0.023,0.048) | (0.040,0.063) | |
| Digit Symbol Substitution | |||
| LS7 = 10 | 0.121*** | −0.721*** | −0.599*** |
| (0.106,0.137) | (−0.736,−0.706) | (−0.616,−0.582) | |
| LS7 = 6 | −0.015 | −0.762*** | −0.777*** |
| (−0.030,0.001) | (−0.781,−0.744) | (−0.797,−0.757) | |
| Δ 4-Units (LS7=10 vs LS=6) | 0.136*** | 0.042*** | 0.178*** |
| (0.116,0.157) | (0.019,0.064) | (0.153,0.203) | |
| Δ 1-Unit | 0.034*** | 0.010*** | 0.044*** |
| (0.029,0.039) | (0.005,0.016) | (0.038,0.051) | |
| Word Fluency | |||
| LS7 = 10 | 0.092*** | −0.183*** | −0.092*** |
| (0.072,0.111) | (−0.202,−0.165) | (−0.115,−0.069) | |
| LS7 = 6 | −0.016 | −0.245*** | −0.261*** |
| (−0.036,0.003) | (−0.267,−0.222) | (−0.287,−0.235) | |
| Δ 4-Units (LS7=10 vs LS=6) | 0.108*** | 0.061*** | 0.169*** |
| (0.081,0.134) | (0.034,0.088) | (0.136,0.201) | |
| Δ 1-Unit | 0.027*** | 0.015*** | 0.042*** |
| (0.020,0.034) | (0.008,0.022) | (0.034,0.050) | |
Note 1: Z-scores for each 0f the cognitive tests were created at each testing occasion by scaling to their mean and standard deviation (SD) at baseline (1990–1992). The average of these 3 test- specific z scores was used to create a global longitudinal composite (Global Z) score that was then scaled to its baseline SD.
Note 2: Confidence Intervals are included in parentheses.
p<0.001;
p<0.01;
p<0.05
To facilitate clinical translation of these results we focus on global cognition and place the estimates in the context of the derived age effect on baseline global cognition (B=−0.027 for 1-year increase in age). As such, the effect of a 1-unit increase in LS7 score on baseline global cognition (B=0.026) is equivalent to protection from one additional year of aging, and the effect of a 4-unit increase in LS7 score on baseline cognition provides cognitive protection equivalent to 4 years of aging.
Midlife association between cognitive scores and LS7 components
We observed largely positive and significant associations between the LS7 components and each of the cognitive measures (Supplemental Tables 4, 5, 6, and 7). Differences in midlife global cognitive scores between Ideal and non-Ideal groups varied between Δ=0.11 SD (p<0.001) for smoking and Δ=−0.02 (p=0.027) for cholesterol. Blood pressure groupings were not statistically distinct on their midlife cognitive scores. We found differences in midlife DWR with respect to BMI and smoking, but less so for the other indicators. Differences in DSS midlife scores between Ideal and non-Ideal groups varied between Δ=0.17 SD (p<0.001) for smoking and Δ=0.03 (p<0.001) for BP. Neither ideal diet nor cholesterol were significantly associated with the DSS. Finally, we found significant differences (Ideal vs. non-Ideal) in midlife WF scores with respect to BMI Δ=0.06 SD, smoking Δ=0.06 SD, and physical activity Δ=0.12 SD; all p<0.001.
Association between cognitive change and LS7
Overall, participants with higher LS7 scores at midlife maintained consistently higher cognitive function two decades later. (Table 2) More importantly, higher LS7 scores at midlife had small but positive protective effects on the course of cognitive change over the study period. A one-unit higher score in the LS7 index at midlife attenuated cognitive decline over the study period by 0.02 (p<0.001), 0.04 (p<0.001), and 0.01 (p<0.001), and 0.02 (p<0.001) SDs on the global cognitive, DWR, DSS, and WF scores, respectively. Stated differently, these estimated differences correspond to amelioration in cognitive change for participants with an LS7 score of 10 at midlife (relative to those with a score of 6) equivalent to 0.08 (p<0.001), 0.14 (p<0.001), and 0.04 (p<0.001), and 0.06 (p<0.001) SDs over and above their advantageous midlife differences.
As with above we focus on global cognition and place the estimates in the context of the derived age effect on baseline global cognition (B=−0.027 for 1-year increase in age) to facilitate clinical translation of these results. The effect of a 1-unit increase in LS7 score on global cognitive decline (b=0.019) is equivalent to about three-quarters of a year of aging, and the effect of a 4-unit increase in LS7 score on cognitive decline equates to roughly 3 years of aging over the course of 20-years. Estimates of midlife scores and trajectories of change for global cognition by LS7 groups are presented in Figure 1.
Figure 1.
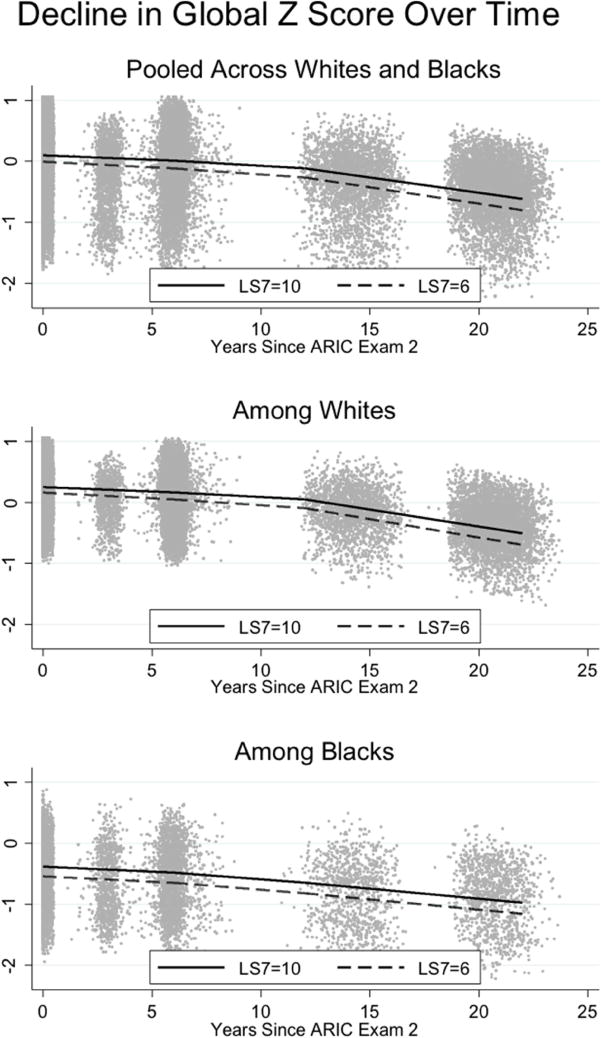
Estimates of Global cognitive function (z-scores) trajectories over time by American Heart Association Life Simple 7s (LS7; range=0-14) scores for the pooled (n=13,270) and stratified samples of Black (n=2,998) and White (n=10,272) participants from the 1987-2013 Atherosclerosis Risk in Communities (ARIC) data.
Note: The global longitudinal composite (Global Z) score is based on the average of 3 test-specific z scores (Delayed Word recall; Digit Symbol Substitution test from the Wechsler Adult Intelligence Scale – Revised; phonemic Word Fluency) and is scaled to its baseline SD.
Time splines
Our time-differentiated, splines-based results provided little evidence to suggest that substantive differences in the effects of better CVH at midlife are stronger for shorter-term, relative to longer-term, cognitive benefits. This was true for all four cognitive measures where positive attenuations of midlife LS7 scores were evident (Supplemental Tables 4–7.)
Association between cognitive change and LS7 components
Item specific analyses (Figure 2) showed similarly positive protective effects on global cognition for the four Ideal compared to non-Ideal biological markers: BMI (0.068; p<0.001), BP (0.091; p<0.001), total cholesterol (0.073; p<0.001) and fasting glucose (0.084; p<0.001). However, we found that better behavioral profiles at midlife led to more accentuated decline in global cognition over the study period; equivalent to −0.063 SD (p=0.033) for diet, −0.036 SD (p<0.001) for physical activity, and −0.039 SD (p=0.001) for smoking. The estimated differences in cognitive scores after 20-years are presented in Figure 3. Both the change (slopes; Figure 2) and endpoint (Figure 3) results were consistent across the three individual cognitive tests.
Race specific associations between midlife LS7 and cognitive change
Similar results were evident in race-stratified analyses with respect to global neurocognition (Table 3). At midlife the magnitudes of the effects of the LS7 index on cognitive tests were more pronounced among Blacks compared to Whites. Specifically, the effects of a unit increase in the LS7 index on midlife global cognitive, DWR, DSS, and WF scores were, respectively, 1.8, 2.6, 1.4, and 2.0 times larger among Blacks compared to Whites. However, the protective effects of midlife LS7s over time were more prominent among Whites and not statistically evident among Blacks. The race specific effects of the individual LS7 items largely mirrored the overall sample findings and showed principal consistencies across both race groups, despite larger confidence intervals among Blacks (Supplemental Figures 2 and 3). Detailed presentations of these estimates, and those resulting from the splines-based models are included in Supplemental Tables 8–11 for Whites, and 12–15 for Blacks.
Table 3.
Estimates of neurocognitive baseline scores (Exam 2) and longitudinal changes in adjusted scores associated with Exam 1 American Heart Association Life Simple 7s (LS7; range 0–14) scores. Results are based on stratified samples of Black (n=2,998) and White (n=10,272) participants from the 1987–2013 Atherosclerosis Risk in Communities (ARIC) data.
| Whites | Blacks | |||||
|---|---|---|---|---|---|---|
|
|
||||||
| At NC Baseline | 20-Year Change | After 20-Years | At NC Baseline | 20-Year Change | After 20-Years | |
|
|
||||||
| Global-Z | ||||||
| LS7 = 10 | 0.250*** | −0.647*** | −0.397*** | −0.381*** | −0.526*** | −0.907*** |
| (0.236,0.263) | (−0.664,−0.631) | (−0.415,−0.379) | (−0.419,−0.343) | (−0.574,−0.478) | (−0.959,−0.854) | |
| LS7 = 6 | 0.160*** | −0.737*** | −0.576*** | −0.541*** | −0.547*** | −1.088*** |
| (0.145,0.176) | (−0.761,−0.713) | (−0.602,−0.551) | (−0.564,−0.518) | (−0.582,−0.511) | (−1.125,−1.051) | |
| Δ 4-Units (LS7=10 vs LS7=6) | 0.089*** | 0.090*** | 0.179*** | 0.160*** | 0.021 | 0.181*** |
| (0.070,0.109) | (0.063,0.116) | (0.151,0.207) | (0.120,0.200) | (−0.033,0.075) | (0.124,0.238) | |
| Δ 1-Unit | 0.022*** | 0.022*** | 0.045*** | 0.040*** | 0.005 | 0.045*** |
| (0.018,0.027) | (0.016,0.029) | (0.038,0.052) | (0.030,0.050) | (−0.008,0.019) | (0.031,0.060) | |
| Delayed Recall | ||||||
| LS7 = 10 | 0.158*** | −0.990*** | −0.832*** | −0.182*** | −0.908*** | −1.091*** |
| (0.137,0.179) | (−1.025,−0.956) | (−0.865,−0.800) | (−0.244,−0.121) | (−1.008,−0.809) | (−1.184,−0.998) | |
| LS7 = 6 | 0.110*** | −1.162*** | −1.052*** | −0.306*** | −0.941*** | −1.248*** |
| (0.085,0.134) | (−1.213,−1.111) | (−1.100,−1.004) | (−0.344,−0.269) | (−1.014,−0.869) | (−1.316,−1.179) | |
| Δ 4-Units (LS7=10 vs LS7=6) | 0.048** | 0.172*** | 0.220*** | 0.124*** | 0.033 | 0.157** |
| (0.018,0.078) | (0.116,0.228) | (0.169,0.271) | (0.060,0.188) | (−0.078,0.144) | (0.055,0.259) | |
| Δ 1-Unit | 0.012** | 0.043*** | 0.055*** | 0.031*** | 0.008 | 0.039** |
| (0.005,0.019) | (0.029,0.057) | (0.042,0.068) | (0.015,0.047) | (−0.019,0.036) | (0.014,0.065) | |
| Digit Symbol Substitution | ||||||
| LS7 = 10 | 0.392*** | −0.794*** | −0.402*** | −0.761*** | −0.480*** | −1.241*** |
| (0.376,0.407) | (−0.809,−0.778) | (−0.420,−0.384) | (−0.807,−0.715) | (−0.526,−0.433) | (−1.291,−1.191) | |
| LS7 = 6 | 0.267*** | −0.850*** | −0.584*** | −0.932*** | −0.492*** | −1.424*** |
| (0.248,0.286) | (−0.873,−0.828) | (−0.609,−0.559) | (−0.959,−0.905) | (−0.522,−0.462) | (−1.456,−1.392) | |
| Δ 4-Units (LS7=10 vs LS7=6) | 0.125*** | 0.057*** | 0.182*** | 0.171*** | 0.013 | 0.184*** |
| (0.102,0.148) | (0.032,0.082) | (0.154,0.210) | (0.124,0.218) | (−0.037,0.062) | (0.129,0.238) | |
| Δ 1-Unit | 0.031*** | 0.014*** | 0.045*** | 0.043*** | 0.003 | 0.046*** |
| (0.026,0.037) | (0.008,0.020) | (0.039,0.052) | (0.031,0.054) | (−0.009,0.015) | (0.032,0.059) | |
| Word Fluency | ||||||
| LS7 = 10 | 0.196*** | −0.173*** | 0.023 | −0.215*** | −0.251*** | −0.466*** |
| (0.176,0.216) | (−0.192,−0.153) | (−0.000,0.047) | (−0.271,−0.158) | (−0.309,−0.194) | (−0.532,−0.400) | |
| LS7 = 6 | 0.107*** | −0.248*** | −0.141*** | −0.395*** | −0.250*** | −0.645*** |
| (0.083,0.131) | (−0.276,−0.220) | (−0.173,−0.109) | (−0.427,−0.363) | (−0.286,−0.215) | (−0.686,−0.604) | |
| Δ 4-Units (LS7=10 vs LS7=6) | 0.089*** | 0.075*** | 0.164*** | 0.180*** | −0.001 | 0.179*** |
| (0.059,0.119) | (0.045,0.106) | (0.128,0.201) | (0.123,0.238) | (−0.061,0.058) | (0.109,0.249) | |
| Δ 1-Unit | 0.022*** | 0.019*** | 0.041*** | 0.045*** | −0.000 | 0.045*** |
| (0.015,0.030) | (0.011,0.027) | (0.032,0.050) | (0.031,0.060) | (−0.015,0.014) | (0.027,0.062) | |
Note 1: Z-scores for each 0f the cognitive tests were created at each testing occasion by scaling to their mean and standard deviation (SD) at baseline (1990–1992). The average of these 3 test-specific z scores was used to create a global longitudinal composite (Global Z) score that was then scaled to its baseline SD.
Note 2: Confidence Intervals are included in parentheses.
p<0.001;
p<0.01;
p<0.05
Sensitivity Analyses
Results similar to the primary findings, as reported in Tables 2 and 3, were evident when we adjusted for all ideal LS7 components in the fitted models. Results from the joint models showed slight accentuation of cognitive differences for higher LS7 scores, but did not qualitatively change conclusions from our primary analyses.
DISCUSSION
Among ARIC participants, we found that higher midlife LS7 CVH scores were associated with better cognitive function in middle-age, and that LS7-related higher cognitive function was maintained over 20 years. Overall, our translation of the study estimates indicate that, for example, the aggregate benefit, through better midlife cognitive performance and protection against decline over time, from each unit increase in LS7 scores equates to about 2-years of protection against global cognitive aging over the course of 20-years. Additionally, we found that individual Ideal LS7 components including biomarkers (BMI, blood pressure, cholesterol, glucose levels) and behavioral measures (diet, physical activity, and non-smoking) were consistently associated with better midlife cognitive function. Ideal biomarkers (BMI, blood pressure, cholesterol, glucose levels) and to a lesser extent behavioral measures, particularly physical activity and non-smoking, were also linked to better cognitive function 20-years later. The relationships between LS7 components and cognitive decline were more varied. Only Ideal baseline biomarkers (BMI, blood pressure, cholesterol, glucose levels) were associated with less cognitive decline. It is noteworthy that the reductions in cognitive decline we found were apparent for all ARIC participants, but the CVH effects were notably stronger for Whites than among Blacks. Our results were not explained by study dropout or death.
Our findings are consistent with a previous report suggesting that LS7 CVH in young adulthood may have cognitive benefits for Blacks and Whites in midlife.18 Our longitudinal findings extend this previous work to suggest that midlife CVH may have enduring 20-year benefits that may reduce cognitive decline.17–19 Without known cures for Alzheimer’s disease and related dementias, even modest reductions in cognitive decline, such as those found here in ARIC, can have a significant impact by forestalling dementia-related impairment and disease burden. Modest reductions in cognitive decline and compression of morbidity to later years could delay personal suffering and significantly lower the disease burden of dementias.36
In ARIC, the total Ideal LS7 and each individual Ideal component were associated with higher midlife cognitive functioning. The total Ideal CVH and individual LS7 biological components (e.g., cholesterol) were related to attenuated cognitive decline, but the behavioral components (e.g., diet) were not. Midlife elevated systolic blood pressure, hypercholesterolemia and obesity have been reported to be associated with late-life cognitive function and ADRD, which is consistent with our findings.3–8 However, midlife CVH behaviors (i.e., leisure activity and smoking) in relation to late-life cognition have received less attention. Higher midlife leisure-time physical activity has been associated with better cognition, but not midlife smoking.11,37 In our study, we included self-reported diet, physical activity and smoking status at midlife, but none of these health behavior indices were clearly protective against cognitive decline. Our results, overall, provide evidence to argue that optimal behavioral measures provide an edge for healthier cognitive aging (those with better behavioral outcomes started higher and ended higher as well), yet the mechanisms of cognitive maintenance require more research and better data. We offer three conjectures to help clarify the curious associations between the behavioral components and the slope of cognitive decline. First, we believe that the advantageous behavioral factors are more unstable and harder to maintain over time compared to midlife biological measures. As such, any cognitive reserves initially created at baseline by these factors are likely to be lost as individuals age in comparison to those that do not have these advantages. Second, it is possible that residual confounding remains uncontrolled in the model. It is hard to speculate about the nature and mechanism of the confounding given available data, but factors linked to both survival and lower cognitive function (e.g. stroke) might be at play. We reasoned that selective attrition might have contributed to these findings, but our sensitivity analyses did not lead to drastically different conclusions. Third, health behaviors used in this study were based on self-report, which may be subject to recall and response biases. Objective health behavior measures (e.g., accelerometry) could improve the precision of measurements and estimates.38 It is also worth noting that the LS7 criteria for diet are very stringent such that only about 1% of the ARIC and other cohort studies reported Ideal LS7 diet.14,39
Better midlife CVH was associated with higher benefit for midlife cognitive function for Blacks, than Whites. However, the midlife CVH-cognitive benefits we estimated were notably lower for Blacks later in life. Early morbidity did not explain the Black-White differences in cognitive decline. As we suggested above, behavioral LS7 or other components (e.g., BP) may be less stable over 20-years that might contribute to this difference in CVH-cognitive benefit. If CVH-related benefits to cognitive health at the population level are to be realized, then understanding the nuances of the racial differences in CVH benefits on 20-year neurocognition we observed in ARIC merit additional attention.
The findings of this study are clinically relevant for practitioners whose aging patients express their concerns about developing Alzheimer’s disease and are seeking advice on ways to maintain their cognitive health. In the absence of effective therapies to prevent ADRD, encouraging patients to properly maintain their cardiovascular health in midlife will lower their CVD risk and perhaps, as we suggest, may be able to better maintain their cognitive health. Lower stroke risk is one direct mechanism by which improved midlife cardiovascular health is associated with maintaining cognitive health.15,40 Additionally, there is emerging evidence that suggests that CVD has an important neurovascular role in the development of ADRD.41
The Alzheimer’s Association has recently initiated a public health program that promotes CVH and increasing mental stimulation (e.g., puzzles; http://www.alz.org/brain-health/brain_health_overview.asp). The AHA’s LS7 2020 goals to reduce cardiovascular morbidity and mortality overlap considerably with the Alzheimer’s Association’s Brain Health program. The LS7 program has precise and prescriptive goals for improving CVH, but does not include mental stimulations. As such, we suggest that combining the LS7 and Brain Health efforts could be an effective and efficient way to join resources for combating two leading causes of disease burden, namely heart disease, and cognitive decline, dementia, and related disorders. Given revitalized acceptance and new understanding that midlife cardiovascular disease contributes to its etiology and, therefore, may be a means for delaying or preventing dementias.36
Our study had several strengths worth highlighting for readers. First, this is the largest study to have examined a well-defined, comprehensive and empirically based cardiovascular health initiative (LS7) in relation to cognitive function. The AHA LS7 national initiative that began in 2010 has clearly defined 10-year goals for reducing cardiovascular morbidity and mortality, an initiative that has the potential for improving cognitive aging as well.13 Secondly, our study extended over 20-years from midlife to older age. Thirdly, we accounted for biases (e.g., sensitivity analyses) and used sophisticated analytic techniques and methods to ensure our study results estimates were robust and reproducible. Finally and to our knowledge, this is the first study to have included African Americans and Whites. Previous studies of CVH and cognition from northern Europe and the US did not include racially diverse populations. In an increasingly diverse US, it is vital to public health to ensure that heart and brain health benefits impact diverse populations.
Limitations
There are important caveats worth considering when evaluating our findings. First, LS7s were assessed at midlife, and our current analyses did not consider changes in adherence to CVH guidelines. Second, although statistically significant, the LS7 effects on cognitive function were moderate in the overall sample and small among African Americans. These racial “differences” in effect sizes may be due to the smaller sample of Blacks rather than “true” difference between groups. Third, we relied on midlife self-reported of cardiovascular health behaviors, which may have introduced biases that affected our estimates in relation to cognitive function. Fourth, the cognitive test battery that we reported was limited. An expanded test battery could reveal other associations with cardiovascular health. Fifth, we examined only non-institutionalized persons in targeted ARIC communities, which limits study generalizability. Finally, our focus was on time change in cognitive scores. Modeling diagnoses measures, such as Mild Cognitive Impairment that occurred over the study period, were outside the scope of this work and not accounted for in the analyses. Future work should examine the associations between LS7 and its components and onset of cognitive disorders.
Conclusions
Cardiovascular health is vital for healthy heart and brain function and aging. Without cures for dementias on the near horizon, public health means for reducing risk for cognitive decline and dementias are being sought. Healthy cardiovascular lifestyles are increasingly recognized as cognitively beneficial and may provide neuroprotection and resilience to impairment.17,18 If so, improving population-level cognitive health through modifiable CVD risk factors has the potential to mitigate the looming public health burden of Alzheimer’s disease and other dementias, especially among those at increased risk for these disorders.42
Supplementary Material
Research in Context.
Systematic review
We reviewed the existing research literature on cardiovascular health and healthy cognitive aging.
Interpretations
Our findings that that multiple facets of midlife cardiovascular health (e.g., diet and blood pressure) are related to better cognitive function 20-years later contribute to a growing body of evidence that healthy brain aging begins in midlife.
Future directions
In this study, the effect sizes of midlife cardiovascular health on cognitive function 20-years later were small; however, at the population level these small effects can yield appreciable results. The longterm effects of midlife cardiovascular health were less discernible among African Americans relative to Whites suggesting that additional attention may be needed for diverse populations to reduce health disparities.
Acknowledgments
Drs. Gonzalez and Tarraf receive support from the National Institute of Aging AG48642 and AG54548. Dr. Gonzalez receives additional support from AG005131. The Atherosclerosis Risk in Communities Study is carried out as a collaborative study supported by National Heart, Lung, and Blood Institute contracts (HHSN268201100005C, HHSN268201100006C, HHSN268201100007C, HHSN268201100008C, HSN268201100009C, HHSN268201100010C, HHSN268201100011C, and HHSN268201100012C). Neurocognitive data is collected by U01 2U01HL096812, 2U01HL096814, 2U01HL096899, 2U01HL096902, 2U01HL096917 from the NIH (NHLBI, NINDS, NIA and NIDCD), and with previous brain MRI examinations funded by R01-HL70825 from the NHLBI. The ARIC carotid MRI Examination was funded by U01HL075572-01. The authors thank the staff and participants of the ARIC study for their important contributions.
Footnotes
Publisher's Disclaimer: This is a PDF file of an unedited manuscript that has been accepted for publication. As a service to our customers we are providing this early version of the manuscript. The manuscript will undergo copyediting, typesetting, and review of the resulting proof before it is published in its final citable form. Please note that during the production process errors may be discovered which could affect the content, and all legal disclaimers that apply to the journal pertain.
References
- 1.Mozaffarian D, Benjamin EJ, Go AS, et al. Executive Summary: Heart Disease and Stroke Statistics—2016 Update: A Report From the American Heart Association. Circulation. 2016;133(4):447–454. doi: 10.1161/CIR.0000000000000366. [DOI] [PubMed] [Google Scholar]
- 2.Norton S, Matthews FE, Barnes DE, Yaffe K, Brayne C. Potential for primary prevention of Alzheimer’s disease: an analysis of population-based data. The Lancet Neurology. 13(8):788–794. doi: 10.1016/S1474-4422(14)70136-X. [DOI] [PubMed] [Google Scholar]
- 3.Sundquist J, Winkleby MA, Pudaric S. Cardiovascular disease risk factors among older black, Mexican-American, and white women and men: an analysis of NHANES III, 1988–1994. Third National Health and Nutrition Examination Survey. Journal of the American Geriatrics Society. 2001;49(2):109–116. doi: 10.1046/j.1532-5415.2001.49030.x. [DOI] [PubMed] [Google Scholar]
- 4.Shay CM, Ning H, Allen NB, et al. Status of Cardiovascular Health in US Adults: Prevalence Estimates from the National Health and Nutrition Examination Surveys (NHANES) 2003-2008. Circulation. 2011 doi: 10.1161/CIRCULATIONAHA.111.035733. [DOI] [PMC free article] [PubMed] [Google Scholar]
- 5.Kivipelto M, Helkala EL, Laakso MP, et al. Midlife vascular risk factors and Alzheimer’s disease in later life: longitudinal, population based study. BMJ. 2001;322(7300):1447–1451. doi: 10.1136/bmj.322.7300.1447. [DOI] [PMC free article] [PubMed] [Google Scholar]
- 6.Tolppanen A-M, Solomon A, Soininen H, Kivipelto M. Midlife Vascular Risk Factors and Alzheimer’s Disease: Evidence from Epidemiological Studies. Journal of Alzheimer’s Disease. 2012;32(3):531–540. doi: 10.3233/JAD-2012-120802. [DOI] [PubMed] [Google Scholar]
- 7.Whitmer RA, Sidney S, Selby J, Johnston SC, Yaffe K. Midlife cardiovascular risk factors and risk of dementia in late life. Neurology. 2005;64(2):277–281. doi: 10.1212/01.WNL.0000149519.47454.F2. [DOI] [PubMed] [Google Scholar]
- 8.Whitmer RA, Gustafson DR, Barrett-Connor E, Haan MN, Gunderson EP, Yaffe K. Central obesity and increased risk of dementia more than three decades later. Neurology. 2008;71(14):1057–1064. doi: 10.1212/01.wnl.0000306313.89165.ef. [DOI] [PubMed] [Google Scholar]
- 9.Ngandu T, Lehtisalo J, Solomon A, et al. A 2 year multidomain intervention of diet, exercise, cognitive training, and vascular risk monitoring versus control to prevent cognitive decline in at-risk elderly people (FINGER): a randomised controlled trial. The Lancet. 385(9984):2255–2263. doi: 10.1016/S0140-6736(15)60461-5. [DOI] [PubMed] [Google Scholar]
- 10.Eskelinen MH, Ngandu T, Tuomilehto J, Soininen H, Kivipelto M. Midlife healthy-diet index and late-life dementia and Alzheimer’s disease. Dementia and geriatric cognitive disorders extra. 2011;1(1):103–112. doi: 10.1159/000327518. [DOI] [PMC free article] [PubMed] [Google Scholar]
- 11.Exalto LG, Quesenberry CP, Barnes D, Kivipelto M, Biessels GJ, Whitmer RA. Midlife risk score for the prediction of dementia four decades later. Alzheimer’s & Dementia. 2014;10(5):562–570. doi: 10.1016/j.jalz.2013.05.1772. [DOI] [PubMed] [Google Scholar]
- 12.Pase MP, Beiser A, Enserro D, et al. Association of Ideal Cardiovascular Health With Vascular Brain Injury and Incident Dementia. Stroke. 2016;47(5):1201–1206. doi: 10.1161/STROKEAHA.115.012608. [DOI] [PMC free article] [PubMed] [Google Scholar]
- 13.Lloyd-Jones DM, Hong Y, Labarthe D, et al. Defining and Setting National Goals for Cardiovascular Health Promotion and Disease Reduction. Circulation. 2010;121(4):586–613. doi: 10.1161/CIRCULATIONAHA.109.192703. [DOI] [PubMed] [Google Scholar]
- 14.Folsom AR, Yatsuya H, Nettleton JA, Lutsey PL, Cushman M, Rosamond WD. Community Prevalence of Ideal Cardiovascular Health, by the American Heart Association Definition, and Relationship With Cardiovascular Disease Incidence. Journal of the American College of Cardiology. 2011;57(16):1690–1696. doi: 10.1016/j.jacc.2010.11.041. [DOI] [PMC free article] [PubMed] [Google Scholar]
- 15.Dong C, Rundek T, Wright CB, Anwar Z, Elkind MSV, Sacco RL. Ideal Cardiovascular Health Predicts Lower Risks of Myocardial Infarction, Stroke, and Vascular Death Across Whites, Blacks, and Hispanics: The Northern Manhattan Study. Circulation. 2012;125(24):2975–2984. doi: 10.1161/CIRCULATIONAHA.111.081083. [DOI] [PMC free article] [PubMed] [Google Scholar]
- 16.Ogagarue ER, Lutsey PL, Klein R, Klein BE, Folsom AR. Association of Ideal Cardiovascular Health Metrics and Retinal Microvascular Findings: The Atherosclerosis Risk in Communities Study. Journal of the American Heart Association. 2013;2(6) doi: 10.1161/JAHA.113.000430. [DOI] [PMC free article] [PubMed] [Google Scholar]
- 17.Reis JP, Loria CM, Launer LJ, et al. Cardiovascular health through young adulthood and cognitive functioning in midlife. Annals of Neurology. 2013;73(2):170–179. doi: 10.1002/ana.23836. [DOI] [PMC free article] [PubMed] [Google Scholar]
- 18.Thacker EL, Gillett SR, Wadley VG, et al. The American Heart Association Life’s Simple 7 and Incident Cognitive Impairment: The REasons for Geographic And Racial Differences in Stroke (REGARDS) Study. Journal of the American Heart Association. 2014;3(3) doi: 10.1161/JAHA.113.000635. [DOI] [PMC free article] [PubMed] [Google Scholar]
- 19.Gonzalez HM, Tarraf W, Gouskova N, et al. Life’s Simple 7’s Cardiovascular Health Metrics are Associated with Hispanic/Latino Neurocognitive Function: HCHS/SOL Results. J Alzheimers Dis. 2016;53(3):955–965. doi: 10.3233/JAD-151125. [DOI] [PMC free article] [PubMed] [Google Scholar]
- 20.investigators TA. The Atherosclerosis Risk in Communities (ARIC) Study: design and objectives. Am J Epidemiol. 1989;129(4):687–702. [PubMed] [Google Scholar]
- 21.Cerhan JR, Folsom AR, Mortimer JA, et al. Correlates of Cognitive Function in Middle-Aged Adults. Gerontology. 1998;44:95–105. doi: 10.1159/000021991. [DOI] [PubMed] [Google Scholar]
- 22.Gottesman RF, Schneider AL, Albert M, et al. Midlife hypertension and 20-year cognitive change: the atherosclerosis risk in communities neurocognitive study. JAMA neurology. 2014;71(10):1218–1227. doi: 10.1001/jamaneurol.2014.1646. [DOI] [PMC free article] [PubMed] [Google Scholar]
- 23.Deal JA, Sharrett AR, Albert MS, et al. Hearing impairment and cognitive decline: a pilot study conducted within the atherosclerosis risk in communities neurocognitive study. Am J Epidemiol. 2015;181(9):680–690. doi: 10.1093/aje/kwu333. [DOI] [PMC free article] [PubMed] [Google Scholar]
- 24.Lutsey PL, Bengtson LG, Punjabi NM, et al. Obstructive Sleep Apnea and 15-Year Cognitive Decline: The Atherosclerosis Risk in Communities (ARIC) Study. Sleep. 2016;39(2):309–316. doi: 10.5665/sleep.5434. [DOI] [PMC free article] [PubMed] [Google Scholar]
- 25.Rawlings AM, Sharrett AR, Schneider AL, et al. Diabetes in midlife and cognitive change over 20 years: a cohort study. Ann Intern Med. 2014;161(11):785–793. doi: 10.7326/M14-0737. [DOI] [PMC free article] [PubMed] [Google Scholar]
- 26.Gottesman RF, Rawlings AM, Sharrett AR, et al. Impact of differential attrition on the association of education with cognitive change over 20 years of follow-up: the ARIC neurocognitive study. Am J Epidemiol. 2014;179(8):956–966. doi: 10.1093/aje/kwu020. [DOI] [PMC free article] [PubMed] [Google Scholar]
- 27.Rebholz CM, Anderson CA, Grams ME, et al. Relationship of the American Heart Association’s Impact Goals (Life’s Simple 7) With Risk of Chronic Kidney Disease: Results From the Atherosclerosis Risk in Communities (ARIC) Cohort Study. Journal of the American Heart Association. 2016;5(4):e003192. doi: 10.1161/JAHA.116.003192. [DOI] [PMC free article] [PubMed] [Google Scholar]
- 28.Fitzmaurice GM, Laird NM, Ware JH. Applied longitudinal analysis. Vol. 998. John Wiley & Sons; 2012. [Google Scholar]
- 29.Rabe-Hesketh S, Skrondal A. Multilevel and longitudinal modelling using stata / Sophia Rabe-Hesketh, Anders Skrondal. College Station, TX: Stata Press; 2008. [Google Scholar]
- 30.Kom EL, Graubard BI, Midthune D. Time-to-event analysis of longitudinal follow-up of a survey: choice of the time-scale. American journal of epidemiology. 1997;145(1):72–80. doi: 10.1093/oxfordjournals.aje.a009034. [DOI] [PubMed] [Google Scholar]
- 31.Thiébaut A, Bénichou J. Choice of time-scale in Cox’s model analysis of epidemiologic cohort data: a simulation study. Statistics in medicine. 2004;23(24):3803–3820. doi: 10.1002/sim.2098. [DOI] [PubMed] [Google Scholar]
- 32.Cheung YB, Gao F, Khoo KS. Age at diagnosis and the choice of survival analysis methods in cancer epidemiology. Journal of Clinical Epidemiology. 2003;56(1):38–43. doi: 10.1016/s0895-4356(02)00536-x. [DOI] [PubMed] [Google Scholar]
- 33.Duchesne T, Lawless J. Alternative time scales and failure time models. Lifetime Data Analysis. 2000;6(2):157–179. doi: 10.1023/a:1009616111968. [DOI] [PubMed] [Google Scholar]
- 34.Little RJ. Modeling the drop-out mechanism in repeated-measures studies. Journal of the American Statistical Association. 1995;90(431):1112–1121. [Google Scholar]
- 35.Schluchter MD. Methods for the analysis of informatively censored longitudinal data. Statistics in medicine. 1992;11(14–15):1861–1870. doi: 10.1002/sim.4780111408. [DOI] [PubMed] [Google Scholar]
- 36.Baumgart M, Snyder HM, Carrillo MC, Fazio S, Kim H, Johns H. Summary of the evidence on modifiable risk factors for cognitive decline and dementia: A population-based perspective. Alzheimer’s & Dementia. 2015;11(6):718–726. doi: 10.1016/j.jalz.2015.05.016. [DOI] [PubMed] [Google Scholar]
- 37.Rovio S, Kareholt I, Helkala EL, et al. Leisure-time physical activity at midlife and the risk of dementia and Alzheimer’s disease. Lancet Neurol. 2005;4(11):705–711. doi: 10.1016/S1474-4422(05)70198-8. [DOI] [PubMed] [Google Scholar]
- 38.Tucker JM, Welk GJ, Beyler NK. Physical activity in U.S.: adults compliance with the Physical Activity Guidelines for Americans. Am J Prev Med. 2011;40(4):454–461. doi: 10.1016/j.amepre.2010.12.016. [DOI] [PubMed] [Google Scholar]
- 39.González HM, Tarraf W, Rodríguez CJ, et al. Cardiovascular health among diverse Hispanics/Latinos: Hispanic Community Health Study/Study of Latinos (HCHS/SOL) results. American Heart Journal. 2016;176:134–144. doi: 10.1016/j.ahj.2016.02.008. [DOI] [PMC free article] [PubMed] [Google Scholar]
- 40.Gardener H, Wright CB, Dong C, et al. Ideal Cardiovascular Health and Cognitive Aging in the Northern Manhattan Study. Journal of the American Heart Association. 2016;5(3) doi: 10.1161/JAHA.115.002731. [DOI] [PMC free article] [PubMed] [Google Scholar]
- 41.Zlokovic BV. Neurovascular pathways to neurodegeneration in Alzheimer’s disease and other disorders. Nat Rev Neurosci. 2011;12(12):723–738. doi: 10.1038/nrn3114. [DOI] [PMC free article] [PubMed] [Google Scholar]
- 42.WHO. First WHO Ministerial Conference on Global Action Against Dementia. WHO; 2015. [Google Scholar]
Associated Data
This section collects any data citations, data availability statements, or supplementary materials included in this article.