

Abstract
Objective
Individuals with age-related hearing loss (ARHL) can restore some loss of the auditory function with the use of hearing aids (HAs). However, what remains unknown are the physiological mechanisms that underlie how the brain changes with exposure to amplified sounds though the use of HAs. We aimed to examine behavioral and physiological changes induced by HAs.
Methods
Thirty-five older-adults with moderate ARHL with no history of hearing aid use were fit with HAs tested in aided and unaided conditions, and divided into experimental and control groups. The experimental group used HAs during a period of six months. The control group did not use HAs during this period, but were given the opportunity to use them after the completion of the study. Both groups underwent testing protocols six months apart. Outcome measures included behavioral (speech-in-noise measures, self-assessment questionnaires) and electrophysiological brainstem recordings (frequency-following responses) to the speech syllable /ga/ in two quiet conditions and in six-talker babble noise.
Results
The experimental group reported subjective benefits on self-assessment questionnaires. Significant physiological changes were observed in the experimental group, specifically a reduction in fundamental frequency magnitude, while no change was observed in controls, yielding a significant time × group interaction. Furthermore, peak latencies remained stable in the experimental group but were significantly delayed in the control group after six months. Significant correlations between behavioral and physiological changes were also observed.
Conclusions
The findings suggest that HAs may alter subcortical processing and offset neural timing delay; however, further investigation is needed to understand cortical changes and HA effects on cognitive processing.
Significance
The findings of the current study provide evidence for clinicians that the use of HAs may prevent further loss of auditory function resulting from sensory deprivation.
Keywords: Amplification, hearing aids, frequency-following response, older adults, hearing loss, age-related hearing loss
Introduction
Older adults often experience significant difficulties understanding speech in non-favorable conditions, such as noisy or multi-talker environments (e.g., Pichora-Fuller et al., 1995, Schneider and Pichora-Fuller, 2001). These difficulties are often exaggerated by age-related sensorineural hearing loss (Fitzgibbons and Gordon-Salant, 2010), which is known to be one of the most prevalent health conditions among the elderly (Yueh et al., 2003). Given the communication difficulties experienced by older adults with hearing loss, is it possible for them to at least partially regain loss of auditory function? Several rehabilitation processes have been applied in research, such as counseling or patient-centered education, auditory training, and the provision of hearing aids. Hearing aids increase audibility and are currently the primary rehabilitation option for individuals with mild to moderately severe sensorineural hearing loss. Auditory training may also improve listeners’ communication and compensate for the degraded auditory signal (Sweetow and Palmer, 2005, Stecker et al., 2006, Sweetow and Sabes, 2006, Sweetow and Sabes, 2007, Sweetow and Henderson Sabes, 2010, Anderson et al., 2013c, Lavie et al., 2013, Olson et al., 2013, Ferguson et al., 2014, Karawani et al., 2016). However, signal audibility through the use of hearing aids is the first requirement for any training program to be effective.
Extensive research has documented the widespread benefits of the hearing aid rehabilitation process (Plomp, 1978, Fujikawa and Owens, 1979, Davis and Haggard, 1981, Humes, 1991, Jerger et al., 1996, Munro and Lutman, 2003, Lavie et al., 2014, Lavie et al., 2015). Generally, this research shows benefits of the use of hearing aids in easy listening conditions (Shanks et al., 2002), and in communication abilities and quality of life (Chisolm et al., 2007, Takahashi et al., 2007). However, evidence supporting auditory acclimatization with hearing aids – “the process in which hearing aid users become gradually accustomed to amplification” (Gatehouse, 1992, page 1258) – has been inconsistent, and the extent to which the auditory system adapts to new input remains unknown. For example, studies with unilateral hearing aid fittings demonstrated improved speech recognition in noise that was specific to the aided ear (Gatehouse, 1992, Munro and Lutman, 2003). Another study with unilateral hearing aid fitting demonstrated that experienced hearing aid users could improve performance in noise after hearing aids were set to new frequency responses, but these responses required eight to sixteen weeks for acclimatization to the new fitting (Gatehouse, 1993). Lavie et al. (2015) compared acclimatization effects for amplification in the dominant vs. nondominant ear (based on dichotic performance) and for bilateral amplification. They found improvement in performance on speech identification in noise and dichotic listening tasks, but the benefits were seen mainly for the nondominant ear and in unaided conditions. Summarizing early evidence of perceptual and neural changes, Munro (2008) concluded that hearing aid experience from monaural fitting can modify processing of the auditory system.
However, evidence of acclimatization after binaural hearing aids has not yet been demonstrated. Specifically, Humes and Wilson (2003) tracked changes in hearing aid performance and benefit in nine elderly binaural hearing-aid wearers over a three-year period following the hearing aid fitting. Little evidence of systematic improvement in aided performance or benefit was noted. A more recent study of new unilateral and bilateral hearing aid users and experienced hearing aid users found small gains in speech recognition across the three groups that were consistent with a practice effect (Dawes et al., 2014a). The reasons for differing evidence of acclimatization for unilateral and bilateral fittings are unknown, but perhaps the unilateral fitting induces greater reliance on the aided ear with consequent changes in perceptual performance.
Individual capacity for perceptual learning may also be a factor in acclimatization. Hearing aid users may differ in their ability to adapt to amplified speech; therefore, differences in perceptual learning might explain variability in improved performance with hearing aids over time (Gatehouse, 1993, Robinson and Summerfield, 1996). The capacity for auditory learning may be affected by maladaptive changes in the central system that accompany aging and hearing loss, thus limiting potential hearing aid benefits (Arlinger et al., 1996, Irvine et al., 2001). Even with optimally fit hearing aids, users often complain about difficulties with word recognition and speech understanding, in quiet and especially in the presence of background noise or other competing stimuli (Kochkin, 2000, Gordon-Salant, 2005) or in reverberant conditions (Bender et al., 1993, Van Tasell, 1993). These deficits may arise from age-related declines in temporal auditory processing. In particular, the ability of neurons in the central auditory system to accurately encode important temporal features of speech may be limited by impaired neural synchrony (Sergeyenko et al., 2013), delayed neural recovery (Walton et al., 1998), reduced phase locking (Parthasarathy et al., 2014), or other mechanisms associated with aging. These problems are exaggerated by the presence of sensorineural age-related hearing loss. Age-related hearing loss may alter spatial and temporal response properties in the auditory system (Willott et al., 1991, Irvine et al., 2001) which interferes in the gain mechanism of the auditory cortex (Morita et al., 2003, Wienbruch et al., 2006). The effects are especially salient when the target speech stream is masked by background noise (Anderson et al., 2013a). Hearing aid amplification results in stimulation of the auditory pathways that have been altered by auditory deprivation, and in some individuals, by processes associated with aging. In addition, hearing aids significantly modify the physical characteristics of sound, which may explain why adjusting to new hearing aids requires time and practice (Watson, 1991, Robinson and Summerfield, 1996, Tyler and Summerfield, 1996).
Taken together, it is still not clear whether the use of hearing aids can drive beneficial plastic changes in perceptual functions that are relevant to speech understanding in non-optimal listening conditions. In addition, the neural mechanisms that are derived by the use of hearing aids are still unknown. Finally, if neural changes do occur, what are the physiological mechanisms that underlie the changes induced by use of hearing aids?
A few electrophysiological studies in older adults have assessed amplification effects on subcortical (Anderson and Kraus, 2013, Easwar et al., 2015, Jenkins et al., 2017) and cortical (Van Dun et al., 2016, Jenkins et al., 2017) auditory regions at the time of hearing aid fitting. Jenkins et al. (2017) recorded frequency-following responses (FFRs) and cortical-auditory evoked potentials to a speech syllable /ga/ presented through a speaker. The FFR results demonstrated higher phase locking, earlier latencies, and higher amplitudes to the transition region of the speech syllable in aided vs. unaided conditions. The cortical results showed that amplification resulted in earlier latencies and increases in amplitude. Easwar et al. (2015) also investigated aided and unaided FFRs using direct audio input of a male-spoken token /susa∫i/ representing a wide range of frequencies in older listeners with hearing loss. Amplification resulted in increased detectability and amplitude of the response. Widening the hearing aid bandwidth from a low-pass filter cutoff of 1 kHz up to 4 kHz increased detectability, suggesting that the FFR may be used to verify audibility and to evaluate the effects of manipulating hearing aid parameters.
Increased audibility with amplification in older adults with hearing loss was also demonstrated with cortical potentials with higher P1-N1 amplitudes in amplified vs. unamplified testing condition for stimuli presented at low and moderate levels (Van Dun et al., 2016). Korczak et al. (2005) also used cortical evoked potentials to test amplification effects in younger adults with sensorineural hearing loss and found that amplification by the use of personal hearing aids substantially improved the detectability of all the cortical peaks. These studies show that amplified stimuli results in better neural encoding of the amplified speech signal because of the improved audibility that is available immediately after amplification. However, other cortical studies in normal-hearing young adults (e.g. Billings et al., 2007, Billings et al., 2011) revealed no changes in cortical auditory evoked potentials morphology in aided conditions. Billings et al. (2007) for example, compared intensity-growth functions for aided and unaided conditions in normal-hearing young adults and found no differences in cortical auditory evoked potentials morphology between aided and unaided conditions. Billings et al. (2011) noted that aided cortical evoked potentials were surprisingly smaller and delayed relative to unaided conditions, suggesting that hearing aids modify stimulus characteristics in a way that does not reliably reflect hearing aid gain.
All these previous studies examined amplification during a single session immediately after hearing aid fitting, but not the effects of hearing aid use over a period of time. Dawes et al. (2014b) studied neural changes in first time hearing aid users using the N1 and P2 event related potentials and did not find amplitude changes following twelve weeks of hearing aid use, suggesting a lack of acclimatization in neural encoding, at least for these cortical peaks. A more recent cortical study by Rao et al. (2017) examined amplification effects of the use of hearing aids over a course of four weeks. They tested older adults with mild to moderate hearing loss who were first time users using the P3 attention-related cortical component. They showed that after four weeks of hearing aid use, physiological changes were observed; specifically, a significant P3a amplitude reduction was reported, however perceptual benefits assessed by Hearing in Noise Test (HINT) were not observed. Therefore, amplification effects may differ depending on the specific collection protocol and peaks examined.
A common misconception is that the amplification of sound corrects for hearing loss in the same way eyeglasses can do for correctable vision problems (Davis et al., 2016 page S261). Older adults may have limited tolerance for amplification, and they frequently describe amplified sounds as being louder, but not necessarily clearer (Davis et al., 2016). This complaint has not changed across the decades, despite improvements in amplification technology (e.g. Bentler and Duve, 2000). Therefore, the current study will examine improvement in speech perception based on clinical tests and subjective assessments from questionnaires and will study the physiological effects of hearing aid use over a course of six months in different listening conditions. The goals of the current study are (1) to investigate the effects of hearing aid use on speech perception performance of older adults with age-related hearing loss assessed by perceptual tests and questionnaires, (2) to compare changes in neural processing over time between hearing aid users and non-users, and (3) to assess relationships among behavioral and physiological changes associated with hearing aid use.
2. Materials and Methods
2.1. Participants
Fifty-five adults (32 females) between the ages 60-84 years (mean age = 72.3 years ± 7 months) from the Washington D.C. metro area, were recruited for the study, through the use of flyers distributed across the University of Maryland campus, local senior living communities, and through Craigslist advertisements.
A power analysis based on auditory training data indicated that 32 participants were needed for an alpha level of 0.05. Given the demands of this study, we anticipated some degree of attrition so we enrolled 36 participants who met the inclusionary criteria of age 60-84 years, mild-to-moderate sensorineural hearing impairment with no neurologic disorders, English as a first language and no previous experience with hearing aid use. As music training has been found to have effects on subcortical auditory processing (Bidelman and Krishnan, 2010, Parbery-Clark et al., 2012), professional musicians were included from the study. A final number included thirty-five adults (20 females) aged 62-82 years (mean age = 74.4 years ± 5 months) who completed the study (Figure 1) and their data are included in the analyses reported in this manuscript.
Figure 1.
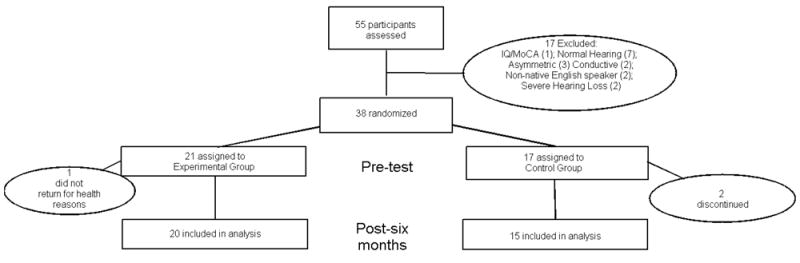
Flowchart. Flow of participants randomly assigned to Experimental (Hearing Aid Use) or Control (No Hearing Aid Use) groups.
All procedures were approved by the Institutional Review Board of the University of Maryland. Participants provided informed consent and were compensated for their time. Pure-tone behavioral thresholds were obtained bilaterally for air and bone conduction.
Participants had hearing levels ranging from mild to severe, with pure-tone averages ≥ 25 dB HL from 500-4000 Hz, no pure-tone thresholds ≥ 90 dB HL at any frequency, no air-bone gaps of 15 dB HL or greater at two or more adjacent frequencies, and no interaural asymmetries of 15 dB HL or greater at two or more frequencies. There were no significant differences in pure tone average (500 Hz-2000 Hz) between the right and left ears in air and bone conduction thresholds (t(33) ≤ 1.03, p ≥ 0.25); therefore, both ears were averaged for each participant in Figure 1. All participants had normal click-evoked auditory brainstem response (ABR) latencies for age and hearing loss (wave V < 6.8 ms; Otto and McCandless, 1982), measured by click stimulus of 100 μs at 80 dBpeSPL (peak equivalent) and a rate of 21.1 Hz. All participants had normal IQs (≥ 85) as evaluated using the Wechsler Abbreviated Scale of Intelligence (mean ± sd: 113.05 ± 14.76; WASI; Zhu and Garcia, 1999) and were screened for dementia using a criterion score of 22/30 on the Montreal Cognitive Assessment (mean ± sd: 25.74 ± 2.27; MOCA; Nasreddine et al., 2005). All participants were native speakers of English, had no history of neurological disorders and had no previous experience with hearing aid use.
2.2. Study Design
The study used a controlled and randomized design. Potential participants were first evaluated to determine if they met study criteria based on audiometric and cognitive testing. The participants who met criteria were then assigned to either the experimental or control groups using a random group generator in Excel. Both groups of participants were then fit with bilateral hearing aids in the lab. The experimental group wore their newly fitted hearing aids for a period of six months (Experimental group: mean age = 75 ± 6.2, n = 20). The control group were not provided with hearing aids during the six-month period (Control group: mean age = 74 ± 5.6, n = 15). Six months after the pre-test all participants underwent another identical post-test session. After the completion of the study, both groups were provided the option of purchasing hearing aids for a reduced price. As shown in Table 1, both groups were matched on all demographic criteria. Independent samples t tests were conducted to confirm that the two groups did not differ statistically in terms of age, sex, hearing, intelligence (IQ assessed by WASI) and dementia (screened by MOCA). Audiograms are shown in Figure 2.
Table 1.
Demographic. Groups are matched on all demographic criteria. Means (SDs) are displayed for age, sex distribution, hearing, IQ, and Montreal Cognitive Assessment (MOCA) scores. t-values with degrees of freedom and p-values of the group comparison are also shown.
| Experimental | Control | t(33) | p | |
|---|---|---|---|---|
| N | 20 | 15 | ||
| Age (years) | 75 (6.3) | 74 (5.6) | 0.650 | 0.520 |
| Male/female | 9/11 | 6/9 | 0.682 | 0.500 |
| Pure-tone average hearing (0.5–4 kHz; dB | 43.10 (6.7) | 38.74 (6.9) | 2.000 | 0.467 |
| High-frequency hearing (6–8 kHz; dB HL) | 66.56 (11.6) | 62.22 (13.9) | 0.767 | 0.448 |
| IQ | 113.08 (9.4) | 112.69 (6.9) | 1.670 | 0.110 |
| MOCA | 26.36 (1.6) | 25.23 (2.5) | 1.786 | 0.084 |
Figure 2.
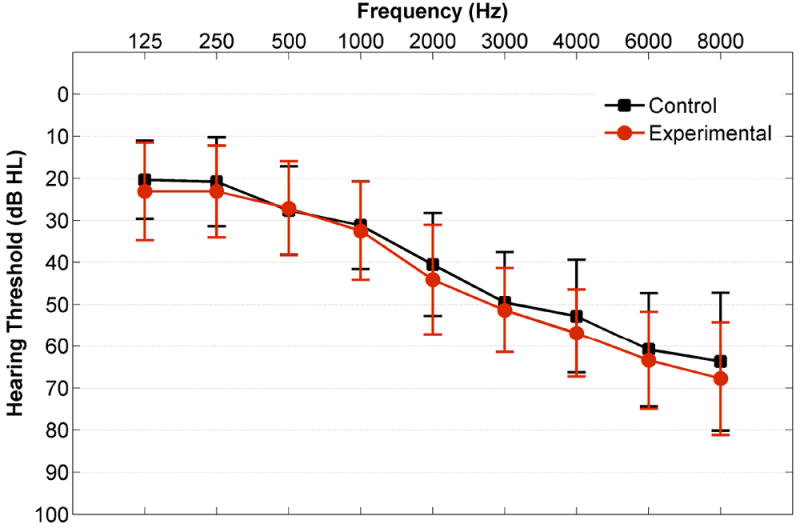
Audiogram. Mean unaided air conduction hearing thresholds across ears and participants are plotted for the experimental (red) and control (black) groups. Error bars represent standard deviations (SDs).
2.3. Hearing aid fitting
All participants were fit bilaterally with Widex Dream 440 receiver-in-the-canal hearing aids with size M receivers and domes most appropriate for their hearing loss (open: thresholds for 250-500 Hz < 30 dB HL; tulip: individual thresholds for 250-500 Hz ≥ 30 dB HL). The hearing aid fitting was performed immediately following the audiologic examination on the first day of testing. The hearing aids accommodate hearing losses up to 85 dB HL from 125-8000 Hz when coupled with M receivers. Open domes are more variable in terms of the amount of low-frequency gain provided by the hearing aids; however, their use was preferable as participants were required to wear their hearing aids for eight hours per day. This fitting increases the likelihood of patient comfort and compliance with wearing the aids for the hours needed for the study. Hearing aid use (average hours/day) were monitored through the hearing aid data logging function, which was calculated and displayed by the manufacturer’s hearing aid fitting software. A single automatic program was used for the purposes of this study. Individual hearing aid controls were deactivated so that participants were not able to alter the hearing aid gain. This program had an extended input dynamic range of 113 dB SPL, 15 frequency channels, wide dynamic range compression, directional microphones, and noise reduction technology. The hearing aids were linked using ear-to-ear communication technology for compression, speech enhancement, and feedback cancellation.
Real-ear measurements were performed to verify the fitting. Hearing aids were adjusted to match NAL-NL2 prescriptive targets for International Speech Test Signal stimuli (Holube et al., 2010) presented at 55 dB SPL, 65 dB SPL, and 75 dB SPL. The actual aided SPLs obtained from real-ear testing and the differences between actual and targets for 250 to 4000 Hz at 55, 65, and 75 dB SPL in each ear were measured (as reported in Table 2). The levels were generally within a few dB of the target values (differences from target ranging from -3 dB to +3 dB at 55 and 65 dB levels from 250-2000 Hz). At 4000 Hz the differences from target were greater, up -9.3 dB, as it was not possible to provide sufficient gain to meet the targets. Most of the output values met the Goodness of Fit test (F > 5.315, p < 0.030, R-squared > 0.181). Maximum power output (MPO) measurements were performed to ensure that the hearing aids were not uncomfortably loud.
Table 2.
Real-ear measurement values are summarized. Mean output levels (SPL) and mean differences between the outputs and the NAL-N2 targets (Target Diff.) are displayed along with standard deviations for the right and left ears at 55, 65, and 75 dB SPL input levels. The levels are generally within a few dB of the target values except for the 55 and 65 dB levels at 4000 Hz, at which it was not possible to provide sufficient gain to meet the targets. The Output values in regular font meet the Goodness of Fit test (F > 5.315, p < 0.030, R-squared > 0.181) and values in lighter font do not meet the Goodness of Fit test (F < 3.753, p > 0.064, R-squared < 0.126).
| 250 Hz | 500 Hz | 1000 Hz | 2000 Hz | 4000 Hz | |||||||
|---|---|---|---|---|---|---|---|---|---|---|---|
| dB SPL | Ear | Output | Target Diff. | Output | Target Diff. | Output | Target Diff. | Output | Target Diff. | Output | Target Diff. |
| 55 | Right | 48.17 (2.5) | 0.28 (4.2) | 49.97 (4.5) | -1.59 (5.3) | 55.48 (5.3) | 1.83 (5.9) | 62.79 (6.6) | -2.90 (5.1) | 58.76 (5.5) | -8.97 (7.8) |
| Left | 48.21 (3.5) | 0.07 (4.7) | 50.26 (4.9) | -2.10 (4.6) | 55.96 (8.2) | 0.64 (5.7) | 63.75 (8.12) | -3.07 (4.7) | 60.52 (7.4) | -9.32 (7.7) | |
| 65 | Right | 56.50 (2.06) | 0.89 (1.6) | 58.89 (4.0) | 0.29 (4.7) | 63.21 (5.1) | 3.86 (4.6) | 69.39 (6.7) | 0.61 (3.5) | 65.86 (5.9) | -7.29 (5.3) |
| Left | 56.96 (3.6) | 1.21 (3.9) | 59.41 (3.8) | 0.11 (3.3) | 62.63 (6.3) | 2.25 (4.0) | 69.46 (7.1) | -1.89 (4.0) | 68.11 (7.8) | -4.93 (7.3) | |
| 75 | Right | 55.77 (3.69) | -9.18 (3.8) | 63 (3.9) | -4.18 (3.9) | 70.55 (5.6) | 5.95 (4.9) | 77.59 (7.2) | 4.05 (4.3) | 74.23 (7.2) | -2.05 (6.0) |
| Left | 55.71 (4.0) | -9.38 (3.9) | 62.10 (4.9) | -4.95 (4.9) | 70.05 (6.2) | 6.00 (5.2) | 77.71 (6.5) | 3.62 (4.6) | 76.71 (7.7) | 0.24 (7.8) | |
2.4. Pre- and Post-Tests
All participants underwent identical tests on perceptual speech-in-noise tasks and audiometric measures and filled out a series of questionnaires. In addition, they underwent electrophysiological brainstem recordings. Perceptual and electrophysiological tests were performed in 1) aided (while wearing hearing aids) and 2) unaided (without wearing hearing aids) conditions. These tests were conducted over the course of two days (three hours each session) at the pre-test session and then at the post-test session six months later. The experimental group received a hearing aid orientation and began daily use of hearing aids after the second session. They were seen for four additional sessions at two weeks, six weeks, twelve weeks, and eighteen weeks to answer questions regarding hearing aid insertion or operation and to check hearing aid data logging information to ensure compliance with hearing aid use. Participants were counseled that the hearing aids were set appropriately for their hearing losses, and that adjustments could not be made during the six months of the study. Therefore, no changes were made to the hearing aids (including amplification, gain, etc.). The control group wore the hearing aids while being tested but did not again wear the hearing aids until they returned for repeat testing six months later. Details of the behavioral and electrophysiological measures are listed below.
2.4.1. Behavioral measures
2.4.1.1. Speech-in-noise perception
Evaluation of the speech in noise perception was conducted using the Quick Speech-in-Noise Test (QuickSIN, Etymotic Research) (Killion et al., 2004). The QuickSIN is a nonadaptive clinical measure of speech-in-noise perception; sets of six sentences are presented binaurally at 70 dB HL in a background of four-talker babble. The stimuli were presented binaurally through a speaker placed one meter from the participants at 0° azimuth via an AC440 clinical audiometer (Interacoustics, Eden Prairie, MN). This position was pre-measured and marked to make sure that each listener sits in the same position in each session. The first sentence in each set was presented at a +25 dB signal-to-noise ratio (SNR), and the SNR decreased by 5 dB for each of the five subsequent sentences down to a 0 dB SNR (similar to Killion et al., 2004). The SNR scores were averaged across four lists to obtain a composite SNR score. Different sentence sets were presented in each testing session. Such that a reduced SNR loss value suggests improvements in the ability to understand speech in noise. The QuickSIN has been shown to be sensitive to detect changes in speech in noise perception by the use of hearing aids (Mendel, 2007). This test was chosen because it is the most frequently used tool in the clinic.
2.4.1.2. Questionnaires
Two sets of questionnaires were used in the current study. All participants were requested to complete the pre-fitting questionnaires before their first session and to return completed questionnaires before the post-test session.
The Abbreviated Profile of Hearing Aid Benefit (APHAB) “is a 66-item self-assessment, disability-based inventory that is used to document the outcome of a hearing aid fitting, to compare several fittings, or to evaluate the same fitting over time. It produces scores for unaided and aided performance as well as hearing aid benefit” (in Cox and Alexander, 1995, page 176). “The APHAB subscales are labeled as Ease of Communication (EC), Reverberation (RV), Background Noise (BN), and Aversiveness (AV)” (in Cox and Alexander, 1995, page 177). In order to determine the benefit from the hearing aids, the scores of the aided and unaided performance were compared to calculate the pre to post benefits with the use of hearing aids for the experimental group only. Original letter scores provided by APHAB questionnaire were quantified for statistical calculations as follows: 1 for A-Always (99%), 2 for B-Almost Always (87%), 3 for C- Generally (75%), 4 for D-Half-the-time (50%), 5 for E-Occasionally (25%), 6 for F- Seldom (12%) and 7 for G- Never (1%) (in Cox and Alexander, 1995, Appendix A).
The Speech, Spatial and Qualities of Hearing Scale (SSQ) is a 49-item self-assessment of hearing ability/disability in a variety of complex listening situations typical of those encountered in everyday life (Gatehouse and Noble, 2004, Noble and Gatehouse, 2004, 2006). It is designed to measure a range of hearing disabilities across several domains. “Particular attention is given to 1) hearing speech in a variety of competing contexts, and to the directional, distance and movement components of 2) spatial hearing. In addition, the ability to segregate sounds and to attend to simultaneous speech streams is assessed, reflecting the reality of hearing in the everyday world. 3) Qualities of hearing experience include ease of listening, and the naturalness, clarity and identifiability of different speakers, different musical pieces and instruments, and different everyday sounds” (in Gatehouse and Noble, 2004, page 2). As noted by Noble at al. (2008) responses are scored on a 0-10 Likert scale, in which 0 reflects great difficulty and 10 reflects no difficulty (Noble et al., 2008). In the current manuscript, each subscale was assessed for the experimental and control groups for pre- and post-measures. Specifically, for each participant the 14 items of the speech subscale were averaged, and then a total average of each speech subscale was averaged for each group separately for the pre- and post-measures. The same procedure was done for the spatial and qualities items.
2.4.2. Electrophysiological measures
All tests were conducted in a sound-treated, electrically-shielded booth with the lights off to reduce electrical interference. Participants were seated 2 meters in front of an Interacoustics SP90 speaker at 0° azimuth. This position was pre-measured and marked to make sure that each listener sits in the same position and place in each session. A speech syllable /ga/ was presented through the speaker via Presentation software (Neurobehavioral Systems, Inc.). The stimulus was presented through sound field rather than via direct input to allow processing through the hearing aid microphones and to simulate listening situations that were ecologically valid. During the recording session, the participants were seated in an upright position so that the microphones of the hearing aids were in the same plane as the speaker at a relative angle elevation of 0 degrees. They watched a silent movie with subtitles playing on a projector screen to promote relaxation and a state of calm wakefulness and to minimize head movement.
Stimuli
A 170-ms speech syllable /ga/ synthesized with a Klatt-based synthesizer (Boersma and Weenink, 2009) at 20 kHz was the chosen stimulus. The stimulus was characterized by a 10-ms onset burst followed by a 50-ms consonant-vowel transition and a steady-state vowel region from 60 to 170 ms. Voicing was constant for the duration of the stimulus with a fundamental frequency (F0) of 100 Hz. The transition region was characterized by rapidly changing formants: the first formant rose from 400 Hz to 720 Hz, the second formant fell from 2480 Hz to 1240 Hz, and the third formant fell from 2580 Hz to 2500 Hz; all three formants stabilized for the steady-state region of the syllable. The fourth through sixth formants remained constant over the entire duration of the syllable at 3300, 3750, and 4900 Hz, respectively. This stimulus was chosen to investigate amplification effects on audibility of the higher frequency information present in the transition region of the syllable. The /ga/ was presented in three listening conditions: 1) 65 dB SPL in quiet; 2) 80 dB SPL in quiet; and 3) 80 dB SPL in the presence of 70 dB SPL 6-talker babble (+10 dB SNR, noise condition). The 6-talker babble was taken from the Words-in-Noise (WIN) sentence lists (Wilson et al., 2003) and was continually played on a 4.6 second loop. Prior to recording, the /ga/ and noise stimuli were calibrated to within ± 1 dB of the desired stimulus level using a Larson Davis System 824 sound level meter at ear level.
Recording
Frequency following responses (FFRs) were collected with a standard vertical montage of five electrodes (Cz active, two forehead ground, earlobe references) and was used with all offsets < 40 μV. The /ga/ stimulus was presented with alternating polarities at a rate of 4 Hz. Responses were recorded using the Biosemi Active Two acquisition system (BioSemi B.V.) with a sampling frequency of 16,384 Hz. A single run of 2300 artifact-free sweeps was collected for each condition. All three listening conditions were recorded consecutively during one test session in both aided and unaided conditions, resulting in a total of six listening conditions per participant. The order of stimulus presentation and amplified conditions was randomized.
Data Reduction
The sweeps were averaged and processed off-line using MATLAB (MathWorks, version R2011b). The time window for each sweep was -50 to 185 ms referenced to the stimulus onset. The stimulus onset in the aided conditions was adjusted by 2 ms to allow for hearing aid processing time (based on information received from Widex USA). Responses were digitally filtered by a bandpass-filter (70- 2000 Hz) using a 4th order Butterworth filter in order to minimize the effects of low-frequency signals that originate from the cortex (Dinse et al., 1997). ± 30 μV criterion was used for artifact rejection. A final average response was generated by averaging the first 2000 artifact-free sweeps of both polarities (1000/polarity) so that the influence of cochlear microphonic and stimulus artifact on the response can be minimized and in order to maximize the envelope response (Gorga et al., 1985, Aiken and Picton, 2008, Campbell et al., 2012).
The following FFR measures were analyzed: peak latency, response amplitudes in the time and frequency domains and phase locking factor values of the response. Each measure was analyzed for each Aiken stimulus condition (65 dB in quiet, addressed as: 65 dB, 80 dB in quiet, addressed as: 80 dB, and 80 dB in noise, addressed as: Noise) and for each amplification condition (aided, unaided) in the pre- and post-test sessions.
Response amplitude and latency
Root-mean-square (RMS) amplitude was calculated for the transition (18-68 ms) and steady-state (68-170 ms) regions of the response. An automatic peak-picking algorithm was conducted in MATLAB that identified the peak that was closest to the expected latency (within 2 ms), based on average latencies obtained in previous studies (Anderson et al., 2012, Anderson et al., 2013d, Presacco et al., 2014). A trained peak picker confirmed the identification of each peak and then made changes where needed. The first consistently identifiable peak of the consonant transition (~31 ms) was used in the analysis.
Fundamental frequency (F0)
F0 amplitudes were calculated over 60-Hz bins for the transition and 20-Hz bins for the steady-state regions from all responses by the use of a fast Fourier transform with zero padding to allow an FFR bin resolution of 1 Hz.
Phase Locking Factor (PLF)
The complex Morlet wavelets were used to decompose the signal between 80 and 800 Hz (1-Hz step) and to analyze the PLF of each sweep in the time-frequency domain (Tallon-Baudry et al., 1996). The PLF was calculated by dividing the convolution of the complex wavelet with the signal by its absolute value: , leading to a complex value that describes the phase distribution at each frequency and point in time. The final PLF was represented by the modulus of the average across sweeps of this complex value, which ranges from 1 (phase-locked) to 0 (non-phase locked). The mean values for the F0 were averaged in 10 Hz bins across the transition and steady-state regions.
2.5. Statistical Analyses
Statistical analyses were conducted in SPSS version 23. Data were normally distributed within each group (p > 0.12; Shapiro Wilk tests) and variances were homogeneous across groups (p > 0.16; Levene tests).
To study whether hearing aid use results in greater pre- to post-test changes in the experimental than in the control group, pre- and post-test outcomes were compared between groups using a Repeated Measures ANOVA with group (control vs. experimental) as the between-subject factor, and time (pre vs. post) as the main within-subject factor, in addition to other within-subject factors depending on the data being analyzed. Within-subject factors are described in detail in the results section. When significant interactions were observed, univariate ANOVAs and pairwise comparisons were conducted. Since there are multiple measures, please refer to the degrees of freedom in each analyses to obtain the number of data analyzed per measure. In addition, Pearson correlations were conducted to study the relationship between the behavioral and physiological outcomes.
3. Results
3.1. Behavioral Measures
In general, there were no significant differences between the experimental and the control groups in the behavioral pre-test measures in aided and unaided conditions (t(33) ≤ 2.000, p ≥ 0.054). However, one significant pre-test difference was observed between both groups in the QuickSIN pre-test scores in the aided condition only, where the scores of the control group (mean = 4.44, SD = 2.18) were significantly better (t(33) = 2.279, p = 0.030) than the experimental group (mean = 5.61, SD = 3.47). This difference may relate to slightly higher pure-tone thresholds in the experimental group than in the control group.
3.1.1. Speech in noise perception
To determine if use of hearing aids resulted in improved speech-in-noise performance, pre- and post-test QuickSIN scores were compared between groups (Figure 3), using a repeated measures (RM) ANOVA with one between-subject factor (group: experimental vs. control) and two within-subject factors (time: pre-test vs. post-test; amplification condition: aided vs. unaided), followed by univariate ANOVAs and t-test analyses. As seen in Figure 3 the QuickSIN scores appear to improve in both aided and unaided conditions in the experimental group. However, an improvement is also apparent in the control group in the unaided condition. Therefore, these results might suggest a practice effect rather than a true change in performance with hearing aid use.
Figure 3.
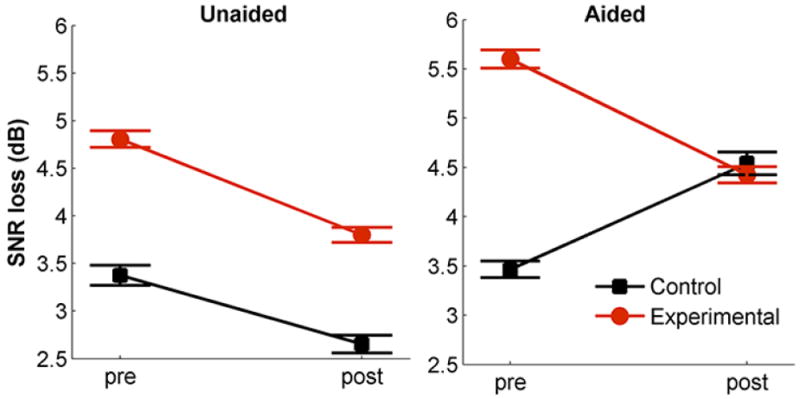
Represents Quick speech-in-noise performance (in SNR loss) for the experimental (red) and control (black) groups across the pre- and post-sessions and across aided and unaided conditions. Error bars represent standard errors of the mean (SE).
The RM ANOVA indicated a time × group interaction (F(1,28) = 6.739, p= 0.015, η2p = 0.194) that was driven by improved performance in the experimental group in the aided condition (as shown in Figure 3). Although no time × group × amplification interaction was found (F(1,28) = 2.972, p = 0.096), a main effect of amplification was found (F(1,28) = 9.013, p= 0.006; where the unaided scores were lower (better) than the aided scores). No main effect of time or group was observed (p > 0.08). Follow-up RM ANOVAs for each amplification condition indicated a significant time × group interaction in the aided condition (F(1,30) = 9.780, p = 0.004, η2p = 0.264), but not in the unaided condition (F(1,29) = 0.236, p = 0.631). The time × group interaction in the aided condition shows that the experimental group scores significantly decreased in the post test for the aided condition (t(19) = 2.634, p = 0.016), while the control group’s scores did not change significantly (p = 0.083). As suggested earlier, looking at Figure 3 one can observe that the QuickSIN score was lower in the post-test for both the experimental and the control groups for the unaided condition (although these did not reach significance, p = 0.059, p = 0.373 respectively), therefore the time × group interaction in the aided condition is likely due to the fact that the control group’s performance actually worsened after six months, rather than due to actual improvement in perception in the experimental group with hearing aid use. The finding of improvement in the experimental and the control groups suggests a practice effect rather than a true change in performance with hearing aid use.
3.1.2. Questionnaires
APHAB
Paired sample t-tests were conducted for the four subscales listed by Cox and Alexander (1995) for the experimental group only, because the questionnaire is dependent on hearing aid use. To assess hearing aid benefit, the scores of the unaided (pre) and aided (post) performance were compared (Figure 4). As seen in Figure 4, hearing aid use resulted in improvement in Ease of Communication (EC), Reverberation (RV), and Background Noise (BN) subscales. However, Aversiveness (AV) to sounds increased with the use of hearing aids. These differences between pre and post use of hearing aids were all significant (EC: (t(15) = 3.078, p = 0.01; RV (t(15) = 5.029, p < 0.001; BN (t(15) = 2.436, p =0.031; AV (t(15) = -3. 78, p = 0.003). The differences in these three subscales (EC, RV, and BN) suggest improved communication with hearing aid use over the course of the 6-month time period (Figure 4), despite increased awareness of aversive sounds
Figure 4.
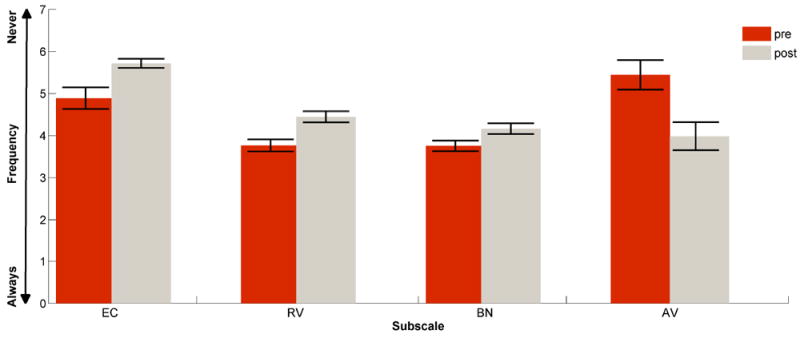
Represents the Abbreviated Profile of Hearing Aid Benefit (APHAB) in the experimental group, for the pre-unaided (red) vs. post-aided responses (grey) for each subscale: Ease of Communication (EC), Reverberation (RV), Background Noise (BN), and Aversiveness (AV). The y-axis represents the frequency as following: 1 = Always (99%), 2 = Almost Always (87%), 3 = Generally (75%), 4 = Half-the-time (50%), 5 = Occasionally (25%), 6 = Seldom (12%), 7 = Never (1%). Error bars represent standard errors of the mean (SE).
SSQ
SSQ pre and post rating scores for the Speech, Spatial and Qualities subscales were compared between groups (Table S1) using a RM MANOVA with one between subject factor: (group: experimental vs. control) and one within subject factor (time: pre-test vs. post-test) for the three subscales (Speech, Spatial and Qualities) followed by univariate ANOVAs. Table S1 shows that the experimental group’s post responses improved in the Speech subscale only with no changes in the control group; however, as detailed below, the changes in the experimental group were not significant after correcting for multiple comparisons.
RM MANOVA shows a main effect of time (F(3,25) = 5.701, p = 0.004, η2p = 0.406), but no significant time × group interaction (F(3,25) = 1.116, p = 0.361, η2p = 0.118). Main effects of time (F(1,27) = 4.830, p = 0.037, η2p = 0.152; higher post-scores than pre-scores) and group (F(1,27) = 4.895, p = 0.036, η2p = 0.153; the experimental group had lower scores than the control group) were observed. These main effects were seen in the Speech subscale only. Paired samples t test analysis indicated a significant difference between pre and post responses of the experimental group in the speech subscale (t(16) = 2.183, p = 0.044), where the post responses were significantly better than the pre responses, although this effect was not significant after correcting for multiple comparisons. No differences between pre and post scores were observed in the control group (t(12) = 0.699, p = 0.498).
3.2. Electrophysiological Measures
The following FFR measures were compared across groups and across conditions: 1) transition peak latency, 2) response amplitudes in the time (RMS) and frequency domains (F0) for the transition and steady-state regions of the response, 2) PLF (F0) of the transition and steady-state regions of the response. Independent samples t tests did not show any significant differences between the groups in any of the electrophysiological measures in the transition or in steady-state regions of the response or in any of the stimulus listening conditions at the pre-test (t(33) ≤ 1.938, p ≥ 0.061).
Peak Latency
Pre- and post-test peak latencies were compared across both groups using a RM ANOVA with group (control vs. experimental) as a between-subject factor and time (pre-test vs. post-test), amplification (aided vs. unaided) and stimulus (65 dB, 80 dB, Noise) conditions as within-subject factors followed by pairwise analysis and univariate analysis for each stimulus condition. Figure 5 and Table S2 describe peak latency changes between the pre-and post-tests for the experimental and control group. Table S2 describes mean latencies across sessions and amplification conditions for each group and reports statistical results for main effects and interactions for each stimulus condition, and across all conditions. As seen in Figure 5, peak latencies did not change in the experimental group, but they increased in the control group in both aided quiet conditions (65 dB and 80 dB).
Figure 5.
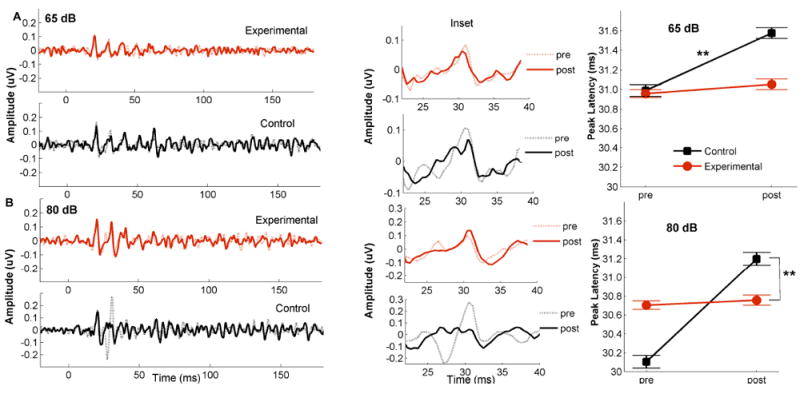
Pre- (shaded lines) and post- (strait lines) grand average waveforms (Right) with an inset (middle), and peak latency means (in milliseconds) (Left) are shown for the experimental (red) and control (black) groups for aided 65 dB SPL (A) and aided 80 dB SPL (B) conditions. Error bars represent standard errors of the mean (SE). ** p < 0.01.
RM ANOVA shows significant interactions: time × amplification × group (F(1,30) = 4.299, p = 0.047, η2p = 0.125) and time × stimulus × group: F(1,30) = 3.760, p = 0.035, η2p = 0.206). These interactions were driven by increases in peak latencies from the pre- to post-test sessions in the control group in the 65 dB and 80 dB in quiet for aided conditions (t(13) = 3.357, p = 0.005, t(13) = 3.684, p = 0.003 respectively) that were not observed in the experimental group in any of the stimulus conditions (t(17) < 0.868, p > 0.397). There was no main effect of group for any stimulus level (all p > 0.20), but there was a main effect of amplification with earlier latencies in the aided condition (65 dB: p = 0.002, 80 dB: p < 0.001, Noise: p = 0.002). Taken together, these results suggest that amplification may offset the latency delays that may be expected over time in older adults with hearing loss.
Root-mean-square amplitude
Pre- and post-test measures for the RMS were compared across both groups using a RM ANOVA with group (control vs. experimental) as a between-subject factor, time (pre- test vs. post-test), amplification (aided vs. unaided), stimulus (65 dB, 80 dB, Noise) conditions and region (transition, steady state) as within-subject factors followed by univariate ANOVAs and pairwise comparisons. No change in amplitude was observed in either group. RM ANOVA did not show a significant time × group interaction (F(1,20) = 0.026, p = 0.873). In addition, no significant interactions were found for the time × region × group or time × stimulus × group or time × amplification × group analyses (F(1,20) ≤3.038, p ≥ 0.097). There was a main effect of stimulus (F(2,19) = 25.172, p < 0.001; where the RMS values were larger for the 85 dB stimulus condition, and a main effect of region (F(1,20) = 20.530, p < 0.001; where the RMS was larger in the transition region. No main effects of amplification, time or group were observed (p > 0.124). These results suggest that improvement from hearing aid use is not detectable through RMS measures of the response.
Amplitude of the Fundamental Frequency
Pre- and post-test measures of F0 magnitude were compared across groups using a RM ANOVA with group (control vs. experimental) as a between-subject factor, time (pre-test vs. post-test), amplification (aided vs. unaided) and region (transition, steady state) as within-subject factors for each stimulus condition (65 dB, 80 dB, Noise).
As seen in Table S3 and Figure 6, F0 decreased in the experimental group but did not change in the control group. This change was only observed in the 65 dB stimulus condition, as reported below.
Figure 6.
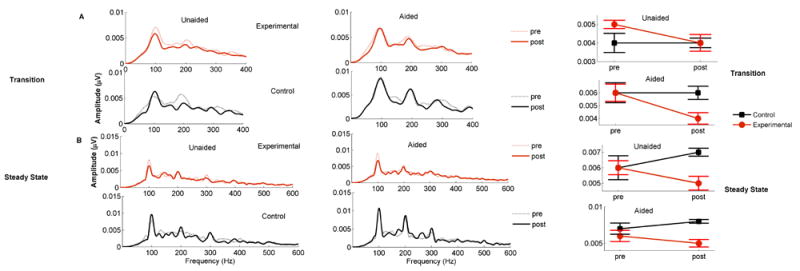
Fast Fourier transform (FFT)- Right Panel represent the FFT analysis for the pre (shaded lines) and post (strait lines) across the experimental (red) and control (black) groups for the aided and unaided conditions are shown for the transition (A) and steady state (B) regions of the response. The Left panel represent mean pre- and post- F0 amplitudes (in μV) for experimental and control groups across conditions. Error bars represent standard errors of the mean (SE).
65 dB
There was a significant time × group interaction (F (1,30) = 5.890, p = 0.021, η2p = 0.164), driven by decreased amplitude in the experimental group (F(1,18) = 3.385, p = 0.035) that was not seen in the control group (F(1,12) = 2.535, p= 0.137), as shown in Table S3. Although there was a main effect of amplification (F(1,12) = 5.758, p = 0.023; aided F0 amplitudes larger than unaided) and a main effect of region (F(1,12) = 14.585, p = 0.001; transition F0 amplitudes larger than steady state), the time × amplification × group (F(1,30) = 0.431, p = 0.516) and time × region × group (F(1,30) = 0.523, p = 0.475) interactions were not significant, indicating that this effect was similar across regions and amplification conditions, as shown in Table S3. There was no main effect of group (F(1,30) = 2.240, p = 0.145).
80dB stimulus condition and Noise
There were no significant time × group interactions (80 dB: F (1,30) = 0.070, p = 0.793; Noise: F (1,30) = 0.185, p = 0.670), or time × region × group (80 dB: F (1,30) = 1.019, p = 0.321); Noise: F (1,30) = 0.426, p = 0.519), nor time × amplification × group (80 dB: F (1,30) = 0.288, p = 0.595); Noise: F (1,30) = 0.451, p = 0.507). No main effects of time, region, amplification or group were observed (p > 0.103).
Taken together, these results suggest that the use of hearing aids decreases F0 amplitude over time for conversational level stimuli (65 dB SPL), as shown in the Fast Fourier transform (FFT) analysis in Figure 6.
Phase Locking Factor
Pre- and post-test measures were compared across both groups using a RM ANOVA with group (control vs. experimental) as the between-subject factor, time (pre-test vs. post-test), amplification (aided vs. unaided) and region (transition, steady state) as within-subject factors for each stimulus condition (65 dB, 80 dB, Noise).
No change was observed in either group. There were no significant time × group interactions for any stimulus condition (all p values ≥ 0.108), in addition, there were no main effects of time, amplification, region or group (p > 0.163).
3.3. Correlations among behavioral and FFR measures
Relationships between the FFR physiological responses in quiet and the benefits of hearing aids were studied in the experimental group. The benefit from the hearing aids was reflected from APHAB scores. Post-aided minus pre-unaided score differences were calculated to reflect the amount of improvement for the experimental group only. As seen in the results section (3.1.3.), larger positive differences reflect more improvements in EC, RV and BN subscales, larger negative differences reflect more improvement in VA subscale. Regarding the physiological measures, we focused on physiological measures that showed time × group interactions (F0 amplitude for the 65 dB stimulus and peak latencies for the 65 dB and 80 dB stimuli) in the transition region. We also included PLF for the 65 dB transition, because we suspected that the lack of group × time interaction was due to large variability in the data. All physiological outcomes were in the aided conditions to minimize the number of variables in the Pearson correlation. The false discovery rate (FDR) procedure (Benjamini and Hochberg, 1995) was applied to control for multiple comparisons and will be applied below.
Here and in Figure 7 we report significant correlations, but the results for all the measures can be found in Table S4.
Figure 7.
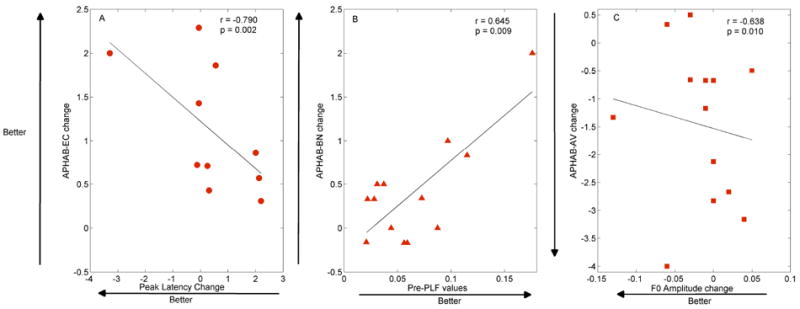
Behavioral\Physiological Correlation across APHAB subscales (EC: Ease of communication; BN: Background Noise; AV: Aversiveness). A: Decreases in peak latency for the 80 dB stimulus were correlated with increases in EC benefit change. B: Higher PLF values at pre-test related to greater improvement in BN. C: Decreases in F0 amplitude correlated with greater AV benefit.
APHAB – BN: Higher PLF values at pre-test related to greater improvement in BN (r = 0.645, p = 0.009) as shown in Figure 7. Larger PLF values at the pre-test highly predicts better benefit of the hearing aid use in listening in background noise.
APHAB –AV: Decreases in F0 amplitude correlated with greater AV benefit (r = -0.638, p = 0.010), such that sounds were less aversive when F0 amplitude was lower, as shown in Figure 7.
APHAB –EC: Decreases in peak latency for the 80 dB stimulus were correlated with increases in EC benefit change (r = -0.790, p = 0.002). The ease of communication due to the use of HAs was highly reflected by decreased peak latencies, as shown in Figure 7.
APHAB –RV: No significant correlations were observed among the physiological responses and Reverberation subscale.
Although high Pearson coefficient values were observed, the p values did not survive the FDR procedure due to the large number of correlations.
4. Discussion
The present study tested the benefits of the use of hearing aids over the course of six months and their effects on behavioral and physiological outcomes. The outcomes on speech perception and physiological aspects of speech processing were compared between hearing aid users and non-users.
The major outcomes of the current study showed that: (1) Satisfaction with hearing aids increases over the course of six months. Subjective APHAB self-assessment questionnaire suggests improved communication with hearing aid use. (2) Hearing aid-induced physiological changes were observed; (2.a) hearing aid use offsets delayed temporal processing over the course of six months and (2.b) minimizes the imbalance in the neurophysiological processing of speech cues associated with hearing loss in older adults. (3) Significant correlations were observed between pre-test physiologic responses and pre-to-post-test changes of the physiologic responses, and the improvement on perceptual measures and subjective benefits of hearing aids. Together these findings suggest that hearing aids may alter subcortical processing over the course of six months.
4.1 Behavioral findings and subjective benefits
4.1.1 Speech in noise perception
Significant improvements in the QuickSIN aided performance (Figure 3) might suggest that hearing aid use leads to improved speech-in-noise performance over the course of six months; however, we should note that the improvement in performance was fairly equivalent between groups in the unaided condition, and between the unaided and aided conditions in the hearing aid group. Therefore, the change in QuickSIN scores may reflect a practice effect rather than actual improvement in performance. These results are similar to those of Dawes et al. (2014a) who found a similar practice effect for aided or unaided speech recognition performance over time. Humes and Wilson (2003) found little evidence of improvement in aided performance in older listeners over an interval of time that spanned three years. However, Reber and Kompis (2005) showed that aided speech understanding in noise increased significantly after a six-month course of hearing aid use. Reber and Kompis used a German test (“Basler” sentence test in noise), which may be more sensitive to changes in speech perception than the QuickSIN. We chose to measure performance using the QuickSIN because it is the most commonly used clinical test, but it may be beneficial to use a test that is more sensitive to small differences in performance in future studies.
4.1.2. Subjective self-assessments
Benefits of the use of hearing aids were seen with both the APHAB and SSQ questionnaires. APHAB was used for measuring the outcomes of hearing aid fitting and tracking the success over time (Cox and Alexander, 1995); therefore, only the experimental group was used in the analysis. The participants reported pre (unaided)-to-post (aided) changes in the frequency of the problems experienced in communication and noise in several everyday listening situations using APHAB four subscales (Cox and Alexander, 1995). The results showed positive improvements for the EC, RV, and BN subscales which might suggest that hearing aid use improves speech communication, or alternatively, that the hearing aid wearers improved at using their devices over. However, the negative drop in AV seen in Figure 4 describes negative reactions to environmental sounds; i.e. aversiveness of amplified sound was more frequently reported after the use of hearing aids. Most individuals reported low sound aversiveness in unaided conditions. Similar to previous suggestions, the present study also shows that amplified loud sounds continue to be uncomfortable for many hearing impaired individuals who use hearing aids (e.g., Kochkin, 2005, Johnson et al., 2010).
In addition, the present study used the SSQ to measure aspects related to hearing speech sounds and to investigate features of spatial and quality of hearing. The SSQ is used to assess the benefits of different strategies for auditory rehabilitation (Singh and Pichora-Fuller, 2010, Banh et al., 2012). The SSQ results showed a significant difference in pre to post responses of the experimental group in the speech subscale (Table S1). Higher scores suggest better perception abilities during communication and daily listening environments; however, the effect size was not robust and did not survive correction for multiple comparisons. Subjective improvement in perception with hearing aids was previously noted on the SSQ - Difference version (SSQ-D; Dawes et al., 2014a). The SSQ-D is based on the SSQ (Gatehouse and Noble, 2004), and adjusted by Stuart Gatehouse (W. Noble, personal communication 2009) but represents subjective change in performance. When we administered the SSQ, we asked participants to rate their hearing performance before and after wearing hearing aids (in the case of the experimental group), and perhaps we may have seen greater benefit on the SSQ if we had asked the participants to quantify their perceived change in hearing ability.
As suggested by Johnson et al. (2010, page 53) important considerations in subjective outcomes can be measured in several domains, including daily use of amplification, aided performance, benefit, satisfaction, improved participation, impact on others, and quality of life. In the current study, subjective benefits might be also assessed by compliance, and it is important to note that compliance with wearing the hearing aids was very high. After completion of the study, 86% of the participants kept their hearing aids, and only three participants of their experimental group decided not to continue wearing hearing aids, primarily due to dissatisfaction with the performance in noise. Satisfaction is a complex variable (Kochkin, 1992), and it is often not explicitly addressed in hearing rehabilitation programs (Cox and Alexander, 1995). Given the fact that these participants were self-referred and participated in the study from flyer announcements and advertisements and were not typical clinically-oriented patients seeking hearing aids, their motivation to keep the hearing aids was somewhat surprising. Therefore, although no robust effects were noted on the self-assessment scales, on the whole most participants clearly experienced sufficient benefit to continue hearing aid use.
4.2. Physiological changes and correlations to behavior
In consistence with the research evidence of diminished temporal processing in older adults from psychophysical studies and cortical auditory potential studies (Burkard and Sims, 2001, Tremblay et al., 2004, Caspary et al., 2005, Vander Werff and Burns, 2011, Konrad-Martin et al., 2012, Parbery-Clark et al., 2012) and those with hearing loss (Oates et al., 2002, Tremblay et al., 2003, Bertoli et al., 2005), we expected that the use of amplification over time would induce plastic changes in amplitude and timing. Our findings supported this hypothesis, in part.
Timing/Latency
Significant pre-to-post differences in peak latencies between groups for the quiet listening conditions (65 dB and 80 dB) were observed. In particular, the control group showed delayed latencies in the post-test session. No change was observed in the experimental group after six months. One might expect latencies to decrease due to the use of hearing aids, but in the present study the latencies did not change in the experimental group after six months. This could suggest that hearing aid use offsets delays in latency. The prolonged latencies seen in the control group responses may reflect the neural slowing that has been documented in the auditory cortex (Iragui et al., 1993, Tremblay et al., 2004, Matilainen et al., 2010) and brainstem (Anderson et al., 2012, Clinard and Tremblay, 2013) of older brains. Temporal jitter or the loss of neural synchrony that accompanies aging or hearing loss may lead to delayed latencies (Anderson et al., 2013b, Mamo et al., 2016). Temporal jitter contributes to impairments in auditory processing (Pichora-Fuller et al., 1992) and to speech recognition difficulties in older adults (Pichora-Fuller et al., 2007). Impaired perception results from age-related factors that affect temporal processing and neural synchrony (Schneider and Pichora-Fuller, 2001). Therefore, prolonged latencies shown in the present study might reflect loss of synchrony resulting from hearing loss (i.e., auditory systems of hearing impaired older adults might be less able to synchronize to the initial consonant burst, resulting in smaller neural responses). Given that neural timing is suggested to reflect temporal jitter and synchronicity, these non-delayed latencies seen in the experimental group after hearing aid use could be interpreted as an increase in synchronicity and may be affected by an inhibition-mediated decrease in temporal jitter. Reduced input from the periphery due to hearing loss, changes neural responses in the inferior colliculus (Cowper-Smith et al., 2010). Reduced afferent neural transmission may be sufficient to desynchronize neural activity in the inferior colliculus and these reductions may destabilize the tight regulation of excitatory/inhibitory neurotransmission needed for temporal processing. Therefore, in the control group, the reduced afferent transmission may lead to further loss of synchrony over the course of six months. Hearing aid use lead to increase in the audibility of the signal and this may have mediated an increase in the synchrony needed for precise temporal representation of the incoming sound.
Another interpretation for the delayed latencies in the controls is that further deafferentiation occurred as a result of continued sensory deprivation associated with the hearing loss. It was suggested by Lopez-Poveda (in 2014, page 5) that “a reduction in either the probability of firing of individual nerve fibers or in the number of auditory nerve fibers would degrade the quality of the neural representation of the sound waveforms.” Given that the control group had mild to moderate hearing loss (and severe in the high frequencies) plus no sensory amplification during six months, it is likely that the possibility of firing of individual nerve fibers was reduced, leading to a degradation in the encoding of speech by stochastic undersampling (in Lopez-Poveda, 2014, page 4). Stochastic undersampling may also occur by deafferentation – a reduction in the number of available nerve fibers. Neural stochastic undersampling would thus yield a noisy representation of the speech signal and impair speech intelligibility (Lopez-Poveda, 2014), possibly leading to delayed latencies in our control group.
To summarize, two mechanisms may contribute to the interpretation of the above reported results: Stochastic undersampling (Lopez-Poveda and Barrios, 2013) and reduced synchronization of specific auditory nerve fiber discharges (Pichora-Fuller et al., 2007, Henry and Heinz, 2012). Both stochastic undersampling of a noisy speech waveform, as might occur after cochlear synaptopathy or deafferentation (Lopez-Poveda and Barrios, 2013), and temporal jitter of speech components (Pichora-Fuller et al., 2007, Mamo et al., 2016) decrease the perception of speech in noise (Johannesen et al., 2016). The current study shows that hearing aid use and amplification of previously inaudible sounds can affect neural processing and possibly speech intelligibility in older adults.
The correlations between changes in latency and ease of communication (APHAB) illustrate this point. Results showed a high correlation between the changes in peak latency in 80 dB stimulus condition and changes in APHAB EC subscale after the use of hearing aids. The negative correlation shown in Figure 7 (r = -0.790, p = 0.002, although the p value did not survive the FDR procedure due to the large number of correlations) indicates that some participants of the experimental group showed decreased latencies after the use of hearing aids, and these were reflected by increased ease of communication abilities with hearing aids (as assessed by (APHAB). This may show that hearing aid-induced changes were facilitated by better synchrony to allow for precise encoding and detection of syllables in the experimental group. Hearing aids may restore the audibility of sounds resulting in increased synchrony and ultimately to better speech perception.
Amplitude of the fundamental frequency
The experimental group showed reduced amplitudes of the fundamental frequency after six months, while the control group did not show any changes. Anderson et al. (2013a) demonstrated exaggerated F0 amplitudes in hearing impaired listeners compared to age-matched normal-hearing counterparts. F0 is an important speech cue of listening, that helps in the identification of speaker and auditory object formation (Oxenham, 2008, Shinn-Cunningham and Best, 2008). Vongpaisal and Pichora-Fuller (2007) suggested that deficits in temporal synchrony may account for the poor F0 encoding, which leads to vowel segregation difficulty and diminished periodicity encoding in older listeners, these contribute to the difficulties in speech perception in noise (Anderson et al., 2011). These findings may be consistent with a change in the balance of inhibitory and excitatory transmission with aging that leads to greater excitability in response to suprathreshold stimulation (reviewed in Caspary et al., 2008). Enhanced subcortical encoding of the fundamental frequency could be the result of greater broadband activity. Presacco et al. (2016, page 2346) also showed an exaggerated cortical representation of speech in quiet and noise conditions in older adults’ cortical response morphology, suggesting a probable imbalance between inhibitory and excitatory processes, or diminished network connectivity that may impair their ability to encode speech efficiently. This exaggerated response might be a reflection of changes in the way that the acoustical stimuli are processed and as a consequence, in the level of attention required to process them. It is also possible that peripheral hearing loss contributes to problems in the speech encoding process, as several studies have shown that this cortical neural enhancement is exacerbated by hearing loss (Tremblay et al., 2003, Alain et al., 2014).
The finding in the present study showing decreased F0 amplitudes after the use of hearing aids might show that this imbalance and these exaggerated excitatory responses discussed above are “normalizing” due to the use of amplification. In other words, hearing aids seem to positively affect this imbalance. So if it is assumed that a decrease of inhibition leads to larger neural currents and subsequently larger amplitudes (Vale and Sanes, 2002) (as shown in the control group, and before hearing aid use), then we can suggest that hearing aid use could lead to amplitude decrease and subsequent increases in inhibition and a greater balance between excitatory and inhibitory mechanisms.
In addition, the changes in F0 related to the aversiveness to sounds (r = -0.638, p = 0.010). Although the p value did not survive the FDR procedure due to the large number of correlations, this correlation might reflect that aversiveness of amplified sounds was lower in the individuals who showed greater decreases in F0 amplitudes after the use of hearing aids.
Phase locking
Previous research reported that older adults show poor phase locking values (Anderson et al., 2012, Ruggles et al., 2012). We hypothesized that larger PLF values would be obtained due to hearing aid use, expecting that increases in phase locking would suggest improved midbrain processing due to increased audibility of the signal. However, no changes in PLF values were observed. Although no physiological effects of hearing aids were found in phase locking, the PLF pre- measures may predict the amount of perceptual improvements (Table S4). The relationship between the physiological pre-PLF values and the benefit in hearing in background noise was highly correlated (r = 0.645, p = 0.009; p value did not survive the FDR procedure). This correlation, shown in Figure 7, reflects that better phase locking at the pre-test predicts larger improvements in communication in background noise, suggesting that more precise phase locking to the stimulus leads to enhanced ability to benefit from hearing aid amplification.
4.3. Conclusion
Physiological differences were observed between hearing aid users and non-users with age-related hearing loss. Hearing impaired individuals that did not use hearing aids showed reduced temporal processing abilities, physiological deficits in the encoding of sounds and decreased neural synchrony. These physiological effects may contribute to listening difficulties especially in non-optimal listening environments. Hearing aid use may offset those neural deficits after the use of hearing aids for a period of six months. Some perceptual improvements and subjective benefits were observed after the use of hearing aids and there were further reflected by physiological correlations as well. What remains unknown are the specific aspects of hearing aid use that are responsible for perceptual gains, how coincident changes in neural activity relate to the auditory cues being induced by hearing aid use, and if those will be retained for a longer period of time.
4.4. Future Directions
The authors are studying cortical-induced changes and cognitive benefits of hearing aid use. The combination of amplification of the deteriorated sensory input and auditory training to enhance cognitive and perceptual abilities are important for rehabilitation. Hearing aids might restore the acoustic energy that was previously not transmitted to the central auditory system, by applying auditory amplification. The combination of amplification and auditory training may lead to improved speech clarity in noise. Further research should be conducted with the addition of an age-related hearing loss group that uses hearing aids and auditory training, to disentangle the plastic changes in the central auditory system that are induced by hearing aid use and by structured training and to determine the relative roles of sensory and higher-level conceptual processes in training induced plasticity by cortical and subcortical measures.
4.5. Limitations
Although we performed a power analysis to determine our sample size, a large number of participants may have facilitated better matching on the test variables. The control group was a no-contact group and testing was performed only twice, while the experimental group was seen additional times throughout the study. There is potential for experimenter bias in this study; although the tests were performed by more than one lab member, the experimental group participants may have become accustomed to the lab environment and were more relaxed and dedicated in sessions. Therefore, in future studies an active control group with a placebo type of sensory management should be used in order to account for placebo effects.
Supplementary Material
Highlights.
Hearing aid use may offset delays in neural timing associated with hearing loss.
Hearing aid use may reduce over representation of the temporal envelope.
Satisfaction with hearing aids increases over the course of six months.
Acknowledgments
The authors thank the participants who participated in this study. The authors would like to thank Alessandro Presacco, Calli Fodor, Lindsey Roque and other lab members for their help with data collection and analysis. The authors also thank Francis Kuk, VP Clinical Research, Widex, for feedback and assistance with the project, and Widex USA for providing hearing aids and participant funds. The authors would also like to thank the Planning and Budgeting Committee for Higher Education in Israel for the postdoctoral fellowship awarded to H.K. The Hearing and Health Foundation and The National Institute on Deafness and other Communication Disorders (R21DC015843a, awarded to S.A.) also contributed to postodoctoral fellowship support for H.K.
Footnotes
Conflict of interest
None of the authors have potential conflicts of interest to be disclosed.
Publisher's Disclaimer: This is a PDF file of an unedited manuscript that has been accepted for publication. As a service to our customers we are providing this early version of the manuscript. The manuscript will undergo copyediting, typesetting, and review of the resulting proof before it is published in its final citable form. Please note that during the production process errors may be discovered which could affect the content, and all legal disclaimers that apply to the journal pertain.
References
- Aiken SJ, Picton TW. Envelope and spectral frequency-following responses to vowel sounds. Hear Res. 2008;245:35–47. doi: 10.1016/j.heares.2008.08.004. [DOI] [PubMed] [Google Scholar]
- Alain C, Roye A, Salloum C. Effects of age-related hearing loss and background noise on neuromagnetic activity from auditory cortex. Front Syst Neurosci. 2014;8:8. doi: 10.3389/fnsys.2014.00008. [DOI] [PMC free article] [PubMed] [Google Scholar]
- Anderson S, Kraus N. The potential role of the cABR in assessment and management of hearing impairment. Int J Otolaryngol. 2013;2013 doi: 10.1155/2013/604729. 604729. [DOI] [PMC free article] [PubMed] [Google Scholar]
- Anderson S, Parbery-Clark A, White-Schwoch T, Drehobl S, Kraus N. Effects of hearing loss on the subcortical representation of speech cues. J Acoust Soc Am. 2013a;133:3030–8. doi: 10.1121/1.4799804. [DOI] [PMC free article] [PubMed] [Google Scholar]
- Anderson S, Parbery-Clark A, White-Schwoch T, Kraus N. Aging affects neural precision of speech encoding. J Neurosci. 2012;32:14156–64. doi: 10.1523/JNEUROSCI.2176-12.2012. [DOI] [PMC free article] [PubMed] [Google Scholar]
- Anderson S, Parbery-Clark A, White-Schwoch T, Kraus N. Auditory brainstem response to complex sounds predicts self-reported speech-in-noise performance. J Speech Lang Hear Res. 2013b;56:31–43. doi: 10.1044/1092-4388(2012/12-0043). [DOI] [PMC free article] [PubMed] [Google Scholar]
- Anderson S, Parbery-Clark A, Yi H, Kraus N. A neural basis of speech-in-noise perception in older adults. Ear Hear. 2011;32:750–7. doi: 10.1097/AUD.0b013e31822229d3. [DOI] [PMC free article] [PubMed] [Google Scholar]
- Anderson S, White-Schwoch T, Choi HJ, Kraus N. Training changes processing of speech cues in older adults with hearing loss. Front Syst Neurosci. 2013c;7:97. doi: 10.3389/fnsys.2013.00097. [DOI] [PMC free article] [PubMed] [Google Scholar]
- Anderson S, White-Schwoch T, Parbery-Clark A, Kraus N. Reversal of age-related neural timing delays with training. PNAS. 2013d;110:4149–50. doi: 10.1073/pnas.1213555110. [DOI] [PMC free article] [PubMed] [Google Scholar]
- Arlinger S, Gatehouse S, Bentler RA, Byrne D, Cox RM, Dirks DD, et al. Report of the Eriksholm Workshop on Auditory Deprivation and Acclimatization. Ear Hear. 1996;17:S87–S90. doi: 10.1097/00003446-199617031-00009. [DOI] [PubMed] [Google Scholar]
- Banh J, Singh G, Pichora-Fuller MK. Age affects responses on the Speech, Spatial, and Qualities of Hearing Scale (SSQ) for adults with minimal audiometric loss. J Am Acad Audiol. 2012;23:81–91. doi: 10.3766/jaaa.23.2.2. [DOI] [PubMed] [Google Scholar]
- Bender RA, Niebuhr DP, Getta JP, Anderson CV. Longitudinal Study of Hearing Aid Effectiveness. IObjective Measures. J Speech Lang Hear Res. 1993;36:808–19. doi: 10.1044/jshr.3604.808. [DOI] [PubMed] [Google Scholar]
- Benjamini Y, Hochberg Y. Controlling the false discovery rate: a practical and powerful approach to multiple testing. J R Stat Soc Series B Stat Methodol. 1995;57:289–300. [Google Scholar]
- Bentler RA, Duve MR. Comparison of hearing aids over the 20th century. Ear Hear. 2000;21:625–39. doi: 10.1097/00003446-200012000-00009. [DOI] [PubMed] [Google Scholar]
- Bertoli S, Smurzynski J, Probst R. Effects of age, age-related hearing loss, and contralateral cafeteria noise on the discrimination of small frequency changes: psychoacoustic and electrophysiological measures. J Assoc Res Otolaryngol. 2005;6:207–22. doi: 10.1007/s10162-005-5029-6. [DOI] [PMC free article] [PubMed] [Google Scholar]
- Bidelman GM, Krishnan A. Effects of reverberation on brainstem representation of speech in musicians and non-musicians. Brain Res. 2010;1355:112–25. doi: 10.1016/j.brainres.2010.07.100. [DOI] [PMC free article] [PubMed] [Google Scholar]
- Billings CJ, Bennett KO, Molis MR, L MR. Cortical encoding of signals in noise: Effects of stimulus type and recording paradigm. Ear Hear. 2011;32:53–60. doi: 10.1097/AUD.0b013e3181ec5c46. [DOI] [PMC free article] [PubMed] [Google Scholar]
- Billings CJ, Tremblay KL, Souza PE, Binns MA. Effects of hearing aid amplification and stimulus intensity on cortical auditory evoked potentials. Audiol Neurotol. 2007;12:234–46. doi: 10.1159/000101331. [DOI] [PubMed] [Google Scholar]
- Boersma P, Weenink D. Praat: doing phonetics by computer (Version 5.1. 05)[Computer program] 2009 Retrieved May 1, 2009, from http://www.praat.org/
- Burkard RF, Sims D. The Human Auditory Brainstem Response to High Click RatesAging Effects. Am J Audiol. 2001;10:53–61. doi: 10.1044/1059-0889(2001/008). [DOI] [PubMed] [Google Scholar]
- Campbell T, Kerlin JR, Bishop CW, Miller LM. Methods to eliminate stimulus transduction artifact from insert earphones during electroencephalography. Ear Hear. 2012;33:144. doi: 10.1097/AUD.0b013e3182280353. [DOI] [PMC free article] [PubMed] [Google Scholar]
- Caspary DM, Ling L, Turner JG, Hughes LF. Inhibitory neurotransmission, plasticity and aging in the mammalian central auditory system. J Exp Biol. 2008;211:1781–91. doi: 10.1242/jeb.013581. [DOI] [PMC free article] [PubMed] [Google Scholar]
- Caspary DM, Schatteman TA, Hughes LF. Age-related changes in the inhibitory response properties of dorsal cochlear nucleus output neurons: role of inhibitory inputs. J Neurosci. 2005;25:10952–9. doi: 10.1523/JNEUROSCI.2451-05.2005. [DOI] [PMC free article] [PubMed] [Google Scholar]
- Chisolm TH, Johnson CE, Danhauer JL, Portz LJ, Abrams HB, Lesner S, et al. A systematic review of health-related quality of life and hearing aids: final report of the American Academy of Audiology Task Force on the Health-Related Quality of Life Benefits of Amplification in Adults. J Am Acad Audiol. 2007;18:151–83. doi: 10.3766/jaaa.18.2.7. [DOI] [PubMed] [Google Scholar]
- Clinard CG, Tremblay KL. Aging degrades the neural encoding of simple and complex sounds in the human brainstem. J Am Acad Audiol. 2013;24:590–9. doi: 10.3766/jaaa.24.7.7. [DOI] [PubMed] [Google Scholar]
- Cowper-Smith C, Dingle R, Guo Y, Burkard R, Phillips D. Synchronous auditory nerve activity in the carboplatin-chinchilla model of auditory neuropathy. J Acoust Soc Am. 2010;128:EL56–EL62. doi: 10.1121/1.3453764. [DOI] [PMC free article] [PubMed] [Google Scholar]
- Cox RM, Alexander GC. The abbreviated profile of hearing aid benefit. Ear Hear. 1995;16:176–86. doi: 10.1097/00003446-199504000-00005. [DOI] [PubMed] [Google Scholar]
- Cramer A. Ich höre die Worte, aber ich verstehe sie nicht. HNO. 2012;60:532–9. doi: 10.1007/s00106-011-2399-4. [DOI] [PubMed] [Google Scholar]
- Davis A, Haggard M. Some implications of audiological measures in the population for binaural aiding strategies. Scand Audiol Supp. 1981;15:167–79. [PubMed] [Google Scholar]
- Davis A, McMahon CM, Pichora-Fuller KM, Russ S, Lin F, Olusanya BO, et al. Aging and hearing health: the life-course approach. Gerontologist. 2016;56:S256–S67. doi: 10.1093/geront/gnw033. [DOI] [PMC free article] [PubMed] [Google Scholar]
- Dawes P, Munro KJ, Kalluri S, Edwards B. Acclimatization to hearing aids. Ear Hear. 2014a;35:203–12. doi: 10.1097/AUD.0b013e3182a8eda4. [DOI] [PubMed] [Google Scholar]
- Dawes P, Munro KJ, Kalluri S, Edwards B. Auditory acclimatization and hearing aids: Late auditory evoked potentials and speech recognition following unilateral and bilateral amplification. J Acoust Soc Am. 2014b;135:3560–9. doi: 10.1121/1.4874629. [DOI] [PubMed] [Google Scholar]
- Dinse H, Krüger K, Akhavan A, Spengler F, Schöner G, Schreiner C. Low-frequency oscillations of visual, auditory and somatosensory cortical neurons evoked by sensory stimulation. Int J Psychophysiol. 1997;26:205–27. doi: 10.1016/s0167-8760(97)00765-4. [DOI] [PubMed] [Google Scholar]
- Easwar V, Purcell DW, Aiken SJ, Parsa V, Scollie SD. Evaluation of speech-evoked envelope following responses as an objective aided outcome measure: Effect of stimulus level, bandwidth, and amplification in adults with hearing loss. Ear Hear. 2015;36:635–52. doi: 10.1097/AUD.0000000000000199. [DOI] [PubMed] [Google Scholar]
- Ferguson MA, Henshaw H, Clark DPA, Moore DR. Benefits of Phoneme Discrimination Training in a Randomized Controlled Trial of 50- to 74-Year-Olds With Mild Hearing Loss. Ear Hear. 2014;35:e110–e21. doi: 10.1097/AUD.0000000000000020. [DOI] [PMC free article] [PubMed] [Google Scholar]
- Fitzgibbons PJ, Gordon-Salant S. Behavioral studies with aging humans: Hearing sensitivity and psychoacoustics. In: Gordon-Salant S, Frisina RD, Popper AN, Fay RR, editors. The aging auditory system. New York: Springer; 2010. pp. 111–34. [Google Scholar]
- Fujikawa S, Owens E. Hearing aid evaluation for persons with postlingual hearing levels of 90 to 100 dB. Arch of Otolaryngol. 1979;105:662–5. doi: 10.1001/archotol.1979.00790230032007. [DOI] [PubMed] [Google Scholar]
- Gatehouse S. The time course and magnitude of perceptual acclimatization to frequency responses: Evidence from monaural fitting of hearing aids. J Acoust Soc Am. 1992;92:1258–68. doi: 10.1121/1.403921. [DOI] [PubMed] [Google Scholar]
- Gatehouse S. Role of perceptual acclimatization in the selection of frequency responses for hearing aids. J Am Acad Audiol. 1993;4:296–306. [PubMed] [Google Scholar]
- Gatehouse S, Noble W. The speech, spatial and qualities of hearing scale (SSQ) Int J Audiol. 2004;43:85–99. doi: 10.1080/14992020400050014. [DOI] [PMC free article] [PubMed] [Google Scholar]
- Gordon-Salant S. Hearing loss and aging: new research findings and clinical implications. J Rehabil Res Dev. 2005;42:9–24. doi: 10.1682/jrrd.2005.01.0006. [DOI] [PubMed] [Google Scholar]
- Gorga M, Abbas P, Worthington D. Stimulus calibration in ABR measurements. In: Jacobson J, editor. The auditory brainstem response. San Diego: College-Hill; 1985. [Google Scholar]
- Henry KS, Heinz MG. Diminished temporal coding with sensorineural hearing loss emerges in background noise. Nat Neurosci. 2012;15:1362–4. doi: 10.1038/nn.3216. [DOI] [PMC free article] [PubMed] [Google Scholar]
- Holube I, Fredelake S, Vlaming M, Kollmeier B. Development and analysis of an international speech test signal (ISTS) Int J Audiol. 2010;49:891–903. doi: 10.3109/14992027.2010.506889. [DOI] [PubMed] [Google Scholar]
- Humes LE. Understanding the speech-understanding problems of the hearing impaired. J Am Acad Audiol. 1991;2:59–69. [PubMed] [Google Scholar]
- Humes LE, Wilson DL. An examination of changes in hearing-aid performance and benefit in the elderly over a 3-year period of hearing-aid use. J Speech Lang Hear Res. 2003;46:137–45. doi: 10.1044/1092-4388(2003/011). [DOI] [PubMed] [Google Scholar]
- Iragui VJ, Kutas M, Mitchiner MR, Hillyard SA. Effects of aging on event-related brain potentials and reaction times in an auditory oddball task. Psychophysiology. 1993;30:10–22. doi: 10.1111/j.1469-8986.1993.tb03200.x. [DOI] [PubMed] [Google Scholar]
- Irvine DRF, Rajan R, Brown M. Injury- and use-related plasticity in adult auditory cortex. Audiol Neuro-Otol. 2001;6:192–5. doi: 10.1159/000046831. [DOI] [PubMed] [Google Scholar]
- Jenkins K, Fodor C, Presacco A, Anderson S. Effects of Amplification on Neural Phase Locking, Amplitude, and Latency to a Speech Syllable. Ear Hear. 2017 doi: 10.1097/AUD.0000000000000538. [DOI] [PMC free article] [PubMed] [Google Scholar]
- Jerger J, Chmiel R, Florin E, Pirozzolo F, Wilson N. Comparison of conventional amplification and an assistive listening device in elderly persons. Ear Hear. 1996;17:490–504. doi: 10.1097/00003446-199612000-00005. [DOI] [PubMed] [Google Scholar]
- Johannesen PT, Pérez-González P, Kalluri S, Blanco JL, Lopez-Poveda EA. The influence of cochlear mechanical dysfunction, temporal processing deficits, and age on the intelligibility of audible speech in noise for hearing-impaired listeners. Trends Hear. 2016;20 doi: 10.1177/2331216516641055. [DOI] [PMC free article] [PubMed] [Google Scholar]
- Johnson JA, Cox RM, Alexander GC. Development of APHAB norms for WDRC hearing aids and comparisons with original norms. Ear Hear. 2010;31:47–55. doi: 10.1097/AUD.0b013e3181b8397c. [DOI] [PubMed] [Google Scholar]
- Karawani H, Bitan T, Attias J, Banai K. Auditory perceptual learning in adults with and without age-related hearing loss. Front Psychol. 2016;6:2066. doi: 10.3389/fpsyg.2015.02066. [DOI] [PMC free article] [PubMed] [Google Scholar]
- Killion MC, Niquette PA, Gudmundsen GI, Revit LJ, Banerjee S. Development of a quick speech-in-noise test for measuring signal-to-noise ratio loss in normal-hearing and hearing-impaired listeners. J Acoust Soc Am. 2004;116:2395–405. doi: 10.1121/1.1784440. [DOI] [PubMed] [Google Scholar]
- Kochkin S. MarkeTrak III identifies key factors in determining consumer satisfaction. Hear J. 1992;45:39–44. [Google Scholar]
- Kochkin S. Marke Trak V: “Why my hearing aids are in the drawer”: The consumers’ perspective. Hear J. 2000;53:34. [Google Scholar]
- Kochkin S. MarkeTrak VII: Customer satisfaction with hearing instruments in the digital age. Hear J. 2005;58:30–2. [Google Scholar]
- Konrad-Martin D, Dille MF, McMillan G, Griest S, McDermott D, Fausti SA, et al. Age-related changes in the auditory brainstem response. J Am Acad Audiol. 2012;23:18–35. doi: 10.3766/jaaa.23.1.3. [DOI] [PMC free article] [PubMed] [Google Scholar]
- Korczak PA, Kurtzberg D, Stapells DR. Effects of sensorineural hearing loss and personal hearing aids on cortical event-related potential and behavioral measures of speech-sound processing. Ear Hear. 2005;26:165–85. doi: 10.1097/00003446-200504000-00005. [DOI] [PubMed] [Google Scholar]
- Lavie L, Attias J, Karni A. Semi-Structured Listening Experience (Listening Training) in Hearing Aid Fitting: Influence on Dichotic Listening. Am J Audiol. 2013;22:347–50. doi: 10.1044/1059-0889(2013/12-0083). [DOI] [PubMed] [Google Scholar]
- Lavie L, Banai K, Attias J, Karni A. Better together: reduced compliance after sequential versus simultaneous bilateral hearing aids fitting. Am J Audiol. 2014;23:93–8. doi: 10.1044/1059-0889(2013/13-0010). [DOI] [PubMed] [Google Scholar]
- Lavie L, Banai K, Karni A, Attias J. Hearing Aid Induced Plasticity in the Auditory System of the Elderly: Evidence from Speech Perception. J Speech Hear Res. 2015;58:1601–10. doi: 10.1044/2015_JSLHR-H-14-0225. [DOI] [PubMed] [Google Scholar]
- Lopez-Poveda EA. Why do I hear but not understand? Stochastic undersampling as a model of degraded neural encoding of speech. Front Neurosci. 2014;8:348. doi: 10.3389/fnins.2014.00348. [DOI] [PMC free article] [PubMed] [Google Scholar]
- Lopez-Poveda EA, Barrios P. Perception of stochastically undersampled sound waveforms: a model of auditory deafferentation. Front Neurosci. 2013;7:124. doi: 10.3389/fnins.2013.00124. [DOI] [PMC free article] [PubMed] [Google Scholar]
- Mamo SK, Grose JH, Buss E. Speech-evoked ABR: effects of age and simulated neural temporal jitter. Hear Res. 2016;333:201–9. doi: 10.1016/j.heares.2015.09.005. [DOI] [PMC free article] [PubMed] [Google Scholar]
- Matilainen LE, Talvitie SS, Pekkonen E, Alku P, May PJ, Tiitinen H. The effects of healthy aging on auditory processing in humans as indexed by transient brain responses. Clin Neurophysiol. 2010;121:902–11. doi: 10.1016/j.clinph.2010.01.007. [DOI] [PubMed] [Google Scholar]
- Mendel LL. Objective and subjective hearing aid assessment outcomes. Am J Audiol. 2007;16:118–29. doi: 10.1044/1059-0889(2007/016). [DOI] [PubMed] [Google Scholar]
- Morita T, Naito Y, Nagamine T, Fujiki N, Shibasaki H, Ito J. Enhanced activation of the auditory cortex in patients with inner-ear hearing impairment: a magnetoencephalographic study. Clin Neurophysiol. 2003;114:851–9. doi: 10.1016/s1388-2457(03)00033-6. [DOI] [PubMed] [Google Scholar]
- Munro KJ. Reorganization of the adult auditory system: perceptual and physiological evidence from monaural fitting of hearing aids. Trends Amplif. 2008;12:254–71. doi: 10.1177/1084713808323483. [DOI] [PMC free article] [PubMed] [Google Scholar]
- Munro KJ, Lutman ME. The effect of speech presentation level on measurement of auditory acclimatization to amplified speech. J Acoust Soc Am. 2003;114:484–95. doi: 10.1121/1.1577556. [DOI] [PubMed] [Google Scholar]
- Nasreddine ZS, Phillips NA, Bédirian V, Charbonneau S, Whitehead V, Collin I, et al. The Montreal Cognitive Assessment, MoCA: A brief screening tool for mild cognitive impairment. J Am Geriatr Soc. 2005;53:695–9. doi: 10.1111/j.1532-5415.2005.53221.x. [DOI] [PubMed] [Google Scholar]
- Noble W, Gatehouse S. Interaural asymmetry of hearing loss, Speech, Spatial and Qualities of Hearing Scale (SSQ) disabilities, and handicap. Int J Audiol. 2004;43:100–14. doi: 10.1080/14992020400050015. [DOI] [PubMed] [Google Scholar]
- Noble W, Gatehouse S. Effects of bilateral versus unilateral hearing aid fitting on abilities measured by the Speech, Spatial, and Qualities of Hearing scale (SSQ) Efectos de la adaptación uni o bilateral de auxiliares auditivos en las habilidades medidas la escala de cualidades auditiva, espacial y del lenguaje (SSQ) Int J Audiol. 2006;45:172–81. doi: 10.1080/14992020500376933. [DOI] [PubMed] [Google Scholar]
- Noble W, Tyler R, Dunn C, Bhullar N. Unilateral and bilateral cochlear implants and the implant-plus-hearing-aid profile: Comparing self-assessed and measured abilities. Int J Audiol. 2008;47:505–14. doi: 10.1080/14992020802070770. [DOI] [PubMed] [Google Scholar]
- Oates PA, Kurtzberg D, Stapells DR. Effects of sensorineural hearing loss on cortical event-related potential and behavioral measures of speech-sound processing. Ear Hear. 2002;23:399–415. doi: 10.1097/00003446-200210000-00002. [DOI] [PubMed] [Google Scholar]
- Olson AD, Preminger JE, Shinn JB. The effect of LACE DVD training in new and experienced hearing aid users. J Am Acad Audiol. 2013;24:214–30. doi: 10.3766/jaaa.24.3.7. [DOI] [PubMed] [Google Scholar]
- Otto WC, McCandless GA. Aging and the auditory brain stem response. Int J Audiol. 1982;21:466–73. doi: 10.3109/00206098209072759. [DOI] [PubMed] [Google Scholar]
- Oxenham AJ. Pitch perception and auditory stream segregation: implications for hearing loss and cochlear implants. Trends Amplif. 2008;12:316–31. doi: 10.1177/1084713808325881. [DOI] [PMC free article] [PubMed] [Google Scholar]
- Parbery-Clark A, Anderson S, Hittner E, Kraus N. Musical experience offsets age-related delays in neural timing. Neurobiol Aging. 2012;33:e1–e4. doi: 10.1016/j.neurobiolaging.2011.12.015. [DOI] [PubMed] [Google Scholar]
- Parthasarathy A, Datta J, Torres JA, Hopkins C, Bartlett EL. Age-related changes in the relationship between auditory brainstem responses and envelope-following responses. J Assoc Res Otolaryngol. 2014;15:649–61. doi: 10.1007/s10162-014-0460-1. [DOI] [PMC free article] [PubMed] [Google Scholar]
- Pichora-Fuller MK. Audition and cognition: What audiologists need to know about listening. In: Palmer C, Seewald R, editors. Hearing Care for Adults. Stäfa, Switzerland: Phonak; 2007. pp. 71–85. [Google Scholar]
- Pichora-Fuller MK, Schneider BA, Daneman M. How young and old adults listen to and remember speech in noise. J Acoust Soc Am. 1995;97:593–608. doi: 10.1121/1.412282. [DOI] [PubMed] [Google Scholar]
- Pichora-Fuller MK, Schneider BA, Macdonald E, Pass HE, Brown S. Temporal jitter disrupts speech intelligibility: a simulation of auditory aging. Hear Res. 2007;114:21. doi: 10.1016/j.heares.2006.10.009. [DOI] [PubMed] [Google Scholar]
- Pichora-Fuller Kathleen M, Schneider BA. The effect of interaural delay of the masker on masking-level differences in young and old adults. J Acoust Soc Am. 1992;91:2129–35. doi: 10.1121/1.403673. [DOI] [PubMed] [Google Scholar]
- Plomp R. Auditory handicap of hearing impairment and the limited benefit of hearing aids. J Acoust Soc Am. 1978;63:533–49. doi: 10.1121/1.381753. [DOI] [PubMed] [Google Scholar]
- Presacco A, Jenkins K, Lieberman R, Anderson S. Effects of Aging on the Encoding of Dynamic and Static Components of Speech. Ear Hear. 2014;36:e352–63. doi: 10.1097/AUD.0000000000000193. [DOI] [PMC free article] [PubMed] [Google Scholar]
- Presacco A, Simon JZ, Anderson S. Evidence of degraded representation of speech in noise, in the aging midbrain and cortex. J Neurophysiol. 2016;116:2346–55. doi: 10.1152/jn.00372.2016. [DOI] [PMC free article] [PubMed] [Google Scholar]
- Rao A, Rishiq D, Yu L, Zhang Y, Abrams H. Neural Correlates of Selective Attention With Hearing Aid Use Followed by ReadMyQuips Auditory Training Program. Ear Hear. 2017;38:28–41. doi: 10.1097/AUD.0000000000000348. [DOI] [PubMed] [Google Scholar]
- Reber MB, Kompis M. Acclimatization in first-time hearing aid users using three different fitting protocols. Auris Nasus Larynx. 2005;32:345–51. doi: 10.1016/j.anl.2005.05.008. [DOI] [PubMed] [Google Scholar]
- Robinson K, Summerfield AQ. Adult auditory learning and training. Ear Hear. 1996;17:S51–S65. doi: 10.1097/00003446-199617031-00006. [DOI] [PubMed] [Google Scholar]
- Ruggles D, Bharadwaj H, Shinn-Cunningham BG. Why middle-aged listeners have trouble hearing in everyday settings. Curr Biol. 2012;22:1417–22. doi: 10.1016/j.cub.2012.05.025. [DOI] [PMC free article] [PubMed] [Google Scholar]
- Schneider BA, Pichora-Fuller MK. Semin hear. Thieme Medical Publishers, Inc.; 2001. Age-related changes in temporal processing: implications for speech perception; pp. 227–40. [Google Scholar]
- Sergeyenko Y, Lall K, Liberman MC, Kujawa SG. Age-related cochlear synaptopathy: An early-onset contributor to auditory functional decline. J Neurosci. 2013;33:13686–94. doi: 10.1523/JNEUROSCI.1783-13.2013. [DOI] [PMC free article] [PubMed] [Google Scholar]
- Shanks JE, Wilson RH, Larson V, Williams D. Speech recognition performance of patients with sensorineural hearing loss under unaided and aided conditions using linear and compression hearing aids. Ear Hear. 2002;23:280–90. doi: 10.1097/00003446-200208000-00003. [DOI] [PubMed] [Google Scholar]
- Shinn-Cunningham BG, Best V. Selective attention in normal and impaired hearing. Trends Amplif. 2008;12:283–99. doi: 10.1177/1084713808325306. [DOI] [PMC free article] [PubMed] [Google Scholar]
- Singh G, Pichora-Fuller MK. Older adults’ performance on the speech, spatial, and qualities of hearing scale (SSQ): Test-retest reliability and a comparison of interview and self-administration methods. Int J Audiol. 2010;49:733–40. doi: 10.3109/14992027.2010.491097. [DOI] [PubMed] [Google Scholar]
- Stecker GC, Bowman GA, Yund EW, Herron TJ, Roup CM, Woods DL. Perceptual training improves syllable identification in new and experienced hearing aid users. J Rehabil Res Dev. 2006;43:537–51. doi: 10.1682/jrrd.2005.11.0171. [DOI] [PubMed] [Google Scholar]
- Sweetow R, Palmer CV. Efficacy of individual auditory training in adults: a systematic review of the evidence. J Am Acad Audiol. 2005;16:494–504. doi: 10.3766/jaaa.16.7.9. [DOI] [PubMed] [Google Scholar]
- Sweetow RW, Henderson Sabes J. Auditory Training and Challenges Associated with Participation and Compliance. J Am Acad Audiol. 2010;21:586–93. doi: 10.3766/jaaa.21.9.4. [DOI] [PubMed] [Google Scholar]
- Sweetow RW, Sabes HJ. The need for and development of an adaptive Listening and Communication Enhancement (LACE (TM)) program. J Am Acad Audiol. 2006;17:538–58. doi: 10.3766/jaaa.17.8.2. [DOI] [PubMed] [Google Scholar]
- Sweetow RW, Sabes JH. Technologic advances in aural rehabilitation: Applications and innovative methods of service delivery. Trends Amplif. 2007;11:101–11. doi: 10.1177/1084713807301321. [DOI] [PMC free article] [PubMed] [Google Scholar]
- Takahashi G, Martinez CD, Beamer S, Bridges J, Noffsinger D, Sugiura K, et al. Subjective measures of hearing aid benefit and satisfaction in the NIDCD/VA follow-up study. J Am Acad Audiol. 2007;18:323–49. doi: 10.3766/jaaa.18.4.6. [DOI] [PubMed] [Google Scholar]
- Tallon-Baudry C, Bertrand O, Delpuech C, Pernier J. Stimulus specificity of phase-locked and non-phase-locked 40 hz visual responses in human. J Neurosci. 1996;16:4240–9. doi: 10.1523/JNEUROSCI.16-13-04240.1996. [DOI] [PMC free article] [PubMed] [Google Scholar]
- Tremblay KL, Billings C, Rohila N. Speech evoked cortical potentials: effects of age and stimulus presentation rate. J Am Acad Audiol. 2004;15:226–37. doi: 10.3766/jaaa.15.3.5. [DOI] [PubMed] [Google Scholar]
- Tremblay KL, Piskosz M, Souza P. Effects of age and age-related hearing loss on the neural representation of speech cues. Clin Neurophysiol. 2003;114:1332–43. doi: 10.1016/s1388-2457(03)00114-7. [DOI] [PubMed] [Google Scholar]
- Tyler RS, Summerfield AQ. Cochlear implantation: Relationships with research on auditory deprivation and acclimatization. Ear Hear. 1996;17:S38–S50. doi: 10.1097/00003446-199617031-00005. [DOI] [PubMed] [Google Scholar]
- Vale C, Sanes DH. The effect of bilateral deafness on excitatory and inhibitory synaptic strength in the inferior colliculus. Eur J Neurosci. 2002;16:2394–404. doi: 10.1046/j.1460-9568.2002.02302.x. [DOI] [PubMed] [Google Scholar]
- Van Dun B, Kania A, Dillon H. Semin Hear. Thieme Medical Publishers; 2016. Cortical auditory evoked potentials in (un) aided normal-hearing and hearing-impaired adults; pp. 009–24. [DOI] [PMC free article] [PubMed] [Google Scholar]
- Van Tasell DJ. Hearing loss, speech, and hearing aids. J Speech Hear Res. 1993;36:228–44. doi: 10.1044/jshr.3602.228. [DOI] [PubMed] [Google Scholar]
- Vander Werff KR, Burns KS. Brain Stem Responses to Speech in Younger and Older Adults. Ear Hear. 2011;32:168–80. doi: 10.1097/AUD.0b013e3181f534b5. [DOI] [PubMed] [Google Scholar]
- Vongpaisal T, Pichora-Fuller MK. Effect of age on F0 difference limen and concurrent vowel identification. J Speech Hear Res. 2007;50:1139–56. doi: 10.1044/1092-4388(2007/079). [DOI] [PubMed] [Google Scholar]
- Walton JP, Frisina RD, O’Neill WE. Age-related alteration in processing of temporal sound features in the auditory midbrain of the CBA mouse. J Neurosci. 1998;18:2764–76. doi: 10.1523/JNEUROSCI.18-07-02764.1998. [DOI] [PMC free article] [PubMed] [Google Scholar]
- Watson CS. Speech-perception aids for hearing-impaired people- current status and needed research. J Acoust Soc Am. 1991;90:637–85. [PubMed] [Google Scholar]
- Wienbruch C, Paul I, Weisz N, Elbert T, Roberts LE. Frequency organization of the 40-Hz auditory steady-state response in normal hearing and in tinnitus. Neuroimage. 2006;33:180–94. doi: 10.1016/j.neuroimage.2006.06.023. [DOI] [PubMed] [Google Scholar]
- Willott JF, Parham K, Hunter KP. Comparison of the auditory sensitivity of neurons in the cochlear nucleus and inferior colliculus of young and aging C57BL/6J and CBA/J mice. Hear Res. 1991;53:78–94. doi: 10.1016/0378-5955(91)90215-u. [DOI] [PubMed] [Google Scholar]
- Wilson R, Abrams H, Pillion A. A word-recognition task in multitalker babble using a descending presentation mode from 24 dB to 0 dB signal to babble. J Rehabil Res Dev. 2003;40:321–8. doi: 10.1682/jrrd.2003.07.0321. [DOI] [PubMed] [Google Scholar]
- Yueh B, Shapiro N, MacLean CH, Shekelle PG. Screening and management of adult hearing loss in primary care: scientific review. JAMA. 2003;289:1976–85. doi: 10.1001/jama.289.15.1976. [DOI] [PubMed] [Google Scholar]
- Zhu J, Garcia E. The Wechsler Abbreviated Scale of Intelligence (WASI) New York: Psychological Corporation; 1999. [Google Scholar]
Associated Data
This section collects any data citations, data availability statements, or supplementary materials included in this article.