Abstract
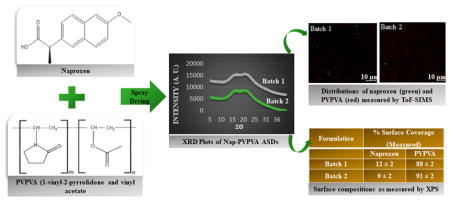
Surface composition critically impacts stability (e.g., crystallization) and performance (e.g., dissolution) of spray dried amorphous solid dispersion (ASD) formulations; however, traditional characterization techniques such as Raman and infrared spectroscopies may not provide useful information on surface composition on the spray dried ASD particles due to low spatial resolution, high probing depth, and lack of quantitative information. This study presents an advanced surface characterization platform consisting of two complementary techniques: X-ray photoelectron spectroscopy (XPS) and time-of-flight secondary ion mass spectrometry (ToF-SIMS). Such a platform enables qualitative and quantitative measurements of surface composition for the fine spray dried ASD particles with ultrasurface-sensitivity (less than 10 nm from the surface) and superior spatial resolution (approximately 250 nm for ToF-SIMS). Both XPS and ToF-SIMS demonstrated that the polymer (PVPVA) was dominantly enriched on the surface of our spray dried naproxen-PVPVA ASD particles. Of a particular note was that XPS could differentiate two batches of spray dried ASD particles with a subtle difference in surface composition produced by varying feed solution solvents. This advanced surface characterization platform will provide essential surface information to understand the mechanisms underlying the impact of surface composition on stability (e.g., crystallization) and functionality (e.g., dissolution) in future studies.
Keywords: amorphous solid dispersions, spray drying, surface composition heterogeneity, surface characterization, XPS, ToF-SIMS
Graphical Abstract
INTRODUCTION
Oral dosage forms are the most popular dosage administration route for pharmaceutical products because of lower manufacturing cost, easier administration and higher patient compliance as compared with parenteral administrations.1,2 For orally administered medications to be absorbed systemically with sufficient bioavailability, drug solubilization and dissolution are essential steps and can be limiting factors for drugs with low aqueous solubility and high permeability. Based on the aqueous solubility and membrane permeability of drugs, the Bio-pharmaceutics Classification System (BCS) categorizes drugs into four classes, viz. Class I (highly soluble and highly permeable), Class II (low soluble and highly permeable), Class III (highly soluble and low permeable), and Class IV (low soluble and low permeable).3 Unfortunately, a high percentage (>60%) of drugs in the development pipeline are in the BCS Class II category.4,5 Several formulation strategies have been applied to increase the solubility and/or dissolution rate of this class of drugs, such as salt formation, amorphous solid dispersions (ASDs), nanoparticles, cyclodextrin complexation, microemulsions, and cocrystals.6 Formulating BCS Class II drugs into amorphous solid dispersions (ASDs) is one of the more widely used strategies for enhancing drug solubility and dissolution.7,8
In an amorphous dispersion formulation, the active pharmaceutical ingredient (API) is dispersed in a matrix,9 which is typically a polymer and may contain other components. When the drug is in the amorphous state, no energy is needed to break the crystal lattice during solubilization.10 Hence, compared to the crystalline form, amorphous drugs generally can achieve higher apparent solubility and faster dissolution.11 Dispersion in a hydrophilic polymer matrix can further enhance the dissolution rate, particularly at low drug loadings. Several techniques can be used to produce ASD formulations including spray drying, hot melt extrusion, quench cooling from the melt, solvent evaporation, and electrospinning/spraying. Over the past decade, spray drying has increasingly been used to manufacture ASD particles, particularly for the thermo-labile molecules that are not suitable for hot melt extrusion.12,13 In spray drying to produce an ASD, the feed solution containing the drug and polymer is atomized into fine droplets and rapidly dried into particles where the drug is typically trapped in the amorphous form.14 Spray drying is used for the commercial manufacture of several ASD formulations15 and is a continuous process with a scale-up capability.16
As ASDs typically contain drug in a high energy state, there is a risk for the drug to convert to a more stable crystalline state. Such unwanted crystallization can compromise the solubility/dissolution/bioavailability advantages of ASDs.17 The polymers used to formulate ASDs typically confer some protection against crystallization by decreasing drug nucleation and growth rates, through effects such as reducing the drug chemical potential, forming specific interactions such as hydrogen bonds with the drug, decreasing matrix mobility, and increasing the glass transition temperature (Tg).18,19 Studies have shown that phase separation of the drug and polymer in the dispersion can promote the crystallization of the drug.20,21 Thus, it is considered crucial to characterize and maintain a homogeneous dispersion of drug and polymer in the formulation in order to ensure physical stability.22 However, the spray drying process can produce particles with a heterogeneous dispersion of components with differentiated physical and chemical properties. Zhou et al. showed that the poorly water-soluble compounds, rifampicin23 or azithromycin,24 were enriched on particle surfaces when they were co-spray dried with the water-soluble drug, colistin, from a cosolvent system of water and ethanol. For ASDs, if the drug is enriched on the surface of the spray dried particles, crystallization is likely to be facilitated, particularly when the particle surfaces are exposed to moisture.25,26 Teerakapibal et al. demonstrated that surface coatings with gelatin could inhibit surface crystallization of amorphous films of indomethacin or nifedipine.27 Hence, there is a need to characterize and understand the heterogeneous distribution of various components in spray dried ASD particles, especially at particle surfaces, with an aim of optimizing the formulation and processing conditions to achieve a homogeneous distribution and ensure the physical stability.28
Although there are some reports of macroscopic phase separation in the bulk of ASDs,26,29 studies on spray dried particle surfaces are scarce. Characterization of the composition of the first few molecular layers of the surface of fine spray dried particles is extremely challenging because of the relatively small particle size (ranging from a few microns to tens of microns).30,31 To provide meaningful surface information on such fine particles, measurement techniques with both high surface-sensitivity and superior spatial resolution are required. Unfortunately, many of the common characterization techniques such as Raman or infrared (IR) spectroscopies typically have a low spatial resolution, a high probing depth of a few microns,32,33 and hence, for spray dried particles, provide bulk-level information with low surface sensitivity. Therefore, there is a need to develop advanced characterization tools with high surface-sensitivity and superior spatial resolution to better understand the properties of spray dried particles.
The surface characterization platform developed in this study consists of two complementary measurements: X-ray photo-electron spectroscopy (XPS) and time-of-flight secondary ion mass spectrometry (ToF-SIMS) for fine spray dried ASD particles. This platform enables qualitative and quantitative measurements of chemical species on the surface of spray dried ASD particles with both ultrahigh surface sensitivity (top 10 nm) and nanometer-scale spatial resolution (approximately 250 nm for ToF-SIMS). Naproxen, a weakly acidic drug (pKa of 4.15, logP of 3.18, melting point 153 °C, and aqueous absolute solubility of 15.9 mg/L at 25 °C)34 was used as the model drug. Kollidon VA 64 (PVPVA), a copolymer of 1-vinyl-2-pyrrolidone and vinyl acetate in a ratio of 6:4 by mass, was used as the model polymer (Figure 1). The surface composition information obtained by this advanced platform will be critical to understand and optimize the stability of spray dried ASD formulations.
Figure 1.
Chemical structures of (A) naproxen and (B) PVPVA (1-vinyl-2-pyrrolidone and vinyl acetate in a ratio of 6:4 by mass).
EXPERIMENTAL SECTION
Materials
Naproxen was purchased from Attix Pharmaceuticals (Toronto, Ontario, Canada). Kollidon VA 64 (PVPVA) was supplied by BASF Corporation (Florham Park, New Jersey, USA). Methanol and acetone (HPLC grade) were purchased from Sigma–Aldrich (St. Louis, Missouri, USA).
Spray Drying
A Büchi 290 spray dryer (Büchi Labortechnik AG, Falwil, Switzerland) was used to prepare spray dried ASDs. For Batch 1, equal amounts (500 mg each) of naproxen and PVPVA were weighed and dissolved in cosolvent containing equal volumes of methanol and acetone to obtain a total solids concentration of 50 mg/mL. The key operating parameters during spray drying were slightly modified from the literature:35 inlet temperature 50 ± 2 °C; outlet temperature 30 ± 2 °C; aspirator 35 m3/h; atomizer setting 700 L/h; feed rate 12 mL/min. The spray dried samples were kept in a desiccator with silica gel until analysis. For Batch 2, equal amounts (500 mg each) of naproxen and PVPVA were dissolved in a cosolvent containing methanol and acetone in a 1:9 volumetric ratio. The spray drying processing parameters for Batch 2 were the same as those for Batch 1. The composition of the cosolvent was changed with an expectation to generate different surface compositions of drug and polymer on the spray dried particle surfaces. This was because naproxen has a higher solubility in acetone than in methanol, while PVPVA has similar solubility in acetone and methanol. It was hypothesized that the advanced surface characterization platform developed here can differentiate the subtle change on surface composition caused by different cosolvent systems.
Powder X-ray Diffraction (P-XRD)
P-XRD (Rigaku Smartlab diffractometer, Rigaku Americas, Texas, USA) with Cu–Kα radiation source and a D/tex ultradetector was used to determine drug crystallinity. The samples were spread uniformly on a glass slide and placed in the measurement chamber. The samples were scanned over 2θ range of 5° to 40° with a voltage of 40 kV and a current of 44 mA.
Scanning Electron Microscopy (SEM)
A field emission scanning electron microscope (NOVA nanoSEM, FEI Company, Hillsboro, Oregon, USA) was used to evaluate the morphology of spray-dried ASD particles. A small amount of sample was spread on an adhesive carbon tape attached to a stainless-steel stub. Pressurized air was used to remove excessive powders. These samples were then coated with platinum by a sputter coater (208 HR, Cressington Sputter Coater, Watford, UK). An inbuilt software was used to capture the images.
Particle Size Distribution
Scanning electron microscopy images were used to determine the particle size of the samples.36 Three different SEM images were evaluated using the ImageJ software (National Institute of Health, Rockville, Maryland, USA), and the Martin’s diameter of approximately 150 randomly selected particles was measured for each sample. D10, D50 and D90 were calculated.
Time-of-Flight Secondary Ion Mass Spectrometry (ToF-SIMS)
Time-of-flight secondary ion mass spectrometry (nanoToF instrument, Physical Electronics Inc., Chanhassen, Minnesota, USA) was used to analyze the surface composition of the particle surface. In ToF-SIMS analysis, the surface of a solid sample is bombarded with a beam of primary ions. This results in the extraction and emission of atomic and molecular secondary ions from the outer layers of solid surface (sputtering).37,38 The mass of these secondary ions is measured by corelating it with their time-of-flight to the detector. Such an analysis cycle can be repeated at higher frequencies to obtain a comprehensive mass spectrum. The high transmission, high mass resolution of the time-of-flight mass spectrometer along with the ability to detect ions of different masses simultaneously makes it suitable for secondary ion analysis.37,38 The process described by Zhou et al.39 was used in the current study with a few minor modifications. The instrument was operated at 30 kV energy and equipped with a pulsed liquid metal 79+Au primary ion gun. Electron flood gun and 10 eV Ar+ ions provided dual charge neutralization. An “unbunched” Au1 instrument setting was used to optimize spatial resolution while performing surface analysis. A positive SIMS mode was used to collect raw data from several locations typically using a 100 × 100 μm2 raster area, with 2 min acquisitions. Five randomly selected areas of interest were imaged per sample to collect a representative data set for purposes of statistical interrogation.
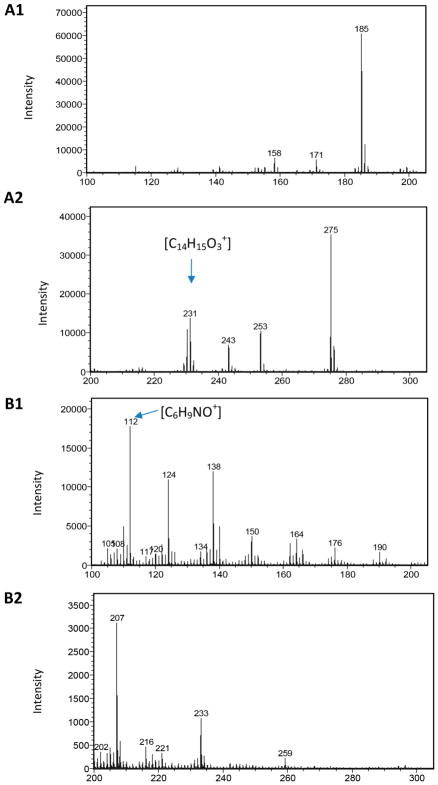
WincadenceN software (Physical Electronics Inc., Chanhassen, Minnesota, USA) was used to generate high-resolution surface composition overlays. Region-of-interest analyses were performed on the collected raw image. Mass spectra were extracted specifically from within the boundaries of the particles of interest, which allowed the surface chemistry of the particle to be extracted from the background signals. Characteristic peak fragments for naproxen and PVPVA were selected to be [C14H15O3+] [~231 atomic mass unit (amu)] and [C6H9NO+] (~112 amu), respectively (Figure 2). These characteristic fragments formed the basis of calibration and peak selection from the resulting spectra of samples. The surface chemistry of the particles was semiquantitatively compared by normalizing the integrated peak values of the selected symbol ions to the total secondary ion intensity.
Figure 2.
ToF-SIMS spectra of (A) naproxen and (B) PVPVA.
X-ray Photoelectron Spectroscopy (XPS)
X-ray photo-electron spectroscopy (XPS) (AXIS Ultra DLD spectrometer, Kratos Analytical Inc., Manchester, UK) with monochromic Al Kα radiation (1486.6 eV) was used for a quantitative surface composition study of the ASDs. In XPS analysis, the surface of the sample is irradiated with an X-ray beam. The photons cause core-level electrons to be emitted with a specific kinetic energy, which is measured by an energy analyzer. Such generated photoelectron spectrum contains the photoemission peaks of all elements (but H and He). The shift of the core-level peaks due to a chemical bond with another atom(s), which is often referred to as a chemical shift, helps to identify the chemical state of an element. The inelastic mean free path of the photoelectrons in a solid is in the range of a few nanometers, and therefore, the XPS information depth is limited to approximately 10 nm (for Al Kα radiation of 1486.6 eV). XPS has been used for characterization of complex organic material such as peptides40 and drugs.41
The XPS spectra were collected at constant pass energy (PE) mode using PE of 20 and 160 eV for high-resolution and survey spectra, respectively. To avoid nonhomogeneous electric charge of nonconducting powder and achieve better resolution, a commercial Kratos charge neutralizer was employed. Typical full width at half-maximum of the photoemission peak from a metal (Au 7f or Ag 3d) is ~0.35 eV at PE of 20 eV. Binding energy (BE) values refer to the Fermi edge. The binding energy scale was calibrated using Au 4f7/2 at 84.0 eV and Cu 2p3/2 at 932.67 eV. A double-sided sticking Cu tape was used to place powder samples on a stainless steel sample holder. XPS data was processed using a CasaXPS software. Curve-fitting of the O 1s, N 1s, and C 1s regions was performed to determine the relative fractions of PVPVA and naproxen in ASD formulations.26,42–44 The model O 1s, N 1s and C 1s peaks obtained from the pure materials, PVPVA and naproxen, were used for curve fitting. The fractional area of the components corresponds to the number of atoms of interest (PVPVA and naproxen) in the near-surface region. Figure 3 shows the example of the C 1s peak curve fitting by the PVPVA and naproxen components for the sample of Batch 1. Atomic concentrations of the elements in near-surface region were calculated following a Shirley background subtraction and by considering corresponding Scofield atomic sensitivity factors and inelastic mean free path (IMFP) of photoelectrons using standard procedures in the CasaXPS software.39 Figure 4 shows the reference spectra and curve-fit using O 1s. At least five replicates were measured, and results were averaged.
Figure 3.
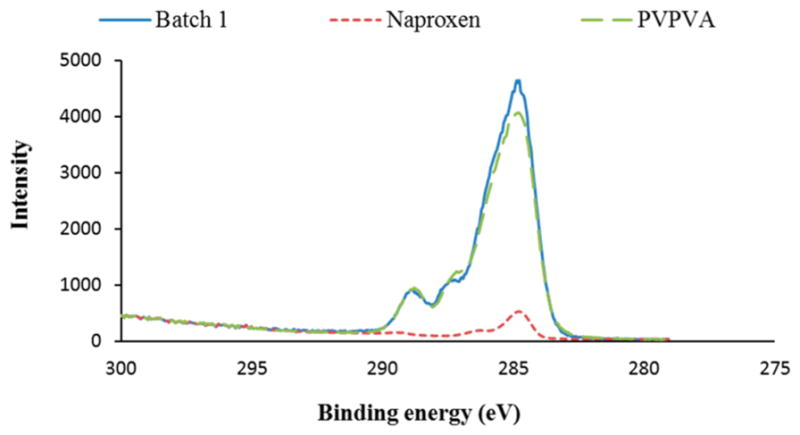
Example of the C 1s peak curve-fit for the sample of Batch 1.
Figure 4.
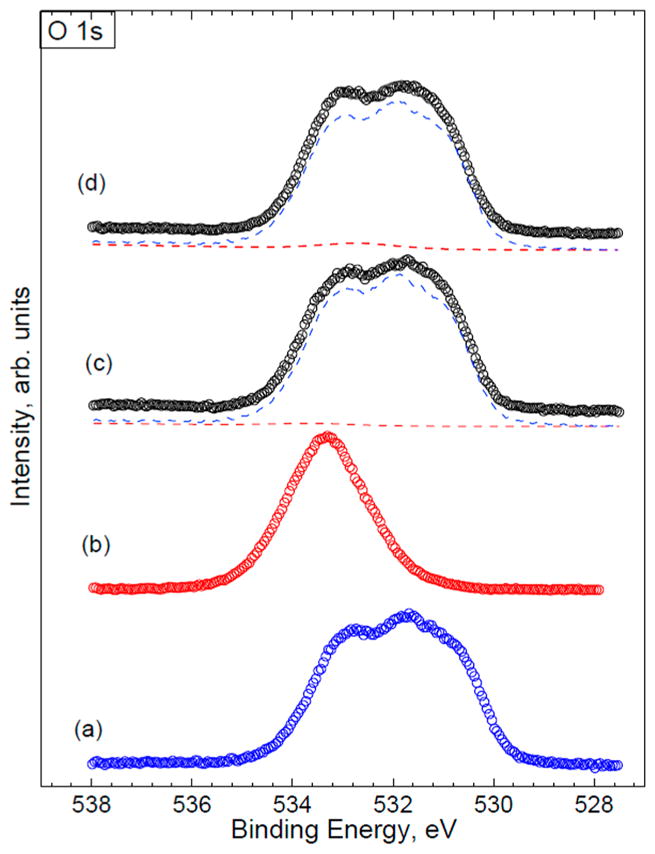
Example of the O 1s peak curve-fit: (a) PVPVA (reference spectrum); (b) NAP (reference spectrum); (c) Batch 1 (PVPVA component is blue; NAP component is red); (d) Batch 2 (PVPVA component is blue; NAP component is red).
Statistical Analysis
Data are presented as mean ± standard deviation (SD). The statistical analysis was conducted by an independent t test using SPSS software (SPSS Inc. IBM Corporation, New York).
RESULTS AND DISCUSSION
Two batches of naproxen-PVPVA ASD solids were prepared by spray drying. The purpose of preparing two batches was to generate spray dried particles with subtle difference in surface composition by adjusting the components of the cosolvents. The hypothesis was that the advanced surface characterization platform would be able to measure subtle differences in the surface composition of the spray dried ASD particles.
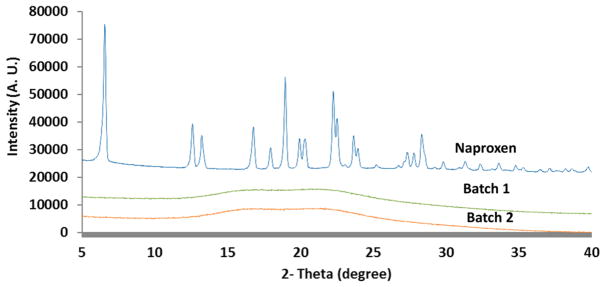
Crystallinity of the samples was evaluated using P-XRD (Figure 5). As-supplied naproxen showed sharp peaks indicating its crystalline nature. In contrast, solid dispersions of naproxen-PVPVA did not exhibit any crystalline peaks, which demonstrated both batches of spray dried particles were amorphous.
Figure 5.
Power X-ray diffraction patterns of supplied naproxen, Batch 1 ASD (Naproxen_PVPVA spray dried from methanol and acetone in volumetric ratio of 1:1) and Batch 2 ASD (Naproxen_PVPVA spray dried from methanol and acetone in volumetric ratio of 1:9).
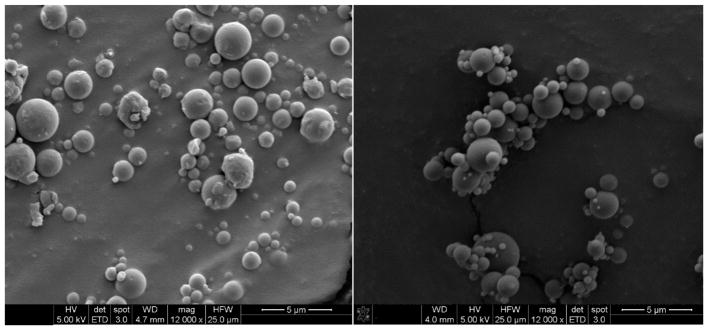
SEM images of the spray-dried ASD samples are shown in Figure 6. The spray dried particles from both batches had very similar particle shape, size, and surface texture. SEM images are not capable of providing any information on surface composition.
Figure 6.
Representative scanning electron microscopy images of (A) Batch 1, Naproxen_PVPVA spray dried from methanol and acetone in volumetric ratio of 1:1; and (B) Batch 2, Naproxen_PVPVA spray dried from methanol and acetone in volumetric ratio of 1:9.
Table 1 shows the particle size information on the formulations. The values indicate two spray dried batches had similar particle sizes. For industrial manufacturing, a larger size for spray dried particles is preferable rather than the fine particles generated herein. However, in the present study, very small sizes were intentionally generated for the spray dried particles to test the capability of the surface characterization platform for extremely fine particles.
Table 1.
Particle Sizes (n = 150) and Surface Compositions As Measured by XPS (n = 5) and ToF-SIMS (n = 5) of Batch 1 ASD (Naproxen_PVPVA Spray Dried from Methanol and Acetone in Volumetric Ratio of 1:1) and Batch 2 ASD (Naproxen_PVPVA Spray Dried from Methanol and Acetone in Volumetric Ratio of 1:9)
| formulation | XPS (C 1s spectra) | ||||||||
|---|---|---|---|---|---|---|---|---|---|
| particle size (μm) | % surface composition (theoretical) | % surface composition (measured) | ToF-SIMS (% normalized counts) | ||||||
|
|
|
|
|
||||||
| D10 | D50 | D90 | naproxen | PVPVA | naproxen | PVPVA | m/z 231 (naproxen) | m/z 112 (PVPVA) | |
| Batch 1 | 0.1 ± 0.0 | 0.5 ± 0.2 | 1.1 ± 0.1 | 54 | 46 | 12 ± 2 | 88 ± 2 | 0.008 ± 0.002 | 0.025 ± 0.002 |
| Batch 2 | 0.1 ± 0.1 | 0.5 ± 0.1 | 1.0 ± 0.1 | 54 | 46 | 9 ± 2a | 91 ± 2a | 0.003 ± 0.001b | 0.025 ± 0.001 |
*p < 0.05.
**p < 0.01, significantly different from Batch 1.
ToF-SIMS images are shown in Figure 7. The focusing capability of the ion beams used in ToF-SIMS along with the nature of energy transfer from the primary ion beam to the particle surface results in a controlled removal of the fragment only from the uppermost surface.37,38 For solid surfaces, about 95% of the sputtering occurs from the top one or two molecular monolayers (approximately 1 nm). This enables characterization of the solid surface chemistry with ultrahigh surface-sensitivity, a wide mass range, high mass resolution, and a lateral resolution in nanometer range (approximately 250 nm in this study).37,38
Figure 7.
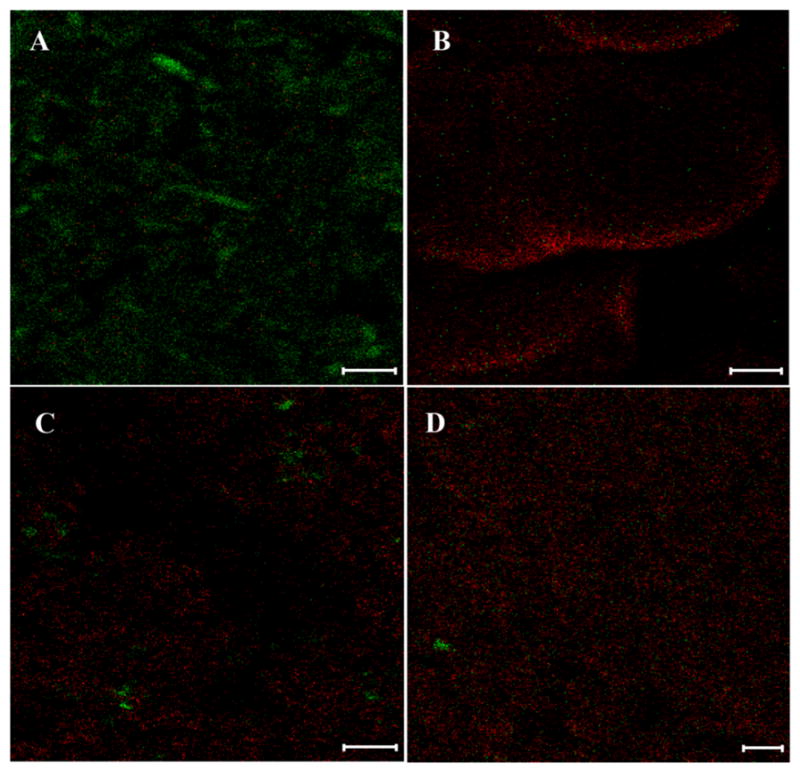
Distributions of naproxen (green) and PVPVA (red) measured by ToF-SIMS on the particle surfaces of (A) naproxen; (B) PVPVA; (C) Batch 1, Naproxen_PVPVA spray dried from methanol and acetone in volumetric ratio of 1:1; and (D) Batch 2, Naproxen_PVPVA spray dried from methanol and acetone in volumetric ratio of 1:9 (scale bar represents 10 μm).
In Figure 7, the green signals represent exclusive mass fragment of naproxen, and the red signals represent an exclusive mass fragment of PVPVA. Qualitative image analysis of both formulations indicated a heterogeneous surface composition on the surface of spray dried particles with an abundance of PVPVA. Table 1 shows the % normalized counts as measured by ToF-SIMS. Normalized counts can be defined here as the count of the selected secondary ions of each component divided by the total count of ions recorded. Integrated peak values of the selected ions have been normalized to the total secondary ion intensities. Since these values are percentages over the total ion signals of all species, percentage normalized counts do not give a measure of absolute surface coverage of the component. However, these can be considered as a useful tool for studying relative changes as they enabled a semi-quantitative comparison of surface compositions between two batches wherein naproxen content was found significantly higher (p < 0.01) on the particle surfaces of Batch 1; while no difference was measured in PVPVA between two batches (Table 1). To confirm the observed dominant distribution of PVPVA on the particle surfaces and the difference in surface composition between two formulations as measured by ToF-SIMS, the surface composition was further evaluated by XPS.
XPS provides quantitative information regarding chemical composition of the top approximately 10 nm of a particle surface. The XPS data (Table 1) demonstrated that PVPVA is considerably enriched on the particle surface for both formulations, indicating heterogeneity in component distribution within the spray dried particles. For example, for Batch 1, the theoretical concentration of PVPVA was approximately 45% (calculated by normalizing the relative carbon atom proportion in the formulation); while the measured surface concentration was 88 ± 2% (as determined by curve-fits of the C 1s). XPS data also clearly differentiated the varying surface compositions between two batches (p < 0.05), even though the difference was subtle (e.g., naproxen 12 ± 2% for Batch 1 and 9 ± 2% for Batch 2). We further confirmed these subtle differences and surface enrichment of PVPVA using O 1s (94 ± 3% surface is PVPVA for Batch 1 and 98 ± 2% for Batch 2, p = 0.029). To verify the quantitation by XPS, physical mixtures of spray dried pure drug and pure PVPVA were prepared at ratios of 25:75, 50:50, and 75:25. The differences in XPS data for physical mixtures between theoretical and measured values for each ratio is less than 10%, showing the measurement accuracy. In addition, the XPS data were in good agreement with the ToF-SIMS results, which enabled qualitative and quantitative measurements in surface composition for the spray dried ASD particles.
Solvent choice is an important factor that is known to impact the surface composition of spray dried particles,45 and thus, an underlying cause of different surface composition of the two batches could have been the varying solubilities of naproxen and PVPVA in the varying ratios of cosolvents used for the two batches. When a droplet of a solution is being spray dried, the solvent from the outer layers of the droplet is evaporated first. When such a solvent system contains two or more components, the substance with higher solubility in the solvent may have a higher diffusion as the solute molecules tend to diffuse toward the particle core.46 In contrast, the substances with relatively less solubility reach supersaturation rapidly and precipitate, whereby precipitated material has a much lower rate of diffusion and thus tends to concentrate on the particle surface as the solvent is being evaporated.47 Similarly, in this case, a higher solubility of naproxen in the cosolvent system used for Batch 2 could have led to a lower concentration on the particle surface.
Vehring et al. have discussed the correlation of a Peclet number for a component of interest in its surface enrichment.47 Peclet number (Pei), given by the following equation, depends on the processes of diffusion and solvent evaporation.
| (1) |
Here k is the solvent evaporation rate and Di is the diffusivity of the component of interest in the solvent system. Simulations by Vehring et al. suggested that higher Peclet number would be associated with higher surface enrichment. When the drying kinetics are faster than the component diffusivity, the component tends to concentrate on the outer surface. The higher molecular weight of the PVPVA relative to the naproxen is likely to lead to low polymer diffusivity and subsequent surface enrichment. The difference in the formulation surface composition observed in this study could have been a combination of one or more of these factors. Chen et al. showed surface tension may also impact surface composition of spray dried ASD particles because solutes with lower surface tension may concentrate on the air–liquid interface when droplets are formed so as to assemble a surface with low free energy.48 Thus, it is important to note that the process of spray drying is complex with several material properties and processing conditions affecting the particle surface composition. Hence, further systematic studies are warranted to unveil the true mechanisms of such heterogeneity surfaces of spray dried ASD particles.
In future studies, exposure of the inner surface of these particles by cryo-SEM, as discussed in the work of Gamble et al., may provide a complete picture of drug–polymer distribution in the particle.49 This method involves freezing the samples with liquid nitrogen and subsequently fracturing them to expose the inner surface of the particles. In addition, mass balance of these analysis methods could be investigated to test their ability to detect and quantify the degradation products generated by the sample.
CONCLUSION
In the present study, an advanced surface composition analysis platform consisting of ToF-SIMS and XPS measurements was developed. This platform had superior surface sensitivity (top 10 nm of the surface) and high spatial resolution (approximately 250 nm for ToF-SIMS), enabling both qualitative and quantitative measurements of compositions on the uppermost surface of spray dried ASD fine particles. It is noteworthy that even a subtle change in surface composition could be differentiated by the developed surface characterization platform between two batches of ASD particles spray dried with a difference feed solvent composition. The advanced surface characterization platform developed in this study will be very useful to understand mechanisms by which process parameters affect surface composition and study the underlying impacts of surface composition on the stability (e.g., crystallization) and functionality (e.g., dissolution) of ASDs in future studies.
Acknowledgments
Q.Z. is supported by the National Institute of Allergy and Infectious Diseases of the National Institutes of Health under Award Number R01AI132681. The content is solely the responsibility of the authors and does not necessarily represent the official views of the National Institutes of Health. Q.Z. is a recipient of the Ralph W. and Grace M. Showalter Research Trust Award. The authors are grateful for the scientific and technical assistance of the Australian Microscopy & Micro-analysis Research Facility at the Future Industries Institute, University of South Australia.
Footnotes
Notes
The authors declare no competing financial interest.
References
- 1.Mahay H. Oral chemotherapy: Patient advantages and challenges. Pharm Times. 2009;75(8):64–65. [Google Scholar]
- 2.Chandrasekhar R, Hassan Z, AlHusban F, Smith AM, Mohammed AR. The role of formulation excipients in the development of lyophilised fast-disintegrating tablets. Eur J Pharm Biopharm. 2009;72(1):119–129. doi: 10.1016/j.ejpb.2008.11.011. [DOI] [PubMed] [Google Scholar]
- 3.Zakeri-Milani P, Barzegar-Jalali M, Azimi M, Valizadeh H. Biopharmaceutical classification of drugs using intrinsic dissolution rate (IDR) and rat intestinal permeability. Eur J Pharm Biopharm. 2009;73(1):102–106. doi: 10.1016/j.ejpb.2009.04.015. [DOI] [PubMed] [Google Scholar]
- 4.Babu NJ, Nangia A. Solubility advantage of amorphous drugs and pharmaceutical cocrystals. Cryst Growth Des. 2011;11(7):2662–2679. [Google Scholar]
- 5.Xie T, Taylor LS. Dissolution Performance of High Drug Loading Celecoxib Amorphous Solid Dispersions Formulated with Polymer Combinations. Pharm Res. 2016;33(3):739–750. doi: 10.1007/s11095-015-1823-y. [DOI] [PubMed] [Google Scholar]
- 6.Jatwani S, Rana AC, Singh G, Aggarwal G. An overview on solubility enhancement techniques for poorly soluble drugs and solid dispersion as an eminent strategic approach. Int J Pharm Sci Res. 2012;3(4):942–956. [Google Scholar]
- 7.Van Den Mooter G. The use of amorphous solid dispersions: A formulation strategy to overcome poor solubility and dissolution rate. Drug Discovery Today: Technol. 2012;9(2):e79–e85. doi: 10.1016/j.ddtec.2011.10.002. [DOI] [PubMed] [Google Scholar]
- 8.Leuner C, Dressman J. Improving drug solubility for oral delivery using solid dispersions. Eur J Pharm Biopharm. 2000;50(1):47–60. doi: 10.1016/s0939-6411(00)00076-x. [DOI] [PubMed] [Google Scholar]
- 9.Chiou WL, Riegelman S. Pharmaceutical applications of solid dispersion systems. J Pharm Sci. 1971;60(9):1281–1302. doi: 10.1002/jps.2600600902. [DOI] [PubMed] [Google Scholar]
- 10.Hancock BC, Zografi G. Characteristics and significance of the amorphous state in pharmaceutical systems. J Pharm Sci. 1997;86(1):1–12. doi: 10.1021/js9601896. [DOI] [PubMed] [Google Scholar]
- 11.Vaka SRK, Bommana MM, Desai D, Djordjevic J, Phuapradit W, Shah N. Excipients for Amorphous Solid Dispersions. In: Shah N, Sandhu H, Choi DS, Chokshi H, Malick AW, editors. Amorphous Solid Dispersions: Theory and Practice. Springer New York; New York: 2014. pp. 123–161. [Google Scholar]
- 12.Patel RP, Patel MP, Suthar AM. Spray Drying Technology: An Overview. Indian Jourbal Sci Technol. 2009;2(10):44–47. [Google Scholar]
- 13.Crowley MM, Zhang F, Repka MA, et al. Pharmaceutical applications of hot-melt extrusion: Part I. Drug Dev Ind Pharm. 2007;33(9):909–926. doi: 10.1080/03639040701498759. [DOI] [PubMed] [Google Scholar]
- 14.Bohr A, Boetker JP, Rades T, Rantanen J, Yang M. Application of spray-drying and electrospraying/electospinning for poorly watersoluble drugs: A particle engineering approach. Curr Pharm Des. 2014;20(3):325–348. doi: 10.2174/13816128113199990399. [DOI] [PubMed] [Google Scholar]
- 15.Huang Y, Dai W-G. Fundamental aspects of solid dispersion technology for poorly soluble drugs. Acta Pharm Sin B. 2014;4(1):18–25. doi: 10.1016/j.apsb.2013.11.001. [DOI] [PMC free article] [PubMed] [Google Scholar]
- 16.Singh A, Van den Mooter G. Spray drying formulation of amorphous solid dispersions. Adv Drug Delivery Rev. 2016;100:27–50. doi: 10.1016/j.addr.2015.12.010. [DOI] [PubMed] [Google Scholar]
- 17.Baghel S, Cathcart H, O’Reilly NJ. Polymeric Amorphous Solid Dispersions: A Review of Amorphization, Crystallization, Stabilization, Solid-State Characterization, and Aqueous Solubilization of Biopharmaceutical Classification System Class II Drugs. J Pharm Sci. 2016;105(9):2527–2544. doi: 10.1016/j.xphs.2015.10.008. [DOI] [PubMed] [Google Scholar]
- 18.Purohit HS, Taylor LS. Phase separation kinetics in amorphous solid dispersions upon exposure to water. Mol Pharmaceutics. 2015;12(5):1623–1635. doi: 10.1021/acs.molpharmaceut.5b00041. [DOI] [PubMed] [Google Scholar]
- 19.Kou X, Zhou L. Stability of Amorphous Solid Dispersion. In: Shah N, Sandhu H, Choi DS, Chokshi H, Malick AW, editors. Amorphous Solid Dispersions: Theory and Practice. Springer New York; New York: 2014. pp. 515–544. [Google Scholar]
- 20.Shamblin SL, Zografi G. The effects of absorbed water on the properties of amorphous mixtures containing sucrose. Pharm Res. 1999;16(7):1119–1124. doi: 10.1023/a:1018960405504. [DOI] [PubMed] [Google Scholar]
- 21.Matsumoto T, Zografi G. Physical Properties of Solid Molecular Dispersions of Indomethacin with Poly(vinylpyrrolidone) and Poly(vinylpyrrolidone-co-vinyl-acetate) in Relation to Indomethacin Crystallization. Pharm Res. 1999;16(11):1722–1728. doi: 10.1023/a:1018906132279. [DOI] [PubMed] [Google Scholar]
- 22.Qian F, Huang J, Hussain MA. Drug–Polymer Solubility and Miscibility: Stability Consideration and Practical Challenges in Amorphous Solid Dispersion Development. J Pharm Sci. 2010;99(7):2941–2947. doi: 10.1002/jps.22074. [DOI] [PubMed] [Google Scholar]
- 23.Zhou Q, Gengenbach T, Denman JA, Yu HH, Li J, Chan HK. Synergistic Antibiotic Combination Powders of Colistin and Rifampicin Provide High Aerosolization Efficiency and Moisture Protection. AAPS J. 2014;16(1):37–47. doi: 10.1208/s12248-013-9537-8. [DOI] [PMC free article] [PubMed] [Google Scholar]
- 24.Zhou Q, Loh ZH, Yu J, et al. How Much Surface Coating of Hydrophobic Azithromycin Is Sufficient to Prevent Moisture-Induced Decrease in Aerosolisation of Hygroscopic Amorphous Colistin Powder? AAPS J. 2016;18(5):1213–1224. doi: 10.1208/s12248-016-9934-x. [DOI] [PMC free article] [PubMed] [Google Scholar]
- 25.Rumondor ACF, Marsac PJ, Stanford LA, Taylor LS. Phase behavior of poly (vinylpyrrolidone) containing amorphous solid dispersions in the presence of moisture. Mol Pharmaceutics. 2009;6(5):1492–1505. doi: 10.1021/mp900050c. [DOI] [PubMed] [Google Scholar]
- 26.Wang W, Zhou QT, Sun S-P, et al. Effects of Surface Composition on the Aerosolisation and Dissolution of Inhaled Antibiotic Combination Powders Consisting of Colistin and Rifampicin. AAPS J. 2016;18(2):372–384. doi: 10.1208/s12248-015-9848-z. [DOI] [PMC free article] [PubMed] [Google Scholar]
- 27.Teerakapibal R, Gui Y, Yu L. Gelatin Nano-coating for Inhibiting Surface Crystallization of Amorphous Drugs. Pharm Res. 2018;35(1):x. doi: 10.1007/s11095-017-2315-z. [DOI] [PubMed] [Google Scholar]
- 28.Puri V, Dantuluri AK, Kumar M, Karar N, Bansal AK. Wettability and surface chemistry of crystalline and amorphous forms of a poorly water soluble drug. Eur J Pharm Sci. 2010;40(2):84–93. doi: 10.1016/j.ejps.2010.03.003. [DOI] [PubMed] [Google Scholar]
- 29.Vasanthavada M, Tong WQ, Joshi Y, Kislalioglu MS. Phase behavior of amorphous molecular dispersions I: Determination of the degree and mechanism of solid solubility. Pharm Res. 2004;21(9):1598–1606. doi: 10.1023/b:pham.0000041454.76342.0e. [DOI] [PubMed] [Google Scholar]
- 30.Lin Y-W, Wong J, Qu Li, Chan H-K, Zhou Q(Tony) Powder production and particle engineering for dry powder inhaler formulations. Curr Pharm Des. 2015;21(27):3902–3916. doi: 10.2174/1381612821666150820111134. [DOI] [PubMed] [Google Scholar]
- 31.Zhou QT, Qu L, Larson I, Stewart PJ, Morton DAV. Improving aerosolization of drug powders by reducing powder intrinsic cohesion via a mechanical dry coating approach. Int J Pharm. 2010;394(1–2):50–59. doi: 10.1016/j.ijpharm.2010.04.032. [DOI] [PubMed] [Google Scholar]
- 32.Chan KLA, Kazarian SG. New opportunities in micro-and macro-attenuated total reflection infrared spectroscopic imaging: spatial resolution and sampling versatility. Appl Spectrosc. 2003;57(4):381–389. doi: 10.1366/00037020360625907. [DOI] [PubMed] [Google Scholar]
- 33.Vankeirsbilck T, Vercauteren A, Baeyens W, et al. Applications of Raman spectroscopy in pharmaceutical analysis. TrAC, Trends Anal Chem. 2002;21(12):869–877. [Google Scholar]
- 34.National Center for Biotechnology Information. Naproxen. PubChem Compound Database. :156391. [Google Scholar]
- 35.Paudel A, Van Den Mooter G. Influence of solvent composition on the miscibility and physical stability of naproxen/PVP K 25 solid dispersions prepared by cosolvent spray-drying. Pharm Res. 2012;29(1):251–270. doi: 10.1007/s11095-011-0539-x. [DOI] [PubMed] [Google Scholar]
- 36.Shekunov BY, Chattopadhyay P, Tong HHY, Chow AHL. Particle size analysis in pharmaceutics: Principles, methods and applications. Pharm Res. 2007;24(2):203–227. doi: 10.1007/s11095-006-9146-7. [DOI] [PubMed] [Google Scholar]
- 37.Benninghoven A. Chemical Analysis of Inorganic and Organic Surfaces and Thin Films by Static Time-of-Flight Secondary Ion Mass Spectrometry (TOF-SIMS) Angew Chem, Int Ed Engl. 1994;33(10):1023–1043. [Google Scholar]
- 38.Sodhi RNS, Ontario SI, Chemistry A. Time-of-flight secondary ion mass spectrometry (TOF-SIMS):—versatility in chemical and imaging surface analysis. Analyst. 2004;129(6):483–487. doi: 10.1039/b402607c. [DOI] [PubMed] [Google Scholar]
- 39.Zhou Q, Denman J, Gengenbach T, et al. Characterization of the Surface Properties of a Model Pharmaceutical Fine Powder Modified with a Pharmaceutical Lubricant to Improve Flow via a Mechanical Dry Coating Approach. J Pharm Sci. 2011;100(8):3421–3430. doi: 10.1002/jps.22547. [DOI] [PubMed] [Google Scholar]
- 40.Jedlicka SS, Rickus JL, Zemlyanov DY. Surface Analysis by X-ray Photoelectron Spectroscopy of Sol–Gel Silica Modified with Covalently Bound Peptides. J Phys Chem B. 2007;111(40):11850–11857. doi: 10.1021/jp0744230. [DOI] [PubMed] [Google Scholar]
- 41.Song Y, Zemlyanov D, Chen X, et al. Acid-Base Interactions of Polystyrene Sulfonic Acid in Amorphous Solid Dispersions Using a Combined UV/FTIR/XPS/ssNMR Study. Mol Pharmaceutics. 2016;13(2):483–492. doi: 10.1021/acs.molpharmaceut.5b00708. [DOI] [PubMed] [Google Scholar]
- 42.Wei G, Mangal S, Denman J, et al. Effects of Coating Materials and Processing Conditions on Flow Enhancement of Cohesive Acetaminophen Powders by High-Shear Processing With Pharmaceutical Lubricants. J Pharm Sci. 2017;106(10):3022–3032. doi: 10.1016/j.xphs.2017.05.020. [DOI] [PubMed] [Google Scholar]
- 43.Mangal S, Gengenbach T, Millington-Smith D, Armstrong B, Morton DAV, Larson I. Relationship between the cohesion of guest particles on the flow behaviour of interactive mixtures. Eur J Pharm Biopharm. 2016;102:168–177. doi: 10.1016/j.ejpb.2016.03.012. [DOI] [PubMed] [Google Scholar]
- 44.Zhou Q, Qu L, Gengenbach T, et al. Investigation of the extent of surface coating via mechanofusion with varying additive levels and the influences on bulk powder flow properties. Int J Pharm. 2011;413(1–2):36–43. doi: 10.1016/j.ijpharm.2011.04.014. [DOI] [PubMed] [Google Scholar]
- 45.Bhardwaj V, Trasi N, Zemlyanov DY, Taylor LS. Surface area normalized dissolution to study differences in itraconazole-copovidone solid dispersions prepared by spray-drying and hot melt extrusion. Int J Pharm. 2018;540:106. doi: 10.1016/j.ijpharm.2018.02.005. [DOI] [PubMed] [Google Scholar]
- 46.Vehring R. Pharmaceutical particle engineering via spray drying. Pharm Res. 2008;25(5):999–1022. doi: 10.1007/s11095-007-9475-1. [DOI] [PMC free article] [PubMed] [Google Scholar]
- 47.Vehring R, Foss WR, Lechuga-Ballesteros D. Particle formation in spray drying. J Aerosol Sci. 2007;38(7):728–746. [Google Scholar]
- 48.Chen Z, Yang K, Huang C, Zhu A, Yu L, Qian F. Surface enrichment and depletion of the active ingredient in spray dried amorphous solid dispersions. Pharm Res. 2018;35:38. doi: 10.1007/s11095-018-2345-1. [DOI] [PubMed] [Google Scholar]
- 49.Gamble JF, Ferreira AP, Tobyn M, et al. Application of imaging based tools for the characterisation of hollow spray dried amorphous dispersion particles. Int J Pharm. 2014;465(1–2):210–217. doi: 10.1016/j.ijpharm.2014.02.002. [DOI] [PubMed] [Google Scholar]


