

DNA methylation at cytosine-guanine dinucleotides (CG) and non-CG sites (CH) have cell type-specificity and are subject to active modification during development1. This motivates a single-cell approach, which can assess cell type and state specificity in complex tissues through methylation profiles. DNA methylation can be probed at base-pair resolution at the whole genome scale using bisulfite sequencing (WGBS)2. Recent work optimized bisulfite sequencing to enable assessment at the single-cell level (scWGBS)3–8; these assays provide unique insights into methylation patterning. However, the scWGBS protocol processes each cell in its own reaction vessel, severely limiting cell count throughput. Furthermore, alignment rates for traditional scWGBS libraries are much lower (on the order of 25 ± 20%) than for the equivalent bulk protocol3–7, which increases the cost of obtaining sufficient information. A recent study achieved an alignment rate just over 50%, for over 6,000 single cells; however, the study relied on a brute-force strategy that still required an individual reaction well for each cell produced8.
We have described a strategy for combinatorial indexing that has been extended to multiple applications9–13. In this platform, DNA (or RNA) within nuclei or cells is modified with an indexed adaptor corresponding to one of 96 (or 384) wells while nuclear integrity is maintained. Reactions are pooled, and a limited number of pre-indexed nuclei are redistributed into each of a new set of wells, such that the probability of two nuclei harboring the same initial index ending up in the same well is low. PCR is then used to incorporate a second index and generate a cell-specific barcode composed of the unique index combinations. We adapted our single-cell combinatorial indexing strategy, (sci-) to WGBS methylation analysis (sci-MET, Fig. 1a) using transposomes with adaptors depleted of cytosines, and thus unaffected by bisulfite treatment (Supplementary Data 1 and Supplementary Tables 1–3). The second adaptor is incorporated after pooling, redistribution, bisulfite conversion, and cleanup by performing multiple rounds of random primer extension, as in traditional scWGBS protocols3. This workflow enables the first stage of library construction in one set of wells, followed by the second stage, where each well contains a number of pre-indexed nuclei. We refer to the number of single-cell methylation libraries we expect per experiment as N × D, where N is the number of wells in the second stage of library preparation and D is the number of pre-indexed nuclei in each well (Supplementary Fig. 1).
Figure 1. sci-MET assay and performance.
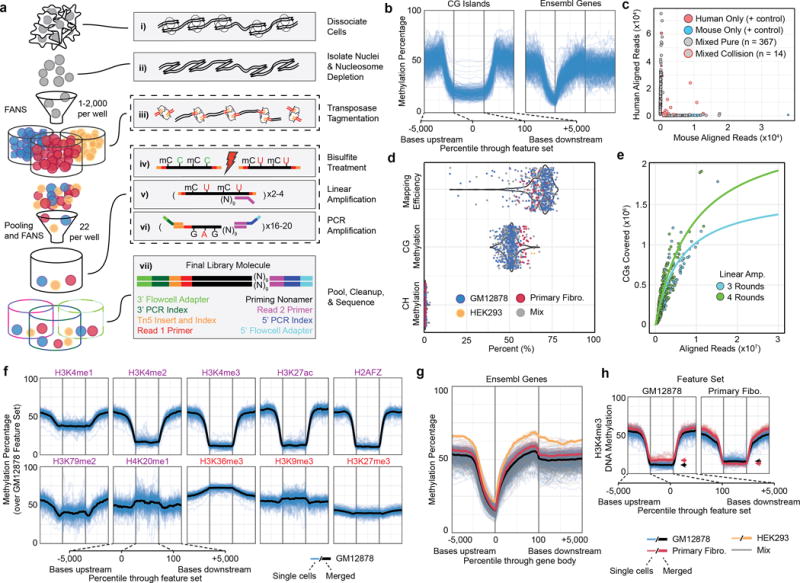
a. The sci-MET workflow. b. Methylation rates for single GM12878 cells (n=283 cells) over CG islands (left) and gene bodies (right). c. sci-MET of mixed mouse and human cells using xSDS nucleosome depletion to estimate barcode collisions. (n=566 cells). d. Mapping efficiency, global CG methylation and global CH methylation for a mix of human cell lines (n=641 cells). e. The number of CG dinucleotides covered by the total aligned reads per cell. f. Methylation rates for GM12878 cells. (Purple are generally activating and red are generally repressive features). g. Methylation rates for the three cell types over annotated genes. h. Methylation rates over GM12878 and Primary Fibroblast ENCODE H3K4me3 ChIP-seq peaks. Arrows indicate the mean for the feature set.
From a 96 × 22 experiment on a B-lymphoblast cell line (GM12878), we generated libraries for which we could identify barcodes corresponding to 708 single cells (33.5% efficiency, defined as the number of libraries generated out of the number expected). Sequencing this library to a low depth (mean 55,129 unique reads per cell; Supplementary Figs. 2,3) produced methylation profiles that closely match expectation for the GM12878 cell line (Fig. 1b). We next performed sci-MET on a mix of human and mouse cell lines using two alternative nucleosome depletion strategies to estimate the barcode collision rate (i.e., two nuclei of the same transposase barcode ending up in the same PCR well11). We observed a high collision rate using a lithium-based approach (22%); however, crosslinking and SDS treatment (xSDS) produced a low collision rate, in line with other combinatorial indexing strategies11–13 at 7.3% (Fig. 1c; Supplementary Figs. 1–4). We note that the collision rate is tunable by the number of nuclei sorted into each well during the second stage of indexing.
We next profiled pure populations and an uneven artificial mixture of GM12878, primary inguinal fibroblast (Primary Fibro., GM05756), and HEK293 cell lines. In a 40 × 22 experiment using xSDS nucleosome depletion, we characterized genome-wide methylation in 691 single cells passing quality filters (78.5% efficiency; Supplementary Figs. 1–3). We achieved a mean alignment rate of 68 ± 8% (Fig. 1d), approaching bulk-cell levels, likely due to the efficiency of transposase-based adaptor incorporation14, and a mean unique aligned read count of 403,265 per cell, with 48 cells producing over one million uniquely aligned reads (Supplementary Fig. 2). These data translate to coverages of mappable15 CG dinucleotides ranging from 0.05% to 7.0% (mean 1.1 ± 0.9%; Supplementary Data 2, see Supplementary Note 1 for detailed quality assessment). Both increased sequencing effort and additional rounds of linear amplification are likely to increase coverage, as libraries were not near saturation (Supplementary Fig. 5, Fig. 1c). Based on our projections, sci-MET, in its current form, produces lower per-cell coverage percentages than others have produced7; however, sufficient coverage per cell is achievable for cell type discrimination in a mixed population: the intended goal of low coverage, high cell count strategies.
We next summarized methylation status3 for each cell across autosomal loci of the Ensembl Regulatory Build16, which contains known transcription factor binding and other regulatory sites. We performed non-negative Matrix Factorization (NMF) followed by t-distributed Stochastic Neighbor Embedding (tSNE) to project cells in two-dimensional space, producing clearly defined clusters that were identified using density-based methods (Fig. 2a). We correlated the methylation rates of collapsed clusters with publically available WGBS datasets17,18 for the top 1,000 most variable regulatory regions. For each merged cluster, the two most highly correlated samples were of the same cell type, or the most similar cell line in the case of HEK293 (Fig. 2b, Supplementary Fig. 6,7).
Figure 2. sci-MET identifies single-cell methylomes by cell type.
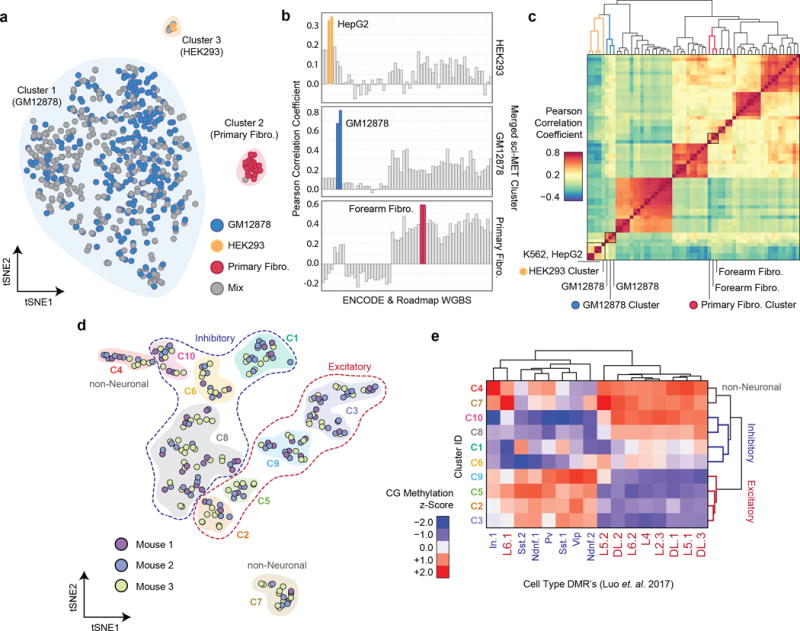
a. NMF-tSNE projections of single-cell methylomes. Clusters are indicated by a shaded background b. Single-cell methylomes (n=641 cells) were aggregated over the three clusters and then correlated with publically available whole genome bisulfite sequencing data. Closely matched cell types are in color. c. Hierarchical clustering on the Pearson correlation values of HEK293, GM12878, and Primary Fibro. d. NMF-tSNE projection of cortical cells based on CG and CH methylation. Clusters are indicated by a shaded background and grouped by class using dashed lines. e. Methylation z-score heatmap of aggregate cell clusters over previously described DMRs (n=285 cells).
To test whether cell type discrimination is possible in an in vivo model, we performed a 96 × 10 preparation from primary cortical tissue of three mice, for a total of 606 single-cell libraries. A subset of the second-stage indexing wells were sequenced to a higher depth than the rest of the plate (186 cells), with the remainder to enough depth to define them as true single-cell libraries (420 cells; Supplementary Figs. 1–3). Overall, this preparation produced a mean alignment rate of 59.9 ± 11.9%. In total, 285 cells met a read depth threshold of 30,000 uniquely aligned reads (mean 186,710) and were carried through subsequent analysis, with the percent of CGs covered genome wide ranging from 0.10% to 4.5% (mean 0.82 ± 0.85%; Supplementary Data 3).
We assessed methylation in the CH context, which is observed at elevated levels and in a distinct patterning in neuronal lineages (Supplementary Fig. 8–9)19,20, as well as in the CG context. We processed each matrix (CH over 100 kbp windows, CG over the Ensembl Regulatory Build) individually and combined through NMF-tSNE and clustering (Methods, Fig. 2d). Two clusters were determined to be likely non-neuronal cell populations, and the remainder neuronal (Supplementary Fig. 10). We then aggregated the coverage of each cluster and calculated the methylation percentage over previously described cortical differentially methylated regions (DMRs; Fig. 2e)8. This revealed a distinct enrichment for each neuronal cluster within sets of excitatory and inhibitory DMRs and allowed us to classify sets of clusters (Fig. 2d).
Inherent in our protocol is the ability to scale to far greater numbers by expanding the number of indexes (Supplementary Fig. 11). In addition to the increased throughput, we were able to achieve substantially improved read alignment rates when compared to existing lower-throughput approaches, dramatically reducing the sequencing burden. Our platform achieves both the throughput and cost-effectiveness (Supplementary Table 4) that is required to scale single-cell DNA methylation assessment to levels comparable to other epigenetic and transcriptional properties.
Online Methods
Preparation of unmethylated Control DNA
100 ng of unmethylated Lambda Phage DNA (Promega, Cat. D1521) was treated with 4uL of 500 nM transposase-adaptor complex (transposome) pre-loaded with cytosine-depleted custom oligonucleotides in 10 uL of 1X Nextera® Tagment DNA (TD) buffer from the Nextera® DNA Sample Preparation Kit (Illumina, Cat. FC-121-1031) diluted with NIB to simulate reaction conditions for nuclei. Following incubation for 20 min at 55 °C, this reaction was cleaned with QIAquick PCR Purification Kit (Qiagen, Cat. 28104) and eluted in 30 uL of 10 mM Tris-Cl solution (pH 8.0). The tagmented, cleaned DNA was then quantified via Qubit 2.0 Flourometer dsDNA High Sensitivity Assay (Thermo Fisher, Cat. Q32854).
Tissue culture
Tissue culture cell lines (GM12878, Coriell; NIH/3T3, ATCC CRL-1658; HEK293, ATCC CRL-1554; Primary Fibro., inguinal fibroblast, GM05756, Coriell, passage 7) were cultured in 5% CO2 at 37°C. GM12878 cells were grown in Roswell Park Memorial Institute media (RPMI, Gibco, Cat. 11875093) supplemented with 15% (v/v) fetal bovine serum (FBS, Gibco, Cat. 10082147), 1X L-glutamine (Gibco, Cat. 25030081), 1X Penicillin-Streptomycin (Gibco, Cat. 15140122), and gentamicin (Gibco, Cat. 15750060). HEK293 cells were grown in Dulbecco’s Modified Eagle’s media (DMEM, Gibco, Cat. 11995065), supplemented with 10% FBS (v/v), and 1X L-glutamine. NIH/3T3 cells were grown in the same preparation of DMEM as HEK293 cells. Primary Fibroblasts were cultured in a growth medium comprised of DMEM/F12 (with GlutaMax; Thermo Fisher), 10% fetal bovine serum (FBS; Thermo Fisher, v/v), 1% MEM Non-Essential Amino Acids (Thermo Fisher, v/v), and 1X Penicillin-Streptomycin (Gibco). Adherent cell lines were grown to ~90% confluency at the time of harvest.
Mouse Samples
All animal studies were approved by the Oregon Health and Science University Institutional Animal Care and Use Committee. C57BL/6J mice were obtained from Jackson Laboratory (stock number 000664). Sixty-day-old C57BL/6J female mice were deeply anesthetized using isoflurane. After decapitation the brain was removed and the entire cortex isolated and placed in ice cold PBS.
Sample preparation and nuclei isolation
For library preparation, cells were pelleted if cultured in suspension, or trypsinzed (Gibco, Cat. 25200056), if adherent. Cell were washed once with ice cold PBS and carried through cross-linking (for the xSDS method) or directly into nuclei preparation using nuclei isolation buffer (NIB, 10mM TrisHCl pH 7.4, 10 mM NaCl, 3mM MgCl2, 0.1% Igepal (v/v), 1X protease inhibitors (Roche, Cat. 1187358001)). Cortical samples were cut with a sterile razor blade and resuspended in a chilled 5mL modified nuclei isolation buffer (NIB-HEPES, 20mM HEPES, 10mM NaCl, 3mM MgCl2, 0.1% Igepal, 1X protease inhibitors). Cells were given 5 minutes to equilibrate to the salt solution before 5 loose strokes in a dounce homogenizer, another 5 minutes to equilibrate, and another 5 loose strokes and 10 tight strokes. Nuclei were then spun in a pre-chilled 4°C centrifuge for 5 minutes at 600 × g.
Nucleosome Depletion
Detailed step-by-step protocol for nucleosome depletion and all subsequent steps can be found in the Supplementary Note 2. Nucleosome depletion and combinatorial indexing strategies were performed similar to previously described, with some variations11.
Lithium-assisted nucleosome depletion (LAND) was performed for generation of GM12878-only and Human/Mouse libraries. Prepared nuclei were pelleted and resuspended in NIB supplemented with 200 uL of 12.5 mM lithium 3,5-diiodosalicylic acid (Sigma, Cat D3635) for 5 minutes on ice before addition of 800 uL NIB and then taken directly into the combinatorial indexing protocol.
Cross-linking and SDS nucleosome depletion (xSDS)
Cells were cross-linked by incubation in 10 mL of media with 1.5% formaldehyde (v/v) and incubated at room temperature for 10 minutes with gentle agitation. Cross-linking was quenched with 800 uL 2.5 M glycine and incubated on ice for 5 minutes. Cells were then spun down, washed with ice-cold PBS, and resuspended in ice-cold NIB for a 20 minute incubation on ice with gentle agitation. Cells were then pelleted, washed with 900 uL of 1X NEBuffer 2.1 and resuspended in 800 uL 1X NEBuffer 2.1 with 0.3% SDS (v/v, Sigma, Cat. L3771) and incubated at 42°C with vigorous shaking for 30 minutes in a thermomixer (Eppendorf). 200 uL of 10% Triton-X was added to quench, and the solution was incubated at for another 30 minutes at 42°C with vigorous shaking. Nuclei were then taken into the combinatorial indexing protocol. We were concerned that the crosslinking may affect the bisulfite conversion reaction; however, based on the methylation rates (particularly for those of nonCG methylation which were very low in concordance with expectations), we determined that not to be the case.
Combinatorial indexing via tagmentation
Nuclei were stained with 8uL of 5mg/mL DAPI (Thermo Fisher, Cat. D1306) and passed through a 35-um cell strainer. A 96-well plate was prepared with 10 uL of 1X TD buffer diluted with NIB in each well. Fluorescence-assisted nuclei sorting (FANS) was performed with a Sony SH800 flow sorter to sort 2,500 single nuclei into each well in fast sort mode (Supplementary Fig. 12). 4uL of 500 nM transposome, pre-loaded with cytosine-depleted, uniquely indexed, custom oligonucleotides were placed in each well (described in Supplementary Note 2, transposomes assembled as described previously21). This cytosine-depleted approach improved downstream PCR amplification and decreased library generation costs compared to previous methylated adaptor attempts11. Reactions were incubated at 55°C for 20 minutes. All wells were then pooled and stained with DAPI as described for the first FANS sort. A second 96-well plate was prepared with each well containing digestion reagents as described by the manufacturer’s protocol for the EZ-96 DNA Methylation MagPrep Kit (Zymo, Cat. D5040) at one-fifth the volumes (for a total of 5 uL per well). 22 post-tagmentation nuclei from the pool of all reactions were sorted into each well using the single-cell sorting setting. Some wells were randomly selected to receive only 10 nuclei, to allow for unmethylated controls. The plate was then spun down at 600 × g for 5 minutes at 4°C.
Library preparation
Prior to bisulfite conversion, several wells, which only received 10 nuclei in the final sort, were spiked with ~35 pg of the prepared unmethylated control DNA, to keep DNA mass constant per well. Nuclei were then processed following manufacturer’s protocol for the EZ-96 DNA Methylation MagPrep Kit, with volumes reduced to one-fifth those described by the manufacturer to allow for single-well reaction processing, and other slight modifications. Following the final post-bisulfite library cleanup, each well was eluted in 25 uL of Zymo M-Elution Buffer and transferred to a well in a 96-well plate prepared with the following reaction mixture for linear amplification: 16 uL PCR-clean ddH2O, 5 uL 10X NEBuffer 2.1 (NEB, Cat. B7202), 2 uL 10 mM dNTP mix (NEB, Cat. N0447), and 2 uL of 10 uM random nonamer primer with a partial sequence of the Illumina Standard Read 2 sequencing primer (9NP, 3′-NNNNNNNNNAGATCGGAAGAGCACACGTCTG-5′). To render libraries single stranded prior to linear amplification, reactions were heat shocked at 95°C for 45 seconds and then flash cooled on ice. Following cooling, 10 U Klenow (3′->5′ exo-) polymerase (Enzymatics, Cat. P7010-LC-L), was added to each reaction, followed by incubation at 4°C for 5 minutes, then a slow ramp of +1 °C/15 seconds, and 37 °C for 90 minutes. This was repeated for 2–4 times dependent on library and in accordance with previously described scWGBS protocols (Supplementary Fig. 1)[3]. For each repetition, 1 uL 10 uM 9NP, 1 uL 10 mM dNTP mix, 1.25 4X NEBuffer 2.1, and 10 U Klenow (3′ -> 5′ exo-) polymerase was added after the heat shock and cooling. Following completion of linear amplifications, wells were cleaned with 1.1X (by volume) of 18% PEG SPRI Bead mixture (Sera-Mag SpeedBeads (GE, Cat. 65152105050250) washed and resuspended in 18% PEG 8000 (by mass), 1M NaCl, 10mMTris-HCl, pH 8.0, 1mM EDTA, 0.05% Tween-20), with a 5 minute room temperature incubation, then placed on a magnetic rack until the supernatant was cleared. The supernatant was discarded, and beads were washed with 80% ethanol while held in place by magnets. Beads were then dried and libraries were eluted in 21 uL 10 mM Tris-Cl (pH 8.5). The full 21 uL eluate was then placed into a 96-well plate prepared with a PCR reaction mixture containing 25 uL 2X KAPA HiFi HotStart ReadyMix (Kapa, Cat. KK2602), 2 uL each of 10 uM forward and 10 uM reverse uniquely indexed primers (each introducing a 10-nt indexing sequence), and 0.5 uL of 100X SYBR Green I (FMC BioProducts, Cat. FC-121-1031). Real time PCR was performed on a Bio-Rad CFX thermocycler with the following conditions: 95°C for 2 minutes, (94°C for 80 seconds, 65°C for 30 seconds, 72°C for 30 seconds [Image]) for 18-22 cycles. PCR was stopped once libraries reached the inflection point of measured SYBR green fluorescence. Following PCR, libraries were then pooled by column (10 uL/well) and with 0.8X (by volume) 18% PEG SPRI Bead Mixture as described previously. Libraries were eluted off the magnetic beads in 25 uL of 10 mM Tris-Cl (pH 8.5). A detailed step-by-step protocol can be found as Supplementary Note 2, associated with this manuscript.
Library quantification and sequencing
Libraries were pooled and quantified between the range of 200 bp and 1 kbp using a 2100 Bioanalyzer DNA High Sensitivity kit (Agilent, Cat. 5067-4626; Supplementary Fig. 13). Pools were sequenced on either an Illumina NextSeq 500®, HiSeq 1000®, HiSeq 2500® or HiSeq X®, loaded at 0.9 pM, with a 5%, 12%, or 30% PhiX spike-in to improve complexity for the HiSeq 2500®, HiSeq 1000® or HiSeqX®, and NextSeq 500®, respectively. All sequencing runs used a custom locked-nucleic acid (LNA) oligonucleotides for custom sequencing primers to match the standard chemistry temperatures (Supplemental Table 3). With the exception of the first GM12878-only library pool, libraries were sequenced with a custom sequencing chemistry protocol (Read 1: 100 imaged cycles; Index Read 1: 10 imaged cycles, 27 dark cycles, 11 imaged cycles; Index Read 2: 10 imaged cycles).
Sequence read processing
Reads were processed using bcl2fastq (Illumina Inc., v2.19.0) with the “–create-fastq-for-index-reads” and “–with-failed-reads” options to produce fastq files. Fastq reads were then identified by indexes, requiring each index (the two 10-nt indexes introduced by PCR, and the 11-nt index introduced by tagmentation) to independently be within a Hamming distance of two from the expected reference sequences. Reads with all three indexes assigned had the respective reference index sequences concatenated to a barcode and appended to the read name, which served as the barcode identifier. Reads were then trimmed using TrimGalore! (v0.4.0) with option “-a AGATCGGAAGAGC” to identify adapters. Trimmed reads were quality checked using FastQC (v0.11.3) for adapter content, percent base across reads for bisulfite conversion biases, and k-mer bias. Alignment to the human (GRCh37), mouse (GRCm38), or a combined human-mouse hybrid genome was performed with Bismark (v0.14.3) using “–bowtie2” and “–unmapped” options22. Aligned reads were then de-duplicated based on barcode, chromosome, and starting position.
GM12878-only library development
GM12878-only libraries were generated as described above with alterations/specifications as follows: library were generated using the LAND method for nucleosome depletion, libraries were generated using four rounds of linear amplification, and were sequenced in a paired-end manner. For the paired-end sequencing strategy the following custom sequencing chemistry protocol was used (Read 1: 50 imaged cycles; Index Read 1: 10 imaged cycles, 27 dark cycles, 11 imaged cycles; Index Read 2: 10 imaged cycles; Read 2: 50 imaged cycles). Sequencing reads were processed using slightly modified read processing pipeline. Trimming was performed with TrimGalore! using the “-paired” option, we observed biases at the start of both read 1 and read 2 sequences, likely due to the random priming strategy, and consequently trimmed the reads with options “–clip_R1 6”, “–clip_R2 9”. We aligned reads to the GRCh37 reference genome with Bismark with an added “-p” option for the paired-end alignment.
Human-mouse library development
Human (GM12878) and mouse (NIH/3T3) cell lines were mixed following nuclei isolation, but before nucleosome depletion in a roughly equal ratio. Nucleosomes were then depleted using the LAND technique and processed as described above. Reads were aligned to a hybrid human-mouse genome. To estimate barcode collision rate we identified putative single-cell libraries with < 90% of reads that aligned to a single species which represents approximately half of the total collision rate (Supplementary Fig. 4). We also generated a second human-mouse library using a mixture of human (HEK293) and mouse (NIH/3T3) cells which underwent xSDS nucleosome depletion. The human-mouse xSDS library was processed as described above (Fig. 1c).
Cell line discrimination library development
To assess the ability of sci-MET to separate out different cell types using a low-coverage, high-cell count approach, we selected three cell lines: GM12878 (a B-lymphoblastoid cell line), HEK293 (a kidney epithelial cell line), and GM05756 (primary inguinal fibroblast line). We prepared a sci-MET library using xSDS nucleosome depletion that included each cell line on their own in addition to a mix comprised of 40% GM12878, 40% GM05756, and 20% HEK293 where they were combined after nuclei isolation. We suspect that this ratio was dramatically altered due to the FANS gating that we performed which likely excluded the majority of the aneuploid HEK293 cells which are difficult to distinguish from euploid doublets (Supplementary Fig. 12). Furthermore, for the majority of wells in which the cell identity was known, the cells were GM129878, thus likely favoring the FANS gating to that cell’s profile. It is important to note that this challenge would persist for any method of single-cell profiling that requires single-cell sorting, such as all of the existing single-cell methylation assay platforms, and is an important item to consider. Libraries were processed as described above.
Mouse cortex library development
Mouse cortical samples were brought through the sci-MET protocol via xSDS as described above. Notably, we used a modified NIB (NIB-HEPES; described under “Sample Preparation and Nuclei Isolation”), which substituted the early use of Tris-HCl with HEPES, to avoid quenching formaldehyde during fixation. Three mouse cortical samples were processed in parallel prior to tagmentation, such that sample identity was maintained. Following this, all nuclei were pooled for downstream library generation. Downstream library construction was processed as described above. Mouse cortex libraries underwent the same quality control filters, omitting that which removed cell libraries with ≥5% nonCG methylation.
Single-cell discrimination by unique read count
We sought to use the unique aligned read count to stratify individual cells from noise (Supplementary Fig. 3). First we performed k-means clustering (k=3) based on the log10 number of unique aligned reads per barcode (the three indexes assigned to a read). We fit a normal distribution to the cluster containing the barcodes with the highest number of unique aligned reads. In case the cluster with the highest aligned reads contained multiple peaks due to low coverage (as in the GM12878-only prep) we used an alternative approach to fitting a normal distribution and fit mixed normal distributions to the clustered data. From the fit distributions, the threshold was then defined based on the 95% confidence interval (CI) of the fitted normal distribution with the highest number of unique reads (mean-(1.96 × SD)). We used the kmeans function in R (v. 3.4.2) for clustering and the MASS (v. 7.3-45) and mixtools (v. 1.1.0) packages for fitting the normal and mixed normal distributions.
Methylome Coverage Estimation
To provide an accurate measurement of CG dinucleotides covered by sci-MET, we collapsed CG measurements to a single haploid strand using Bismark (v.0.18.2) coverage2cytosine command using the “–merge_CpG” option. We used the recently reported Bismap15 tool to estimate uniquely mappable regions of the mm10 and hg19 reference genomes. Through this, we determined a total of 27,003,976 CG sites for the haploid hg19 reference and 19,788,681 CG sites for the haploid mm10 reference. These numbers were used for all CG coverage estimates (Supplementary Data 2–3).
Quality control
We assessed bisulfite conversion efficiency in our preparations through spike-in of unmethylated lambda phage DNA. We aligned fastq reads with the respective 11-nt tagmentation index to the lambda genome (GenBank: J02459.1) using Bismark. We de-duplicated reads, and filtered to high quality alignments (≥Q30). We observed a highly efficient bisulfite conversion across sci-MET library constructions (>99%; Supplementary Table 5).
Individual barcodes per library were assessed for mapping efficiency (calculated as aligned reads/fastq reads assigned to a barcode), and complexity (calculated as de-duplicated, aligned reads/aligned reads assigned to a barcode). Our protocol for library construction both increased the throughput of single-cell generation, and largely increased mapping efficiency compared to previous methods2–7. Barcodes were filtered by unique read cutoffs (described in “Single-cell discrimination”) and subsequently filtered. We required cells which met read threshold cutoff to have a mapping efficiency of ≥5%, a nonCG methylation of ≤ 5% for downstream clustering analysis. We further stratified our library pool to assess the effect of various rounds of linear amplification on single-cell library quality. We found that four rounds of linear amplification significantly increased mapping efficiency (p-value = 7.83 ×10⁻¹⁶, t= 8.27, Student’s two-sided t test; Supplementary Data 2). Transposase complexes showed differences in library construction efficiency (Supplementary Fig. 14). Alignment rates and coverage did not correlate strongly with percent methylation per cell (Supplementary Fig. 15).
To estimate average library saturation, we fit two-factor saturation curves to single-cell libraries within the human cell line mix experiment using the drc (v3.0-1) package’s drm function in R dependent on rounds of linear amplification. For three and four rounds of linear amplification, our projected upper asymptotes (full sequencing saturation) were 1.66 × 10⁶, and 2.51 × 10⁶, unique CGs per single-cell library, respectively (Fig 1e). All quality assessment data are reported as mean ± standard deviation where appropriate.
Individual cell saturation (Supplementary Fig. 5) was carried out by projecting the estimated unique read counts per cell to decreasing complexity increments as described previously11. We then calculated the expected CG percent coverage based on the linear relationship between the percent of CG sites covered by the unique read count (Supplementary Fig. 16).
Coverage bias across annotations
We calculated the coverage bias in individual cells across DHS, CG Islands, and Histone (H2AFZ, H3K27ac, H3K36me3, H3K4me1, H3K4me3, H3K4me3, H3K79me2, H3K9ac, H3K9me3, H4K20me1, H3K27me3) sites using annotated DNase, methylation profiling and CHIP-seq peak data from the publically available UCSC and ENCODE databases17,18. We used bedtools multicov (v. 2.22.0) to determine the coverage for each cell across all sites of each annotation bed file. We then determined the fraction of total reads per kilobase pair (kbp) by summing the coverage across all sites in a cell and normalizing by the reads per cell and by the sum of the genomic distance of the peak sites (Supplementary Fig. 17).
CG sites covered per N cells analyzed
We simulated the number of unique CG sites covered in an experiment by an arbitrary number of cells using sci-MET (human cell line experiment data) by performing 100 iterations of sampling of n=(10, 20, 30, 40, 50, 60, 70, 80, 90, 100, 150, 200,250, 300, 350, 400, 450, 500, 550, 600, 650) cells. We then calculated the aggregate number of unique CG sites covered across all cells for each sampling and fitted a lowess curve (using R package ggplot v.2.2.1) to the unique CG sites per n cells sampled saturation plot (Supplementary Fig. 18).
Non-negative Matrix Factorization, tSNE, and clustering
We quantified methylation rate across Ensembl Regulatory Build windows using a previously described method3. Non-negative Matrix Factorization (NMF) is a unsupervised data decomposition technique and was performed on the summarized windows. Here we used NMF to learn new feature representations23. NMF is mathematically approximated by: , where is the matrix representing the single-cell methylation profiles of n samples across m features. is a dictionary matrix with a much smaller k than m. is the activation coefficients on the new basis. All the three of them are non-negative. The column vectors in are called meta-feature, which are higher-level abstraction of the original methylation levels and each column in is meta-expression on the new basis of each sample. Here we set to get matrix factorized into low-rank matrix and . In this way, we extracted the uncorrelated basis and the coefficient matrix of the new basis by significantly reducing the dimension of the features. Since relatively few basis vectors are used to represent many data vectors (k<<m), good approximation can only be achieved if the basis vectors discover structure that is latent in the data, which will aid sample clustering and visualization. Then, given the learned feature representation, Student t-Distributed Stochastic Neighbor Embedding (t-SNE) package Rtsne (v.0.13) for R is used to plot the meta-expression matrix with default parameters. Clustering on the NMF-tSNE coordinates was performed using the Density Based Clustering of Applications with Noise (DBSCAN; v.1.1-1) with an epsilon value of 4 and a minimal cell seed threshold of four24. This process was performed for cells with ≥ 30,000 unique aligned reads (Fig. 2a). Clusters were assessed for read count and alignment rate bias, as well as validated through Y chromosome read count (Supplementary Fig. 19).
Methylation over genomic annotations
Methylation rates plotted over ChIP-seq and other genomic annotations were generated by aggregating the methylation fractions in percentile windows for 5,000 bp upstream of the feature, through the feature set, and 5,000 bp downstream of the feature and smoothed over three percentile window groups. Methylation rates were carried out for each individual cell as well as for the combination of cells of each specific sample type in the case of the human cell type mix experiment (Supplementary Fig. 20).
mCH Periodicity
Two approaches were undertaken to estimate the patterning of CH methylation. First, leveraging our read length (>70bp on average), we estimated the cis-mCH patterning. For all mCH measurements with both up- and downstream mCHs within the same read, we calculated the distance between the nearest mCH sites. This was performed with a custom Python script on the Bismark alignment file (v. 2.7.9). The minimal distance up or downstream of each mCH site was then plotted using ggplot2 geom_histogram function (v. 2.2.1) in R (v 3.4.2). Second, we assessed all CH measurements around annotated CTCF motif sites (described in more detail in methods section ‘Transcription Factor Methylation’) to act as a centering point for nucleosome position. We then normalized the annotated CTCF windows annotated previously25 and plotted both percent CH methylation using the R packages GenomicRanges (v. 1.28.4) and genomation (v.1.8.0; Supplementary Fig. 9).
Window summaries and correlations over Ensembl regulatory regions
Using ENCODE and Epigenome Roadmap bulk WGBS samples, we quantified a weighted methylation rate and variance across samples using the Ensembl Regulatory Build loci16. We next took the top 1000 most variable loci across the bulk samples and summarized methylation rates within single-cell clusters identified above. We performed a Pearson correlation of methylation rates with the bulk WGBS samples using base R cor function. Biclustering was performed using the R package gplots (v. 3.0.1) heatmap2 function (Supplementary Fig. 21).
Transcription Factor Methylation
Transcription factor motifs across the hg19 reference genome were taken from Homer25. All sites with a shared transcription factor motif were assumed to be co-regulated, as described4. CG sites per cell within the human cell line mix experiment were collapsed and summarized, using bedtools intersect and groupby commands (v2.22.0). Transcription factor annotations with less than 30 CG measurements were excluded on a per-cell basis. Transcription factor annotations with more than 20% of cells missing a value were excluded, leaving a final count of 237 annotations. The matrix was then clustered using tSNE with package Rtsne (v.0.13) in R (Supplementary Fig. 22). Additionally, a hierarchical biclustering approach using the R package ComplexHeatmap (v1.14.0) was used on the same cell X transcription factor matrix prior to Z-scoring, which failed to appropriately separate out cell types (Supplementary Fig. 23).
Non-binary CGs Methylation Analysis
To assess CG dinucleotide methylation variability, we collapsed all cells within the GM12878 cluster in the human cell line mix experiment. We defined CG sites with two or more measurements sourced from different cells as either binary (fully methylated or unmethylated across cells) or non-binary (differentially methylated across cells). We then calculated the enrichment of non-binary CG sites overlapping genomic features (chromatin marks, DNase hypersensitivity regions, CG islands) using bedtools intersect (v2.22.0). We compared this enrichment to binary CG sites, calculated in the same manner.
We observed a significant relative enrichment of non-binary sites in repressive marks (H3K27me3) and depletion in activating marks including DNase hypersensitivity regions and CG islands (Supplementary Fig. 24; Supplementary Data 4). We repeated this analysis on transcription factor motifs described above (Supplementary Fig. 25). Finally, we performed a Pearson’s chi-squared test for significance of these enrichments (R base function chisq.test; Supplementary Data 4). False discovery rate estimation was performed with R package qvalue (v.2.8.0).
Clustering of mouse cortex
NMF was performed as described above for CG methylation over the Ensembl Regulatory Build as well as for methylation in the CH context over 100 kbp windows. We then carried out tSNE and density-based clustering24 for each of these NMF matrixes independently and then an additional tSNE projection that included a combination of both NMF matrixes weighted equally to produce the projection presented in Fig. 2d and then an additional round of density-based clustering (Supplementary Fig. 10). The clusters for each case largely agreed with several exceptions where we decided to split the clusters in the joint CG and CH tSNE projection to provide increased granularity.
DMR methylation calculation for mouse cortical clusters
To identify rudimentary cell types within our low-coverage clustered mouse cortical samples, we collapsed all reads within a respective cluster to increase CG coverage. CG methylated and unmethylated counts which overlapped with neuronal DMRs described by Luo et al. 2017 were summed8. This was done with the bedtools intersect and groupby commands (v2.22.0). Percentage methylation of overlapping CG sites was calculated for each Luo et al.-defined neuronal subtype. The collapsed neuronal subtype DMR × cluster matrix was Z-scored using the base R scale function. This was then plotted with the R package ComplexHeatmap (v1.14.0) with default parameters (Fig. 2e).
A Life Sciences reporting summary is available
Data Availability
Publically available datasets used in this study were obtained from the ENCODE data portal with the following accessions: ENCFF039JFT, ENCFF092FNE, ENCFF103DNU, ENCFF110AZO, ENCFF121ZES, ENCFF122LEF, ENCFF157POM, ENCFF168HTX, ENCFF171ZRJ, ENCFF200MJQ, ENCFF210XTE, ENCFF215CKT, ENCFF216DJL, ENCFF241AQC, ENCFF247ILV, ENCFF256WDR, ENCFF257GGV, ENCFF186EKM, ENCFF517AOL, ENCFF545MIY, ENCFF266NGW, ENCFF279HCL, ENCFF315ZJB, ENCFF366UWF, ENCFF390OZB, ENCFF435SPL, ENCFF455TQO, ENCFF477AUC, ENCFF477GKI, ENCFF479QJK, ENCFF487XOB, ENCFF497YOO, ENCFF500DKA, ENCFF510EMT, ENCFF526PFA, ENCFF534RNT, ENCFF536RSX, ENCFF553HJV, ENCFF575GIN, ENCFF588IUK, ENCFF601NBW, ENCFF625GVK, ENCFF684JHX, ENCFF699GKH, ENCFF714SUO, ENCFF721JMB, ENCFF730NQT, ENCFF731IOY, ENCFF774GXJ, ENCFF795DNO, ENCFF831OYO, ENCFF835NTC, ENCFF837SXM, ENCFF847OWL, ENCFF867JRG, ENCFF874GGB, ENCFF913UZU, ENCFF918PML, ENCFF959WCA, ENCFF001SUN, ENCFF001SUL, ENCFF001SUG, ENCFF001SUD, ENCFF001SUJ, ENCFF001SUE, ENCFF001WYF, ENCFF001WYH, ENCFF001WYB, ENCFF001WYE, ENCFF001SUF, ENCFF001SUM, ENCFF001SUO, ENCFF001WYJ, ENCFF001WYK, ENCFF001SUI, ENCFF001SUP, ENCFF001SUQ, ENCFF741JQL, ENCFF549RWR, ENCFF323ZIV, ENCFF963GBQ, ENCFF800JNP, ENCFF001XDF, ENCFF639BKP, ENCFF363SIQ, ENCFF590RFP, ENCFF001WVZ, ENCFF001WWC, ENCFF001XHL, ENCFF001XHM, ENCFF001WWD, ENCFF001WWE, ENCFF001WWH, ENCFF001WWI, ENCFF523KSP, ENCFF066BAT, ENCFF825UAX, ENCFF765FCQ, ENCFF464QPC, ENCFF594VZB, ENCFF451UZW, ENCFF993MZN, ENCFF041SJL, ENCFF631QJF, ENCFF907IMB, ENCFF668WID, ENCFF050JWX, ENCFF418RFY, ENCFF483QXH, ENCFF301UTR, ENCFF019MRX, ENCFF715BRM, ENCFF367STH, ENCFF388TAT, ENCFF231GIV, ENCFF637XZK, ENCFF467BCP, ENCFF985WXP, ENCFF001VDK, ENCFF581RTT, ENCFF342JBJ, ENCFF037SXA, ENCFF422AIH, ENCFF001XCF, ENCFF001XCG, ENCFF127YXW, ENCFF498ERO, ENCFF781HLM, ENCFF046YRR. Data used in the mouse cortex analysis was obtained from NCBI GEO (GSE97179). Data produced for this study has been deposited to the Sequence Read Archive (SRA) and the Gene Expression Omnibus (GEO) under BioProject accession PRJNA397747 for unrestricted access.
Code Availability
Custom code used in analysis for this study is included as Supplementary Code.
Supplementary Material
Acknowledgments
We would like to thank Brooke DeRosa for culturing the primary fibroblast cell line for this project (Department of Molecular & Medical Genetics, Oregon Health & Science University, Portland, Oregon, USA). We would like to thank other members of the Adey Lab for helpful suggestions and dialogue pertaining to this work, particularly Sarah Vitak. We also thank Gail Mandel for providing the mice utilized in this study and for helpful discussion and comments on the manuscript (Vollum Institute, Oregon Health & Science University, Portland, Oregon, USA). J.R.S. is supported by the Rett Syndrome Research Trust. A.C.A. is supported by an R35 from NIGMS (1R35GM124704-01), and the Knight Cardiovascular Institute. B.J.O. is supported a fellowship from the Sloan Foundation.
Footnotes
We present a highly scalable assay for whole-genome methylation profiling of single cells. We use our approach, single-cell combinatorial indexing for methylation analysis (sci-MET), to produce 3,282 single-cell bisulfite sequencing libraries and achieve read alignment rates of 68 ± 8%. We apply sci-MET to discriminate the cellular identity of a mixture of three human cell lines and to identify excitatory and inhibitory neuronal populations from mouse cortical tissue.
Competing Interests Statement: D.P., S.N., and F.J.S. are all employees of Illumina Inc. F.J.S., D.P., S.N., A.C.A., R.M.M., and J.S. all have one or more patents pertaining to one or more aspects of the technologies described here.
Author Contributions: A.C.A. and R.M.M. conceived the sci-MET assay. R.M.M. carried out all sci-MET preparations with contributions from A.J.F. A.C.A., R.M.M., F.J.S., D.P., and S.N. designed the sci-MET adaptors and primers and reduced the assay to practice. R.M.M., F.J.S., D.P., and S.N. carried out all sequencing. R.M.M. led the data analysis. D.S. and Z.X. performed the NMF-tSNE analysis. K.A.T. provided additional analyses. J.R.S. performed mouse cortex dissection. F.J.S., J.S., C.T., and B.J.O. contributed to analysis design and edited the manuscript. A.C.A. supervised all aspects of the study. All authors approved the manuscript.
References
- 1.Varley KE, et al. Genome Res. 2013;23:555–567. doi: 10.1101/gr.147942.112. [DOI] [PMC free article] [PubMed] [Google Scholar]
- 2.Lister R, et al. Nature. 2009;462:315–22. doi: 10.1038/nature08514. [DOI] [PMC free article] [PubMed] [Google Scholar]
- 3.Smallwood S, et al. Nat Methods. 2014;11:817–20. doi: 10.1038/nmeth.3035. [DOI] [PMC free article] [PubMed] [Google Scholar]
- 4.Farlik M, et al. Cell Rep. 2015;10:1386–1397. doi: 10.1016/j.celrep.2015.02.001. [DOI] [PMC free article] [PubMed] [Google Scholar]
- 5.Farlik M, et al. Cell Stem Cell. 2016;19:808–822. doi: 10.1016/j.stem.2016.10.019. [DOI] [PMC free article] [PubMed] [Google Scholar]
- 6.Angermueller C, et al. Nat Methods. 2016;13:229–32. doi: 10.1038/nmeth.3728. [DOI] [PMC free article] [PubMed] [Google Scholar]
- 7.Clark SJ, et al. Nat Protoc. 2017;12:534–547. doi: 10.1038/nprot.2016.187. [DOI] [PubMed] [Google Scholar]
- 8.Luo C, et al. Science. 2017;357:600–604. doi: 10.1126/science.aan3351. [DOI] [PMC free article] [PubMed] [Google Scholar]
- 9.Amini S, et al. Nat Genet. 2014;46:1343–9. doi: 10.1038/ng.3119. [DOI] [PMC free article] [PubMed] [Google Scholar]
- 10.Adey A, et al. Genome Res. 2014;24:2041–2049. doi: 10.1101/gr.178319.114. [DOI] [PMC free article] [PubMed] [Google Scholar]
- 11.Vitak SA, et al. Nat Methods. 2017;14:302–308. doi: 10.1038/nmeth.4154. [DOI] [PMC free article] [PubMed] [Google Scholar]
- 12.Cao J, et al. Science (80-.) 2017;357:661–667. [Google Scholar]
- 13.Cusanovich D, et al. Science. 2015;348:910–4. doi: 10.1126/science.aab1601. [DOI] [PMC free article] [PubMed] [Google Scholar]
- 14.Adey A, et al. Genome Biol. 2010;11:R119. doi: 10.1186/gb-2010-11-12-r119. [DOI] [PMC free article] [PubMed] [Google Scholar]
- 15.Karimzadeh M, et al. bioRxiv. 2017 [Google Scholar]
- 16.Zerbino DR, et al. Genome Biol. 2015;16:56. doi: 10.1186/s13059-015-0621-5. [DOI] [PMC free article] [PubMed] [Google Scholar]
- 17.Roadmap Epigenomics Consortium. Nature. 2015;518:317–330. [Google Scholar]
- 18.The ENCODE Project Consortium. Nature. 2012;489:57–74. [Google Scholar]
- 19.Lister R, et al. Science. 2013;341:1237905. doi: 10.1126/science.1237905. [DOI] [PMC free article] [PubMed] [Google Scholar]
- 20.Guo JU, et al. Nat Neurosci. 2013;17:215–222. doi: 10.1038/nn.3607. [DOI] [PMC free article] [PubMed] [Google Scholar]
Online Methods Reference
- 21.Adey A, Shendure J. Genome Res. 2012;22:1139–1143. doi: 10.1101/gr.136242.111. [DOI] [PMC free article] [PubMed] [Google Scholar]
- 22.Krueger F, Andrews SR. Bioinformatics. 2011;27:1571–1572. doi: 10.1093/bioinformatics/btr167. [DOI] [PMC free article] [PubMed] [Google Scholar]
- 23.Lee D, Seung S. Nature. 1999;401:778. doi: 10.1038/44565. [DOI] [PubMed] [Google Scholar]
- 24.Ester M, et al. Proc 2nd Int Conf Knowl Discov Data Min. 1996:226–231. [Google Scholar]
- 25.Heinz S, et al. Mol Cell. 2010;4:576–589. doi: 10.1016/j.molcel.2010.05.004. [DOI] [PMC free article] [PubMed] [Google Scholar]
Associated Data
This section collects any data citations, data availability statements, or supplementary materials included in this article.
Supplementary Materials
Data Availability Statement
Publically available datasets used in this study were obtained from the ENCODE data portal with the following accessions: ENCFF039JFT, ENCFF092FNE, ENCFF103DNU, ENCFF110AZO, ENCFF121ZES, ENCFF122LEF, ENCFF157POM, ENCFF168HTX, ENCFF171ZRJ, ENCFF200MJQ, ENCFF210XTE, ENCFF215CKT, ENCFF216DJL, ENCFF241AQC, ENCFF247ILV, ENCFF256WDR, ENCFF257GGV, ENCFF186EKM, ENCFF517AOL, ENCFF545MIY, ENCFF266NGW, ENCFF279HCL, ENCFF315ZJB, ENCFF366UWF, ENCFF390OZB, ENCFF435SPL, ENCFF455TQO, ENCFF477AUC, ENCFF477GKI, ENCFF479QJK, ENCFF487XOB, ENCFF497YOO, ENCFF500DKA, ENCFF510EMT, ENCFF526PFA, ENCFF534RNT, ENCFF536RSX, ENCFF553HJV, ENCFF575GIN, ENCFF588IUK, ENCFF601NBW, ENCFF625GVK, ENCFF684JHX, ENCFF699GKH, ENCFF714SUO, ENCFF721JMB, ENCFF730NQT, ENCFF731IOY, ENCFF774GXJ, ENCFF795DNO, ENCFF831OYO, ENCFF835NTC, ENCFF837SXM, ENCFF847OWL, ENCFF867JRG, ENCFF874GGB, ENCFF913UZU, ENCFF918PML, ENCFF959WCA, ENCFF001SUN, ENCFF001SUL, ENCFF001SUG, ENCFF001SUD, ENCFF001SUJ, ENCFF001SUE, ENCFF001WYF, ENCFF001WYH, ENCFF001WYB, ENCFF001WYE, ENCFF001SUF, ENCFF001SUM, ENCFF001SUO, ENCFF001WYJ, ENCFF001WYK, ENCFF001SUI, ENCFF001SUP, ENCFF001SUQ, ENCFF741JQL, ENCFF549RWR, ENCFF323ZIV, ENCFF963GBQ, ENCFF800JNP, ENCFF001XDF, ENCFF639BKP, ENCFF363SIQ, ENCFF590RFP, ENCFF001WVZ, ENCFF001WWC, ENCFF001XHL, ENCFF001XHM, ENCFF001WWD, ENCFF001WWE, ENCFF001WWH, ENCFF001WWI, ENCFF523KSP, ENCFF066BAT, ENCFF825UAX, ENCFF765FCQ, ENCFF464QPC, ENCFF594VZB, ENCFF451UZW, ENCFF993MZN, ENCFF041SJL, ENCFF631QJF, ENCFF907IMB, ENCFF668WID, ENCFF050JWX, ENCFF418RFY, ENCFF483QXH, ENCFF301UTR, ENCFF019MRX, ENCFF715BRM, ENCFF367STH, ENCFF388TAT, ENCFF231GIV, ENCFF637XZK, ENCFF467BCP, ENCFF985WXP, ENCFF001VDK, ENCFF581RTT, ENCFF342JBJ, ENCFF037SXA, ENCFF422AIH, ENCFF001XCF, ENCFF001XCG, ENCFF127YXW, ENCFF498ERO, ENCFF781HLM, ENCFF046YRR. Data used in the mouse cortex analysis was obtained from NCBI GEO (GSE97179). Data produced for this study has been deposited to the Sequence Read Archive (SRA) and the Gene Expression Omnibus (GEO) under BioProject accession PRJNA397747 for unrestricted access.