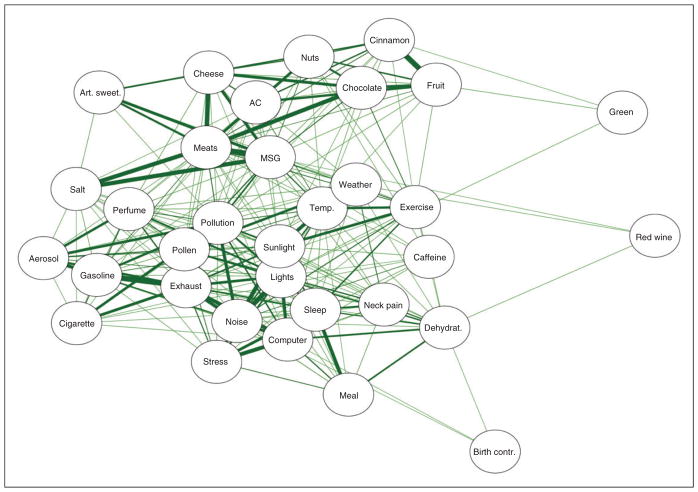
Figure 3.
A network plot illustrating trigger potency beliefs. Each trigger is a node (circle) with the strength of the relationships between the triggers represented by the size of the line (edge). Only statistically-significant associations between triggers are drawn with a line (after adjustment for multiplicity). Triggers connected by lines are perceived to have similar potency in causing a headache attack.

