Abstract
Sarcopenia is the age-related decrease of muscle mass and function. Diabetes and obesity are known to be risk factors that exacerbate sarcopenia, but the underlying mechanism of diabetes-related sarcopenia is still unknown. Obese type 2 diabetes SDT fatty rats show early onset of severe diabetes and there have been no reports on the characteristics of their skeletal muscle. Therefore, pathophysiological analyses were performed for the skeletal muscle in these rats. Diabetic male SDT fatty rats were sacrificed at 8, 16, 24, 32 and 40 weeks of age. Age-matched Sprague Dawley (SD) rats were used as the normal control. In addition to biological blood parameters, the soleus and the extensor digitorum longus muscles were examined for muscle weight, histopathology, and protein synthesis and degradation. Muscle grip strength was also examined. These results revealed that the muscle weights of the SDT fatty rats were significantly decreased from 16 weeks of age. The mean cross-sectional area of muscle fibers in the SDT fatty rats decreased from 24 weeks of age. Increased intramyocellular lipid accumulation, identified by immunohistochemistry for adipophilin and TEM, was observed in the SDT fatty rats from 8 weeks of age. Plasma insulin-like growth factor (IGF)-1 levels and muscle strength in the SDT fatty rats decreased at 24 weeks of age and thereafter. These pathophysiological findings have been reported both in sarcopenia in aged humans and in patients with diabetes. In conclusion, the SDT fatty rat was considered to be a useful model for analysis of diabetes-related sarcopenia.
Keywords: diabetes, sarcopenia, SDT fatty rat, skeletal muscle
Introduction
Sarcopenia is characterized by the age-related loss (atrophy) of muscle mass and strength in humans1, and is associated with increased risks of falls and fractures, immobility, disabilities, metabolic disorders, poor quality of life and mortality2. Approximately 10% of elderly persons over 60 years of age have low muscle mass, with the prevalence increasing to as high as 50% in persons over the age of 80 years3, 4. Normal aging is associated with an approximately 1% loss of muscle from 30 years of age and the loss tends to accelerate after the age of 70 years5. Worldwide, the population aged over 60 years is predicted to rise from 841 million in 2013 to more than 2 billion by 20506, therefore, sarcopenia will become an increasingly important public health concern, especially in a “super-aging society” such as Japan. The increased interest in sarcopenia is clearly seen by the increasing number of reports on sarcopenia published in recent years7.
The etiology of age-related sarcopenia has been reported to be multifactorial and includes aging, disease, inflammation, increased oxidative stress, reduced physical activity, malnutrition, hormone deficiencies, muscle structural changes, and motor unit remodeling8. There is a lack of specific therapeutic approaches except for nutrition and physical activity, which often lead to only limited benefit9. Loss of muscle proteins, resulting from an imbalance between protein synthesis and breakdown, appears to be a contributing factor to sarcopenia8.
“Primary sarcopenia” is defined as being age related1. “Secondary sarcopenia” is one of sarcopenia induced by factors other than aging itself 1. Secondary sarcopenia can be further divided into 1) activity-related, 2) disease-related and 3) nutrition-related1. Primary sarcopenia is generally an inevitable consequence of aging. On the other hand, secondary sarcopenia can be reversible by treating the underlying condition. Aging is associated with an increase in prevalence of diabetes. In older adults, type 2 diabetes is associated with accelerated loss of leg muscle strength and quality10. Oxidative stress, mitochondrial dysfunction, subclinical inflammation and insulin resistance are considered to be possible factors in development of both sarcopenia and diabetes9, 10, 11. The mechanism of diabetes-related sarcopenia has not been fully clarified due to the complexity of multiple factors; however, it shares the same factors in terms of progression as age-related sarcopenia11, 12. Therefore, it is useful to elucidate the mechanism of sarcopenia associated with metabolic disorders including diabetes for the better understanding of sarcopenia with aging13.
There have been many reports of diabetes animal models investigating the relationship between diabetes and skeletal muscle14, 15, 16, 17. Muscle atrophy in type 1 diabetes has been well investigated using streptozotocin (STZ)-induced rodent models. STZ-induced diabetes animals show rapid muscle atrophy with muscle proteasomal protein degradation17. Muscle atrophy in type 2 diabetic rodent models is less consistent in terms of changes in muscle mass between animal models. Several type 2 diabetic rodent models exhibit no change or mild decreases in muscle size (high-fat diet model, muscle insulin receptor knockout mice, insulin receptor substrate (IRS)-1 knockout mice)18, 19, whereas several models demonstrate severely reduced muscle size (leptin deficient mice (ob/ob), leptin receptor deficient mice (db/db), muscle specific IRS-1/IRS-2 knockout mice, obese Zucker rats)20, 21. The most detailed rodent studies of type 2 diabetic muscle atrophy have focused on the ob/ob and db/db mouse models. In the study of db/db mice, insulin resistance accelerated muscle protein degradation by activation of the ubiquitin-proteasome pathway via defects in muscle cell signaling21.
The Spontaneously Diabetic Torii (SDT) fatty rat, established by introducing the fa allele of the Zucker fatty rat into the SDT rat genome, is a model of obesity/type 2 diabetes22. SDT fatty rats show hyperglycemia as early as 6 weeks of age and survive without insulin therapy23. Therefore, they develop various diabetic complications including nephropathy, retinopathy and peripheral neuropathy23, 24, 25, 26. On the other hand, there have been no reports of the pathophysiology of the skeletal muscle in the SDT fatty rat. As SDT fatty rats have severe metabolic disorders including hyperglycemia and hyperlipidemia, they were expected to show pathological changes in the skeletal muscle associated with diabetes. In the present study, we investigated the pathophysiological characteristics of the skeletal muscle of the SDT fatty rats in the progression of metabolic disorders. Muscle weight, cross-sectional muscle fiber area, intramyocellular lipid, muscular strength, and muscle protein synthesis and degradation markers were chronologically examined in SDT fatty rats.
Materials and Methods
Animals
Thirty male SDT fatty (SDT.Cg-Leprfa/JttJcl) rats (n=6/group/age) and 25 age-matched Sprague Dawley (SD:Jcl) rats (n=5/group/age) were purchased from CLEA Japan, Inc. (Tokyo, Japan). Five or 6 animals in each strain were used for examination of biochemical parameters and necropsy/tissue sampling at 8, 16, 24, 32 and 40 weeks of age. SD rats were used as normal control animals. SD rats are considered to be appropriate normal control animals for studies of SDT fatty rats because SDT fatty rats were established from SDT rats, which represent an inbred strain of SD rat. There have been several reports of SDT fatty rats using SD rats as the normal control animal. The rats were housed in a climate-controlled room with a temperature of 23 ± 3°C, humidity of 55 ± 15%, and a 12-h lighting cycle. A basal diet (CRF-1, Charles River Laboratories Japan, Yokohama, Japan) and water were provided ad libitum. All animal protocols used in the study were in strict compliance with our own Laboratory Guidelines for Animal Experimentation and were approved by the Institutional Animal Care and Use Committee of Central Pharmaceutical Research Institute, Japan Tobacco Inc.
Body weight and biochemical parameters
Body weights and biochemical parameters including serum glucose, triglyceride (TG), total cholesterol (TC), insulin and plasma insulin-like growth factor (IGF)-1 were examined from 8 to 40 weeks of age at 4-week intervals in the non-fasting state. All the parameters were obtained from animals in each age group (n=5 or 6). Blood samples were collected from the tail vein of animals. Serum glucose, TG and TC levels were measured using commercial kits (Roche Diagnostics, Basel, Switzerland) and an automatic analyzer (Hitachi 7180, Hitachi, Tokyo, Japan). Serum insulin levels were measured with a rat insulin ELISA kit (Morinaga Institute of Biological Science, Yokohama, Japan). Plasma IGF-1 levels were measured with a Mouse/Rat IGF-I Quantikine ELISA Kit (Bio-Techne Ltd., Abingdon, UK).
Tissue sampling, skeletal muscle weight and pathological analyses
Necropsy was performed at 8, 16, 24, 32 and 40 weeks of age. All the animals were sacrificed by exsanguination under isoflurane anesthesia. Soleus and extensor digitorum longus (EDL) muscles were removed from hindlimbs and weighted. The soleus and EDL were chosen as a slow-twitch type I fiber muscle and fast-twitch type II fiber muscle, respectively, because they are commonly used for research of skeletal muscle in rodents. Muscle mass was evaluated by the muscle weight. The muscle tissues were frozen in isopentane cooled in liquid nitrogen for cryosections for histochemistry, fixed with 4% paraformaldehyde (PFA) for hematoxylin and eosin staining and immunohistochemistry or fixed with 1.25% glutaraldehyde/2% PFA for transmission electron microscopy. Frozen tissues were stored at −80°C until processed.
Morphometric analysis by histochemistry for NADH-TR
The frozen sections were incubated for the nicotinamide adenine dinucleotide-tetrazolium reductase (NADH-TR) assay. NADH-TR is the mitochondrial enzyme NADH-dehydrogenase which transfers electrons to the colorless, soluble tetrazolium salt and converts it into an insoluble formazan compound. In this reaction, the intermyofibrillar matrix is stained and fiber types (I and II) can be distinguished. Classification of the cross-sectional fiber types was performed according to the staining intensities of NADH-TR. Dark fibers with NADH-TR were identified as type I fibers and pale/light fibers with NADH-TR were identified as type IIb fibers. Type IIa fibers were also observed with an intermediate level of intensity with NADH-TR but were not estimated in this study. Cross-sectional areas (shown in μm2) of the soleus (mainly composed of type I fiber) and the type I and type IIb fibers in the EDL were measured for 50 fibers/animals and compared with those of SD rats. For morphometric analysis, tissue images were obtained at ×400 using the cellSens Standard imaging software (Olympus, Tokyo, Japan).
Immunohistochemistry for adipophilin
Immunohistochemical staining was performed for detection of intramyocellular lipid (IMCL) by using anti-adipophilin antibody (BP5012, Acris Antibodies Inc., Herford, Germany). Four-micrometer paraffin-embedded tissue sections were immersed in Hist VT One (10x, pH 7.0) (Nacalai Tesque, Inc., Kyoto, Japan) and microwaved at 170 W for 10 min to retrieve antigens. All slides were rinsed with 0.01 M phosphate buffered saline. The primary antibody (diluted 1:100 in 1% bovine serum albumin (BSA) in PBS) was labeled by using the secondary antibody conjugated with horseradish peroxidase (106-005-003, Goat Anti-Guinea Pig IgG, Jackson ImmunoResearch, Inc., Jennersville, PA, USA). The reaction products were visualized with 3,3′-diaminobenzidine tetrahydrochloride. A negative (1% BSA in PBS) control was also set.
Transmission electron microscopy
Tissue specimens of the skeletal muscles from SDT fatty rats at 40 weeks of age were postfixed in phosphate buffered 2% osmic acid, dehydrated in a series of alcohol solutions and embedded in resin in accordance with the Quetol embedding method. Resin-embedded semi-thin sections stained with toluidine blue were prepared and were examined microscopically in order to determine the areas for ultrathin sectioning. Ultrathin sections stained with uranyl acetate and lead acetate were photographed by a transmission electron microscopy (H-7700 electron microscope, Hitachi High-Technologies Corp., Tokyo, Japan) and were examined ultrastructurally.
Quantification of mRNA Atrogin-1 and Murf-1 of muscle tissues with real-time quantitative PCR
Total RNA was extracted from the EDL muscles of all the animals for each age at necropsy. RNA was transcribed into cDNA using M-MLV reverse transcriptase and random primers (Invitrogen, Carlsbad, CA, USA). The reaction mixture was incubated for 10 min at 25°C, 1 h at 37°C and 5 min at 95°C. Real-time PCR quantification was performed in a 25-μl reaction mixture with an automated sequence detector combined with the ABI Prism 7700 Sequence Detection System software (Applied Biosystems, Foster City, CA, USA). The reaction mixture contained 100 ng of synthesized cDNA, 3.5 mM MgCl2, 0.3 μM primers, 0.1 μM probes and 1.25 units of AmpliTaq Gold (Life Technologies, Carlsbad, CA, USA). The cycle parameters were 10 min at 95°C, followed by 40 cycles of 15 sec at 95°C and 60 sec at 60°C. Expression was normalized by an endogenous control (β-actin). Primer and probe sets for Atrogin-1 (ID: Rn00590197_m1), Murf-1 (ID: Rn00591730_m1), and β-actin (ID: 4352341E) were obtained from Applied Biosystems (Foster City, CA, USA).
Forelimb grip strength test for muscle strength
The forelimb grip strength test is a commonly used method for evaluating of muscle strength in experimental animals27. In this study, an additional examination of muscle strength was conducted using a Grip Strength Meter (GPM-100B, Melquest, Toyama, Japan) to evaluate muscle function of SDT fatty rats. This examination was not planned in the original protocol; therefore, additional animals were prepared separate from the main experimental group. From a perspective of animal welfare, the measurement points were set only at 8, 24 and 40 weeks of age (n=5–6/age group). Similarly, age-matched SD rats were also prepared as a normal control (n=5/age group).
Statistical analysis
The results of the biological parameters were expressed as the mean ± standard deviation (SD). Statistical analysis of differences between mean values was performed using the F-test, followed by Student’s t-test or Aspin-Welch’s t-test. Differences were considered significant at P<0.05.
Results
Body weights and biochemical parameters
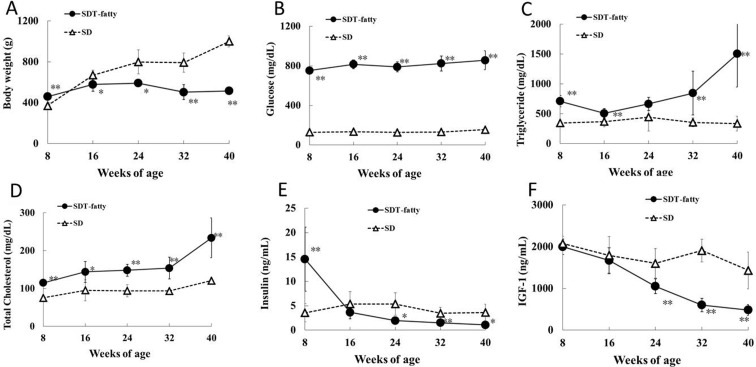
SD rats showed age-dependent increases in body weight up to 40 weeks of age. In SDT fatty rats, the mean body weight was 23% higher than that of SD rats at 8 weeks of age, but was lower than that of SD rats from 16 weeks of age thereafter (Fig. 1A). At the end of the experimental period, the mean body weight of the SDT fatty rats was approximately half that of the SD rats. Serum glucose, TG and TC levels in the SDT fatty rats were already significantly higher than those in the SD rats at 8 weeks of age (Fig. 1B–D). Serum insulin levels of SDT fatty rats were markedly higher at 8 weeks of age and were sharply decreased from 16 weeks of age (Fig. 1E). Plasma IGF-1 levels were comparable between SDT fatty and SD rats up to 16 weeks of age. IGF-1 levels in the SDT fatty rats were significantly decreased at 24 weeks of age and thereafter (Fig. 1F). The IGF-1 levels in the SDT fatty rats decreased by approximately 50% from 8 weeks of age to 24 and by approximately 75% from 8 weeks of age to 40 weeks of age, respectively. Impaired glucose/lipid metabolism of SDT fatty rats is associated with hyperphagia via an induced disorder of leptin action. Food consumption of male SDT fatty rats was twice as high as that of control rats at 6 weeks of age and higher food intake was consistent until 32 weeks of age 23. Similarly in this study, hyperphagia was observed in SDT fatty rats compared with SD rats from 8 weeks of age (data not shown).
Fig. 1.
Body weight and biochemical parameters. Body weight (A), serum glucose (B), triglyceride (C), total cholesterol (D), insulin (E) and plasma IGF-1 (F) levels. *p<0.05 (t-test); **p<0.01 (t-test).
Skeletal muscle weight (muscle mass)
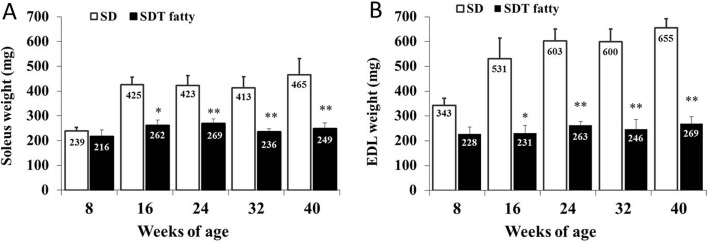
Muscle weights of the soleus and EDL were significantly lower in the SDT fatty rats than those in the SD rats from 16 weeks of age (Fig. 2). Muscle weights (absolute/relative (per BW)) of SDT fatty rats at 16 weeks of age were 39.4%/29.7% lower in the soleus and 57.5%/50.6% lower in the EDL than those of SD rats. SD rats showed age-dependent increases in the weights of both muscles (approximately 2 times higher) between 8 and 40 weeks of age. On the other hand, the weights of both muscles in SDT fatty rats were almost constant from 8 weeks to 40 weeks of age.
Fig. 2.
Weights of skeletal muscles. Soleus weight (A) and EDL weight (B). *p<0.05 (t-test); **p<0.01 (t-test).
Cross-sectional area of muscle fibers
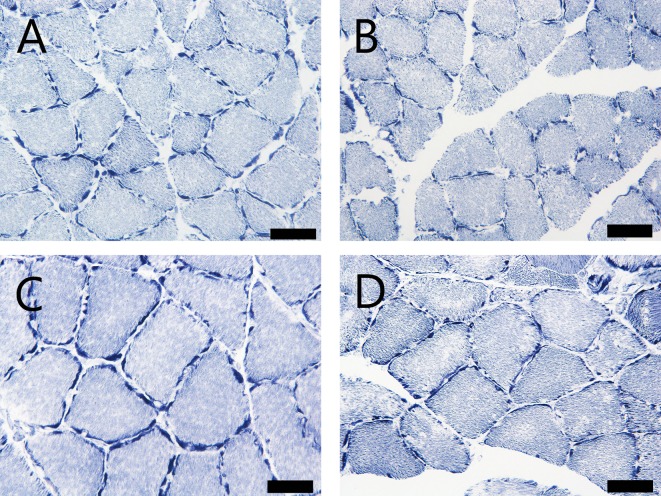
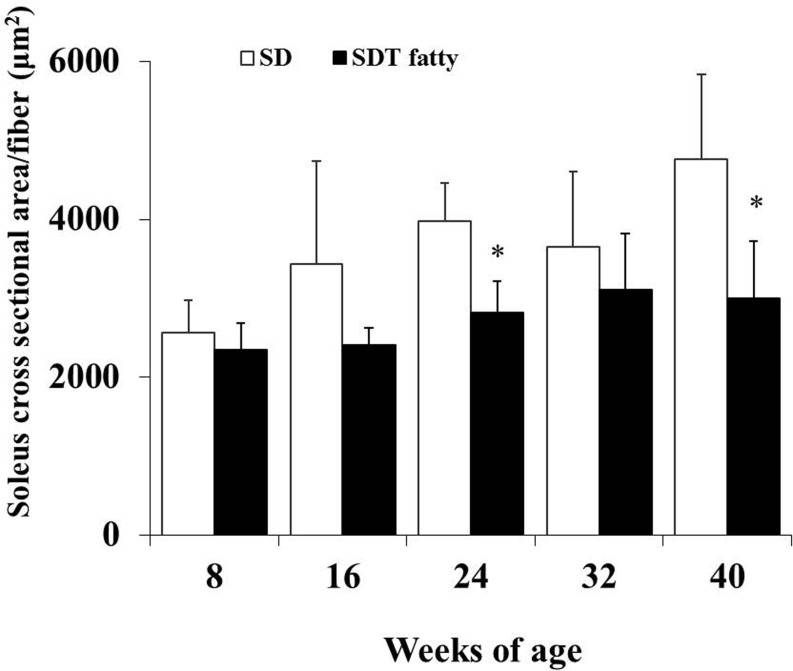
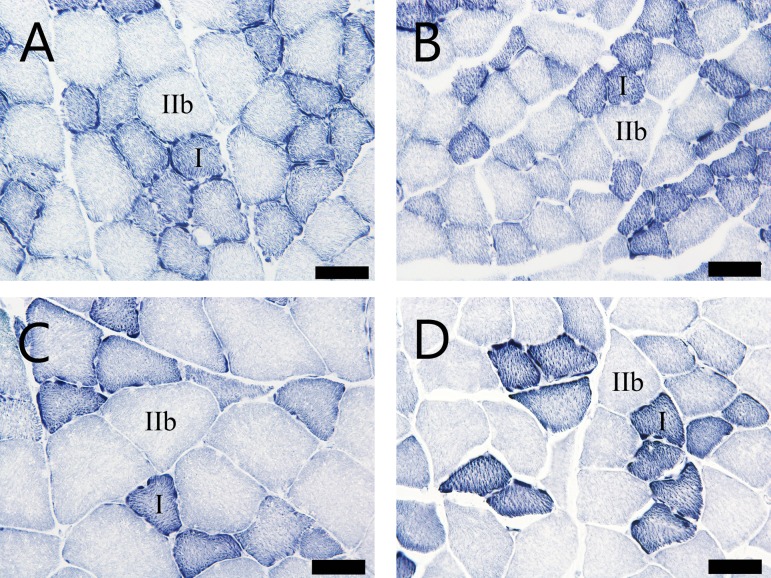
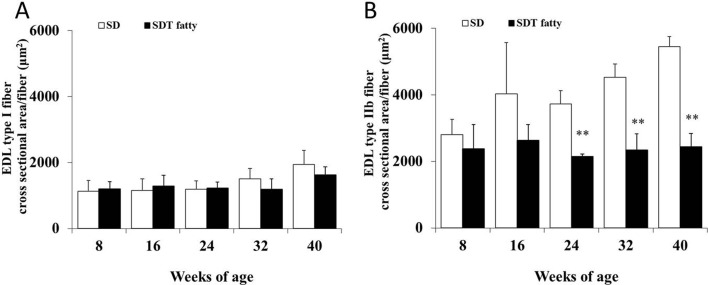
Morphometrical analysis of the histochemistry for NADH-TR revealed that the cross-sectional area of the skeletal muscle fibers of the SDT fatty rats was significantly lower than that of the SD rats from 24 weeks of age (Fig. 3, 4, 5, 6 ). The mean cross-sectional areas of the soleus muscle fibers (mainly composed of type I fiber) of the SDT fatty rats were 8.9%, 30.0%, 29.4%, 15.2% and 37.2% lower than those of the SD rats at 8, 16, 24, 32 and 40 weeks of age, respectively (Fig. 4). There were no statistically significant differences in the mean cross-sectional area of the type I fibers in the EDL between SDT fatty and SD rats at each age (Fig. 6A). On the contrary, the mean cross-sectional areas of the type IIb fibers in the EDL of the SDT fatty rats were 15.4%, 34.6%, 42.3%, 48.2% and 55.3% lower than those of SD rats at 8, 16, 24, 32 and 40 weeks of age, respectively (Fig. 6B).
Fig. 3.
Cross section of soleus muscle with histochemistry for NADH-TR. (A) and (C): SD rats at 8 and 40 weeks of age, respectively. (B) and (D): SDT fatty rats at 8 and 40 weeks of age, respectively. Bar = 50 μm. NADH-TR.
Fig. 4.
Morphometric analysis of cross-sectional fiber area in the soleus by histochemistry for NADH-TR. The mean cross-sectional area of the soleus muscle fibers (predominantly type I fibers). *p<0.05 (t-test).
Fig. 5.
Cross section of EDL muscle with histochemistry for NADH-TR. (A) and (C): SD rats at 8 and 40 weeks of age, respectively. (B) and (D): SDT fatty rats at 8 and 40 weeks of age, respectively. Bar = 50 μm. NADH-TR.
Fig. 6.
Morphometric analysis of cross-sectional fiber area in the EDL by histochemistry for NADH-TR. Mean cross-sectional area of the type I fibers (A) and type IIb fibers (B). **p<0.01 (t-test).
Intramyocellular lipid (IMCL) droplet accumulation and disrupted mitochondria
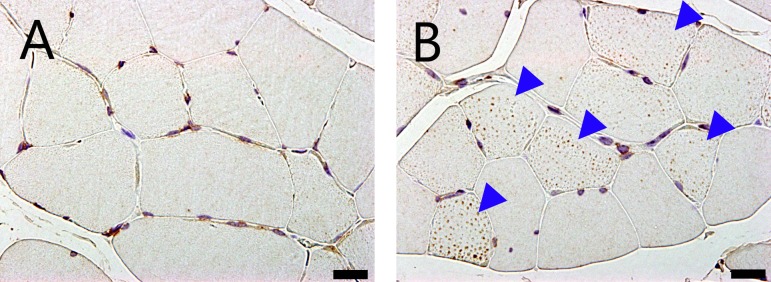
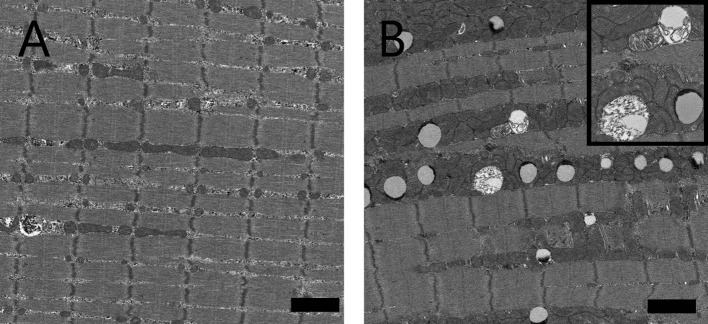
Small vacuoles in the muscle fibers were increased in the soleus and EDL in the SDT fatty rats compared with the SD rats from 8 weeks of age. These vacuoles were identified as lipid droplets by immunohistochemistry for adipophilin, a marker of lipid protein (Fig. 7). The numbers of muscle fibers containing vacuoles were increased in the SDT fatty rats on adipophilin immunohistochemistry. Intramuscular vacuoles were also observed in the SD rats but there were fewer numbers compared with in the SDT fatty rats. In longitudinal sections seen on electron microscopy, lipid droplets were characterized by low electron dense bodies located mainly close to intermyofibrillar mitochondria (Fig. 8). There were some mitochondria showing disrupted internal structures.
Fig. 7.
Micrographs of a cross section of EDL muscle with immunohistochemistry for adipophilin of an SD rat (A) and SDT fatty rat (B) at 40 weeks of age. Increased numbers of adipophilin-positive granules in the muscle fibers were observed in SDT fatty rats (arrowheads). Bar = 20 μm.
Fig. 8.
Longitudinal electron micrographs of the EDL muscle of an SD rat (A) and SDT fatty rat (B) at 40 weeks of age. There were many intramyocellular lipid droplets between myofibrils closely adherent to mitochondria. Inset: high-power magnification of lipid droplets and intermyofibrillar mitochondria with disrupted internal structures. Bar = 2 μm.
mRNA levels of Atrogin-1 and Murf-1 in skeletal muscle
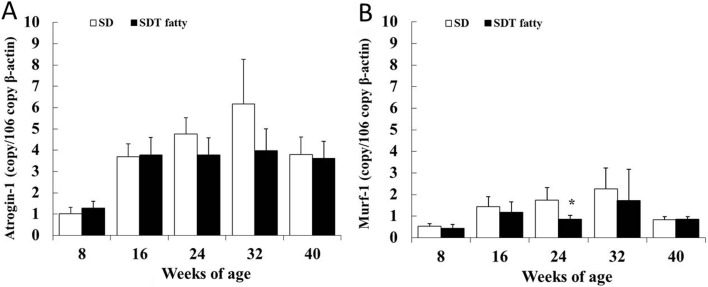
Messenger RNA levels of Atrogin-1 and Murf-1 in the EDL were examined for analysis of the protein degradation (Fig. 9). In this study, these proteolysis markers did not increase in SDT fatty rats at any of the ages examined. On the contrary, a significant decrease in Murf-1 mRNA levels was observed in the SDT fatty rats at 24 weeks of age (Fig. 9B).
Fig. 9.
mRNA expression of Atrogin-1 (A) and Murf-1 (B) in EDL muscle. *p<0.05 (t-test).
Muscle strength (forelimb grip strength test)
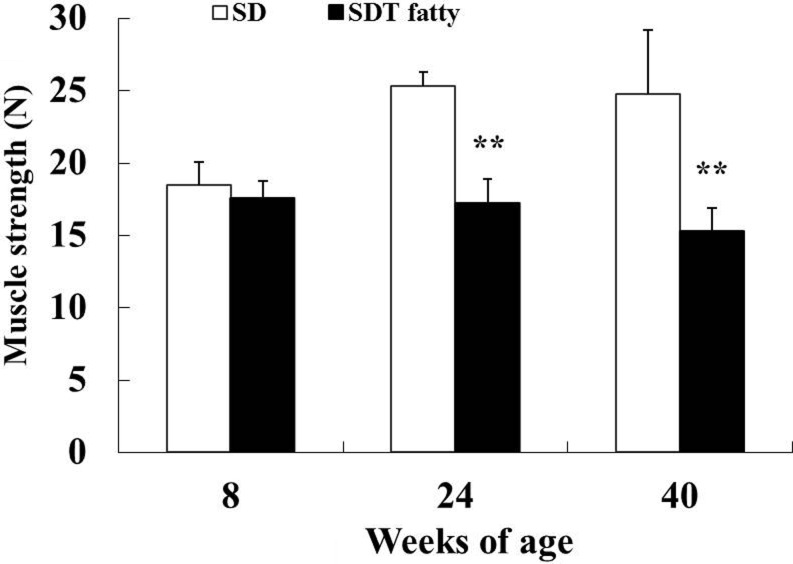
There were no differences in mean score for the grip strength test between SD rats and SDT fatty rats at 8 weeks of age. Significant decreases in muscle strength were observed in the SDT fatty rats at 24 and 40 weeks of age (Fig. 10). The mean scores for the muscle strength test in the SDT fatty rats were 32% and 38% lower at 24 and 40 weeks of age, respectively, compared with those of the SD rats.
Fig. 10.
Muscle strength (forelimb grip test). **p<0.01 (t-test).
Discussion
Sarcopenia in humans is known to be a progressive loss of muscle mass and strength1. It can be divided into “primary” and “secondary” sarcopenia. The term “primary” can be used when no other cause is evident except ageing itself, while “secondary” can be used when one or more other causes are evident 1. In normal rats, approximately 20 months of age is required for spontaneously occurring muscle atrophy28, therefore, it takes a great deal of time to investigate the mechanism of sarcopenia using normal animals. In the secondary sarcopenia, many chronic diseases can cause accelerated decrease of muscle mass and strength11. Older diabetic patients have lower muscle masses and weaker muscle strength10. Aging and diabetes are both risk factors for functional disability and are thought to share common underlying mechanisms of muscle atrophy11, 12. Therefore, it is considered to be important to elucidate the pathophysiology of secondary sarcopenia to better understand its mechanism and to detect the therapeutic target of diseases including primary sarcopenia as well as secondary sarcopenia.
The SDT fatty rat is an established model of obese type 2 diabetes mellitus. Serum glucose levels in SDT fatty rats are elevated from 6 weeks, and lipid parameters including serum triglyceride and total cholesterol levels are elevated from 4 weeks of age23. The male SDT fatty rats showed hyperinsulinemia from 4 to 8 weeks of age, but after 16 weeks insulin levels decreased to levels similar to those of lean rats23. The results for the biological parameters in this study were in accordance with previously published reports for SDT fatty rats23. Despite their higher body weights due to obesity and insulin resistance at 8 weeks of age (+23% vs SD rats), SDT fatty rats displayed lower muscle weights (−10% for the soleus and −34% for the EDL). The lower muscle weights in SDT fatty rats from 16 weeks of age corresponded with a smaller mean cross-sectional muscle fiber area compared with SD rats. In addition to lower muscle weights and fiber area, decreased plasma IGF-1 and muscle strength were also observed in SDT fatty rats at 24 weeks of age and thereafter compared with SD rats.
Skeletal muscle greatly contributes to glucose consumption, so insulin resistance in skeletal muscle results in systemic metabolic disturbance12. Type 2 diabetes-related metabolic disorders are further exacerbated by the marked loss of skeletal muscle mass28. Therefore, sarcopenia might be associated with increased insulin resistance in skeletal muscle28. A large number of reports on the physiology of skeletal muscle in humans with diabetes and experimental animal models revealed that skeletal muscle atrophy was associated with diabetes11, 14. SDT fatty rats developed marked hyperglycemia and impaired insulin sensitivity from a younger age, which was considered to negatively affect the development of the skeletal muscle.
Muscles are composed of different types of muscle cells (myofibers) that are classified as slow-twitch (type I) and fast-twitch (type II) fibers according to the mode of metabolism29. Slow-twitch fibers use aerobic (oxidative phosphorylation) respiration, whereas fast-twitch fibers utilize anaerobic metabolism (glycolysis)29. In age-related sarcopenia, the atrophy of glycolytic type IIb muscle fibers (relevant to insulin resistance) is more predominant than the loss of type I muscle fibers30. On the other hand, oxidative type I fibers are more commonly lost in obese individuals31. In this study, SDT fatty rats showed lower cross-sectional areas of soleus and EDL muscle fibers than those of SD rats. The magnitude of the decline in fiber size was larger in the EDL than that in the soleus, with type IIb fibers especially contributing to the difference. This tendency to decreased cross-sectional area of the muscle fibers in SDT fatty rats was similar to age-related sarcopenia.
The Insulin-IGF signaling pathway is known to be pivotal to skeletal muscle growth and maintenance9. Insulin increases protein anabolism and inhibits proteolysis in skeletal muscle. It has been reported that insulin treatment increases the skeletal muscle fiber area in patients with type 2 diabetes32. IGF-1 promotes protein synthesis and cell proliferation9. IGF-1 is reported to contribute to muscle regeneration via activation of the muscle satellite cells33. Previous research revealed that a 33% decrease in circulating IGF-1 and a 45% decline in skeletal muscle-derived IGF-1 mRNA are observed in older human males without particular serious disease (around 70 years of age) compared with younger (around 20 years of age) human males34. It was reported that serum IGF-1 was decreased in patients with diabetes and diabetic animals35, 36. SDT fatty rats showed hyperinsulinemia at 8 weeks of age; however, insulin levels sharply decreased from 16 weeks of age. Similarly, plasma IGF-1 levels markedly decreased from 24 weeks of age. An impaired insulin-IGF-1 signaling pathway is considered to contribute to lower muscle growth in SDT fatty rats.
Generally, normal testosterone levels are necessary for a range of developmental and biological processes, including maintenance of muscle mass37. Decreased testosterone levels are associated with progressive sarcopenia37. Plasma testosterone levels in male SDT fatty rats were reported to be lower as compared with those in SD rats at 8 and 24 weeks of age38. Decreased hormonal levels including not only IGF-1 levels but also blood testosterone levels might contribute to lower growth of skeletal muscles in SDT fatty rats.
IMCL droplets were identified in the SDT fatty rats by immunohistochemistry for adipophilin and electron microscopy. It has been reported that IMCL droplets were associated with increased insulin resistance in skeletal muscle fibers28. Adipophilin is essential for lipid storage in skeletal muscle by enhancing the division of excess fatty acids toward triglycerol storage in lipid droplets, leading to lipotoxicity-associated insulin resistance39. Furthermore, adipophilin expression also strongly correlates with decreased IGF-1 expression39. Therefore, the increase in IMCL droplets in the present study was considered to be related to the skeletal muscle loss of the SDT fatty rats. TEM examination also revealed disrupted internal structures of intermyofibrillar mitochondria in the skeletal muscles in SDT fatty rats. Mitochondria play an important role in regulation of glucose/insulin metabolism and maintenance of skeletal muscle quality12. Impaired mitochondrial function has been reported to underlie the development and progression of both sarcopenia and type 2 diabetes12. The abnormal morphological change of mitochondria noted in the skeletal muscle in SDT fatty rats was indicative of mitochondrial dysfunction and could possibly be associated with muscle atrophy leading to decreased muscle strength.
Atrogin-1 and Murf-1 are E3 ubiquitin ligases expressed in skeletal muscle and induce proteolysis40. It has been reported that both mRNA levels were increased when muscle atrophy occurred40. Increased expressions of both of these proteolysis markers were considered to be one of the factors of the muscle loss. It has also been reported that increased protein degradation in skeletal muscle was observed in obese Zucker rats with muscle loss15. In the present study, there were no significant increases in Atrogin-1 and Murf-1 mRNA levels in skeletal muscle (EDL) of the SDT fatty rats at any of the ages. On the contrary, Murf-1 mRNA levels in the EDL of SDT fatty rats were significantly decreased at 24 weeks of age. The decrease in Murf-1 gene expression was considered to be an adaptive response after severe decrease in protein synthesis factors including serum insulin and plasma IGF-1 at around 16 to 24 weeks of age. Impaired protein synthesis shown as a decreased IGF-1 level was considered to be more contributing to muscle atrophy in SDT fatty rats than proteolysis of skeletal muscle.
In humans, muscle strength is one of the important indicators of sarcopenia1 and decreases with age, particularly in the lower body and to a greater degree than a decrease in muscle mass41. Decreased handgrip strength has consistently been linked with poor health outcomes41 and has also been reported to be associated with type 2 diabetes and to be related to the severity of diabetes peripheral neuropathy11. Decreased muscle strength was observed in SDT fatty rats at 24 weeks of age in the forelimb grip test. Another study showed that SDT fatty rats had functional and pathological abnormalities in somatic and autonomic nerves by 16 weeks of age26. Decreased muscle strength in SDT fatty rats is possibly associated with decreased muscle weight (mass) and diabetic peripheral neuropathy.
This study is the first report of skeletal muscle pathology in SDT fatty rats. SDT fatty rats showed severe metabolic disorders including hyperglycemia and hyperlipidemia at a younger age than other diabetic rat models and was accompanied by decreases in muscle weight, muscle strength, muscle fiber area and a protein synthesis hormone (IGF-1), an increase in IMCL droplets and abnormal mitochondrial morphology. These results suggested that the sarcopenia secondary to impaired glucose/lipid metabolism was observed in the skeletal muscle of the SDT fatty rats. There have been few reports of comprehensive pathophysiological analyses of the skeletal muscle using diabetic rodent models. In conclusion, the SDT fatty rat is considered to be a useful model for analysis of diabetes-related sarcopenia. Details of changes in muscle fiber type proportion, mitochondrial oxidative activity and regenerative potential in skeletal muscle in SDT fatty rats have yet to be investigated. Further investigation of skeletal muscle in the SDT fatty rat is needed.
Disclosure of Potential Conflicts of Interest
The authors declare that they have no conflicts of interest to disclose in connection with this report.
Acknowledgments
We thank Mr. Toshihide Yamashiro, Ms. Yuki Yamashiro and Ms. Mizuyo Sasaki for their excellent technical assistance in preparation for histopathology.
References
- 1.Cruz-Jentoft AJ, Baeyens JP, Bauer JM, Boirie Y, Cederholm T, Landi F, Martin FC, Michel JP, Rolland Y, Schneider SM, Topinková E, Vandewoude M, Zamboni M. European Working Group on Sarcopenia in Older People Sarcopenia: European consensus on definition and diagnosis: report of the European working group on sarcopenia in older people. Age Ageing. 39: 412–423. 2010. [DOI] [PMC free article] [PubMed] [Google Scholar]
- 2.Cawthon PM, Marshall LM, Michael Y, Dam TT, Ensrud KE, Barrett-Connor E, Orwoll ES. Osteoporotic Fractures in Men Research Group Frailty in older men: prevalence, progression, and relationship with mortality. J Am Geriatr Soc. 55: 1216–1223. 2007. [DOI] [PubMed] [Google Scholar]
- 3.von Haehling S, Morley JE, and Anker SD. An overview of sarcopenia: facts and numbers on prevalence and clinical impact. J Cachexia Sarcopenia Muscle. 1: 129–133. 2010. [DOI] [PMC free article] [PubMed] [Google Scholar]
- 4.Morley JE. Sarcopenia in the elderly. Fam Pract. 29(Suppl 1): i44–i48. 2012. [DOI] [PubMed] [Google Scholar]
- 5.Kim TN, and Choi KM. Sarcopenia: definition, epidemiology, and pathophysiology. J Bone Metab. 20: 1–10. 2013. [DOI] [PMC free article] [PubMed] [Google Scholar]
- 6.United Nations, Department of Economic and Social Affairs, Population Division World Population Ageing 2013, from United Nations website: http://www.un.org/en/development/desa/population/publications/pdf/ageing/WorldPopulationAgeing2013.pdf.
- 7.Morley JE, Anker SD, and von Haehling S. Prevalence, incidence, and clinical impact of sarcopenia: facts, numbers, and epidemiology-update 2014. J Cachexia Sarcopenia Muscle. 5: 253–259. 2014. [DOI] [PMC free article] [PubMed] [Google Scholar]
- 8.Ali S, and Garcia JM. Sarcopenia, cachexia and aging: diagnosis, mechanisms and therapeutic options - a mini-review. Gerontology. 60: 294–305. 2014. [DOI] [PMC free article] [PubMed] [Google Scholar]
- 9.Pani G, Cavallucci V, and Bartoccioni E. Age-related sarcopenia: diabetes of the muscle? J Clin Molecular Endocrinol. 1: 29 2016. [Google Scholar]
- 10.Park SW, Goodpaster BH, Strotmeyer ES, Kuller LH, Broudeau R, Kammerer C, de Rekeneire N, Harris TB, Schwartz AV, Tylavsky FA, Cho YW, Newman AB. Health, Aging, and Body Composition Study Accelerated loss of skeletal muscle strength in older adults with type 2 diabetes: the health, aging, and body composition study. Diabetes Care. 30: 1507–1512. 2007. [DOI] [PubMed] [Google Scholar]
- 11.Kalyani RR, Corriere M, and Ferrucci L. Age-related and disease-related muscle loss: the effect of diabetes, obesity, and other diseases. Lancet Diabetes Endocrinol. 2: 819–829. 2014. [DOI] [PMC free article] [PubMed] [Google Scholar]
- 12.Buford TW, Anton SD, Judge AR, Marzetti E, Wohlgemuth SE, Carter CS, Leeuwenburgh C, Pahor M, and Manini TM. Models of accelerated sarcopenia: critical pieces for solving the puzzle of age-related muscle atrophy. Ageing Res Rev. 9: 369–383. 2010. [DOI] [PMC free article] [PubMed] [Google Scholar]
- 13.Sugimoto K, and Rakugi H. [Transdisciplinary Approach for Sarcopenia. The application of life style diseases-animal models to the research for sarcopenia]. Clin Calcium. 24: 1479–1486. 2014; (in Japanese). [PubMed] [Google Scholar]
- 14.Ozaki K, Matsuura T, and Narama I. Histochemical and morphometrical analysis of skeletal muscle in spontaneous diabetic WBN/Kob rat. Acta Neuropathol. 102: 264–270. 2001. [DOI] [PubMed] [Google Scholar]
- 15.Argilés JM, Busquets S, Alvarez B, and López-Soriano FJ. Mechanism for the increased skeletal muscle protein degradation in the obese Zucker rat. J Nutr Biochem. 10: 244–248. 1999. [DOI] [PubMed] [Google Scholar]
- 16.Aughsteen AA, Khair AM, and Suleiman AA. Quantitative morphometric study of the skeletal muscles of normal and streptozotocin-diabetic rats. JOP. 7: 382–389. 2006. [PubMed] [Google Scholar]
- 17.Pepato MT, Migliorini RH, Goldberg AL, and Kettelhut IC. Role of different proteolytic pathways in degradation of muscle protein from streptozotocin-diabetic rats. Am J Physiol. 271: E340–E347. 1996. [DOI] [PubMed] [Google Scholar]
- 18.Sitnick M, Bodine SC, and Rutledge JC. Chronic high fat feeding attenuates load-induced hypertrophy in mice. J Physiol. 587: 5753–5765. 2009. [DOI] [PMC free article] [PubMed] [Google Scholar]
- 19.Long YC, Cheng Z, Copps KD, and White MF. Insulin receptor substrates Irs1 and Irs2 coordinate skeletal muscle growth and metabolism via the Akt and AMPK pathways. Mol Cell Biol. 31: 430–441. 2011. [DOI] [PMC free article] [PubMed] [Google Scholar]
- 20.Kemp JG, Blazev R, Stephenson DG, and Stephenson GMM. Morphological and biochemical alterations of skeletal muscles from the genetically obese (ob/ob) mouse. Int J Obes. 33: 831–841. 2009. [DOI] [PubMed] [Google Scholar]
- 21.Wang X, Hu Z, Hu J, Du J, and Mitch WE. Insulin resistance accelerates muscle protein degradation: Activation of the ubiquitin-proteasome pathway by defects in muscle cell signaling. Endocrinology. 147: 4160–4168. 2006. [DOI] [PubMed] [Google Scholar]
- 22.Masuyama T, Katsuda Y, and Shinohara M. A novel model of obesity-related diabetes: introgression of the Lepr(fa) allele of the Zucker fatty rat into nonobese Spontaneously Diabetic Torii (SDT) rats. Exp Anim. 54: 13–20. 2005. [DOI] [PubMed] [Google Scholar]
- 23.Matsui K, Ohta T, Oda T, Sasase T, Ueda N, Miyajima K, Masuyama T, Shinohara M, and Matsushita M. Diabetes-associated complications in Spontaneously Diabetic Torii fatty rats. Exp Anim. 57: 111–121. 2008. [DOI] [PubMed] [Google Scholar]
- 24.Katsuda Y, Ohta T, Miyajima K, Kemmochi Y, Sasase T, Tong B, Shinohara M, and Yamada T. Diabetic complications in obese type 2 diabetic rat models. Exp Anim. 63: 121–132. 2014. [DOI] [PMC free article] [PubMed] [Google Scholar]
- 25.Kemmochi Y, Fukui K, Maki M, Kimura S, Ishii Y, Sasase T, Miyajima K, and Ohta T. Metabolic disorders and diabetic complications in spontaneously diabetic Torii Leprfa rat: a new obese type 2 diabetic model. J Diabetes Res. 2013: 948257 2013. [DOI] [PMC free article] [PubMed] [Google Scholar]
- 26.Maekawa T, Tadaki H, Sasase T, Motohashi Y, Miyajima K, Ohta T, and Kume S. Pathophysiological profiles of SDT fatty rats, a potential new diabetic peripheral neuropathy model. J Pharmacol Toxicol Methods. 88: 160–166. 2017. [DOI] [PubMed] [Google Scholar]
- 27.Meyer OA, Tilson HA, Byrd WC, and Riley MT. A method for the routine assessment of fore- and hindlimb grip strength of rats and mice. Neurobehav Toxicol. 1: 233–236. 1979. [PubMed] [Google Scholar]
- 28.Cleasby ME, Jamieson PM, and Atherton PJ. Insulin resistance and sarcopenia: mechanistic links between common co-morbidities. J Endocrinol. 229: R67–R81. 2016. [DOI] [PubMed] [Google Scholar]
- 29.Schiaffino S, and Reggiani C. Fiber types in mammalian skeletal muscles. Physiol Rev. 91: 1447–1531. 2011. [DOI] [PubMed] [Google Scholar]
- 30.Marzetti E, Lees HA, Wohlgemuth SE, and Leeuwenburgh C. Sarcopenia of aging: underlying cellular mechanisms and protection by calorie restriction. Biofactors. 35: 28–35. 2009. [DOI] [PMC free article] [PubMed] [Google Scholar]
- 31.Hickey MS, Carey JO, Azevedo JL, Houmard JA, Pories WJ, Israel RG, and Dohm GL. Skeletal muscle fiber composition is related to adiposity and in vitro glucose transport rate in humans. Am J Physiol. 268: E453–E457. 1995. [DOI] [PubMed] [Google Scholar]
- 32.Cederholm T, Sylvén C, Esbjörnsson-Liljedahl M, and Jansson E. Insulin treatment increases skeletal muscle fibre area in patients with diabetes mellitus type 2. Clin Physiol. 20: 354–359. 2000. [DOI] [PubMed] [Google Scholar]
- 33.Alway SE, Myers MJ, and Mohamed JS. Regulation of satellite cell function in sarcopenia. Front Aging Neurosci. 6: 246 2014. [DOI] [PMC free article] [PubMed] [Google Scholar]
- 34.Benbassat CA, Maki KC, and Unterman TG. Circulating levels of insulin-like growth factor (IGF) binding protein-1 and -3 in aging men: relationships to insulin, glucose, IGF, and dehydroepiandrosterone sulfate levels and anthropometric measures. J Clin Endocrinol Metab. 82: 1484–1491. 1997. [DOI] [PubMed] [Google Scholar]
- 35.Kim MS, and Lee DY. Insulin-like growth factor (IGF)-I and IGF binding proteins axis in diabetes mellitus. Ann Pediatr Endocrinol Metab. 20: 69–73. 2015. [DOI] [PMC free article] [PubMed] [Google Scholar]
- 36.Han HJ, Kang CW, and Park SH. Tissue-specific regulation of insulin-like growth factors and insulin-like growth factor binding proteins in male diabetic rats in vivo and in vitro. Clin Exp Pharmacol Physiol. 33: 1172–1179. 2006. [DOI] [PubMed] [Google Scholar]
- 37.Basualto-Alarcón C, Varela D, Duran J, Maass R, and Estrada M. Sarcopenia and androgens: a link between pathology and treatment. Front Endocrinol (Lausanne). 5: 217 2014. [DOI] [PMC free article] [PubMed] [Google Scholar]
- 38.Ohta T, Katsuda Y, Miyajima K, Sasase T, Kimura S, Tong B, and Yamada T. Gender differences in metabolic disorders and related diseases in Spontaneously Diabetic Torii-Lepr(fa) rats. J Diabetes Res. 2014: 841957 2014. [DOI] [PMC free article] [PubMed] [Google Scholar]
- 39.Conte M, Vasuri F, Trisolino G, Bellavista E, Santoro A, Degiovanni A, Martucci E, D’Errico-Grigioni A, Caporossi D, Capri M, Maier AB, Seynnes O, Barberi L, Musarò A, Narici MV, Franceschi C, and Salvioli S. Increased Plin2 expression in human skeletal muscle is associated with sarcopenia and muscle weakness. PLoS One. 8: e73709 2013. [DOI] [PMC free article] [PubMed] [Google Scholar]
- 40.Gumucio JP, and Mendias CL. Atrogin-1, MuRF-1, and sarcopenia. Endocrine. 43: 12–21. 2013. [DOI] [PMC free article] [PubMed] [Google Scholar]
- 41.Newman AB, Kupelian V, Visser M, Simonsick E, Goodpaster B, Nevitt M, Kritchevsky SB, Tylavsky FA, Rubin SM, Harris TB. Health ABC Study Investigators Sarcopenia: alternative definitions and associations with lower extremity function. J Am Geriatr Soc. 51: 1602–1609. 2003. [DOI] [PubMed] [Google Scholar]


