

Abstract
Clinical and experimental research have suggested that dyslipidemia aggravates diabetic peripheral neuropathy (DPN). However, whether dyslipidemia is a risk factor for DPN remains unclear. To investigate the effect of dyslipidemia on DPN, morphological features of peripheral nerves were analyzed in diabetic rats treated with a high-fat diet (HFD). Male rats were divided into four groups: nondiabetic rats (N), alloxan-induced diabetic rats (AL), diabetic rats treated with an HFD (AH), and nondiabetic rats treated with an HFD (HF). Combined hyperglycemia and dyslipidemia (AH group) induced a significant increase in plasma triglyceride and cholesterol levels. In addition, the combined effects contributed to a reduction in myelin size and a reduction in myelin thickness as indicated on sensory sural nerve histograms. There was also a reduction in the size of motor nerve axons when compared with the effects of hyperglycemia or dyslipidemia alone. However, the sensory nerve conduction velocity in the AH group was slightly but not significantly lower than those in the HF and AL groups. These results suggest that combined hyperglycemia and dyslipidemia induced mild peripheral motor and sensory nerve lesions, without significantly affecting sensory nerve conduction velocity.
Keywords: diabetes, dyslipidemia, neuropathy, rat
Introduction
Peripheral neuropathy is one of the major complications of diabetes mellitus. Although its exact pathogenesis is not fully understood, the duration of hyperglycemia, poor glycemic control, and hypertension affect the development of neuropathy1, 2. Dyslipidemia, including hypertriglyceridemia and/or hypercholesterolemia, and increased body mass index, also play an important role in the development of diabetic peripheral neuropathy3. Dyslipidemia may be recognized as an independent risk factor for the development of neuropathy in patients with diabetes4. Data from the U.K. Prospective Diabetes Study Group and the Fenofibrate Intervention and Event Lowering in Diabetes Study indicate that lipid-lowering therapy reduced the incidence of microvascular complications including neuropathy5. In diabetic animals, db/db mice and Zucker diabetic fatty (ZDF) rats developed dyslipidemia and peripheral nerve function abnormality as well as hyperglycemia6, 7, 8. The db/db mice also developed structural abnormalities in the peripheral nerves such as decreased intraepidermal nerve fiber density (IENFD) and reduced myelin thickness of the sciatic nerve7.
Dyslipidemia alone is also an essential factor underlying nerve injury, as indicated by prospective studies in patients with idiopathic neuropathy9, 10. In animal studies, high-fat diet (HFD)-fed mice and leptin-deficient ob/ob mice developed dyslipidemia, showed decreased nerve conduction velocity, and developed sensory deficits7, 11, 12, 13. However, apolipoprotein knockout mice with dyslipidemia lacked neuropathy6. Studies on peripheral nerve structural changes have shown contradictory results, with studies showing no abnormality6, 11, decreased IENFD12, 13, and a decrease in the myelin sheath thickness of the sciatic nerve7. As the data from animal experiments show some discrepancies, the potential effects of dyslipidemia on the peripheral nerves needs to be further analyzed using other animal models.
Human diabetic peripheral neuropathy (DPN) is characterized by nerve fiber loss, axonal degeneration, and segmental demyelination with a decrease in nerve conduction velocity1. Many diabetic animal models have been used to examine the pathogenesis of neuropathy. Importantly, an alloxan-treated rodent model developed rapid and severe hyperglycemia, showed a decrease in nerve conduction velocity, and developed mild axonal atrophy, although overt degenerative neuropathy, demyelination, or fiber loss in the peripheral nerves was not observed14, 15. Male Wistar Bonn Kobori (WBN/Kob) rats, which showed endocrine insufficiency due to chronic pancreatitis, spontaneously developed long-lasting hyperglycemia and severe diabetic peripheral motor neuropathy characterized by segmental demyelination and axonal atrophy with a decrease in nerve conduction velocity16, 17, 18. Furthermore, endoneurial microangiopathic changes have been observed in male rats of this strain. Insulin treatment corrected these changes without microangiopathy19. Therefore, it is likely that WBN/Kob rats will be useful for detecting morphological changes in peripheral nerves accompanied by hyperglycemia. However, as male WBN/Kob rats do not show hyperglycemia and glucosuria until approximately 40 weeks of age, diabetogenic treatment may be necessary to induce a diabetic condition from an early age.
The aim of the present study was to investigate the effect of superimposed hyperglycemia and dyslipidemia on peripheral nerve morphology in alloxan-induced diabetic WBN/Kob rats treated with an HFD.
Materials and Methods
Animals and housing conditions
Male WBN/Kob rats were supplied by Japan SLC, Inc. (Hamamatsu, Japan). The animals were housed in stainless steel cages at a temperature of 20–26°C and a relative humidity of 40–70% under a 12/12 h light/dark cycle. They were ventilated with filtrated fresh air and allowed free access to tap water and to a widely used standard pelletized diet for experimental rats (Charles River Formula 1, Oriental Yeast, Tokyo, Japan). The animals were handled according to the principles for all experimental procedures, contained in the Guide for the Care and Use of Laboratory Animals, prepared by the institution where the study was conducted (Setsunan University) and the Japanese Association for Laboratory Animal Science. The Committee for Animal Experiments of Setsunan University approved the study.
Experimental design
A total of 38 male WBN/Kob rats were divided into the following four groups at 10 weeks of age: the nondiabetic rats (N), alloxan-induced diabetic rats (AL), diabetic rats treated with an HFD (AH), and nondiabetic rats treated with an HFD (HF) groups. The 20 rats in the AL and AH groups, aged 10 weeks, were administered a single dose of alloxan (Sigma-Aldrich Japan, Tokyo, Japan) via the tail vein at a dose of 40 mg/kg body weight. The concentrations were set to measure the rat’s survival time after developing signs of diabetes and to determine the dose required to induce continuous glycosuria. From 13 weeks of age, rats in the AH group received an HFD (HFD-60, crude fat: 35%, Oriental Yeast, Tokyo, Japan). The 10 nondiabetic rats in the HF group also received an HFD from 13 weeks of age. The 8 nondiabetic rats in the N group also received a standard pellet diet. One rat from the AH group was necropsied during the examination period. The cause of death was unclear. Thirty-seven rats were sacrificed at 36 weeks of age.
Blood glucose, triglyceride, and cholesterol concentrations
Blood glucose, triglyceride, and cholesterol concentrations were measured monthly from 10 weeks of age until the autopsy. Blood samples from the tail vein were collected between 1:00 pm and 4:00 pm. Blood glucose levels were measured semiquantitatively by using the glucose oxidase method (Glutest E, Sanwa Kagaku, Nagoya, Japan). Plasma was separated by centrifugation. Concentrations of total, low-density lipoprotein (LDL), and high-density lipoprotein (HDL) cholesterol and triglycerides were measured by using an enzymatic method.
Urinary glucose, protein, and albumin
Urinary glucose, protein, and albumin were measured monthly from 10 weeks of age to 36 weeks of age. Rats were housed in metabolic cages, and 3 hourly urine samples were used for the measurement of urinary parameters. Urinary glucose levels were measured semiquantitatively with urine test paper (Wako Pure Chemical Industries, Osaka, Japan). The concentrations of urinary protein and albumin were measured by turbidimetric immunoassay.
Blood pressure monitoring
Blood pressure was measured monthly from 10 weeks of age by the tail-cuff method using a noninvasive blood pressure monitor for mice and rats (MK-2000, Muromachi Kikai Co. Ltd., Tokyo, Japan) according to the manufacturer’s instructions as previously reported2. Five consecutive measurements were averaged, and the mean value was calculated.
Motor and sensory nerve conduction velocity (MNCV and SNCV).
At the end of the experiment, MNCV and SNCV were measured after the rats were anesthetized with ketamine (40 mg/kg IM; Ketalar, Sankyo, Tokyo, Japan) and xylazine (2.0 mg/kg IM; Seractal, Bayer, Tokyo, Japan). For MNCV, the right sciatic nerve was exposed by incisions at the regions of the great trochanter and ankle, and the distance between incisions was measured as previously reported19. Bipolar stimulating electrodes were placed on the nerves through the incisions, and bipolar recording electrodes were inserted percutaneously into either the interossei or lumbrical muscles. The SNCV was determined by stimulating the sural nerve distally at the ankle via bipolar electrodes with supramaximal stimulation and recording at the fourth and fifth digit. The conduction velocity was recorded using an electromyography system (Polygraph 360 System, Nippon Denki Sanei, Tokyo, Japan, and BioSignal Processing Program, Nihon Santeku, Osaka, Japan). The conduction velocity was calculated using the onset latency and distance. The hind limb skin temperature was maintained at 37°C.
Histological and immunohistochemical analysis of peripheral nerves
The rats were euthanized by exsanguination from the abdominal aorta under deep anesthesia with ketamine (40 mg/kg IM; Ketalar, Sankyo) and xylazine (2.0 mg/kg IM; Seractal, Bayer). The right sciatic, tibial, and sural nerves were removed and fixed by immersing them in 4% paraformaldehyde in 0.1 M sodium phosphate buffer (pH 7.4). Three samples were trimmed, dehydrated in an automated processor, and embedded in paraffin. Sections (4 µm thick) were stained with hematoxylin and eosin (HE), Luxol fast blue, and Masson’s trichrome and analyzed morphologically. The left sciatic, tibial, and sural nerves were removed and fixed by immersing them in 2.5% glutaraldehyde in 0.1 M sodium phosphate buffer (pH 7.4). After fixation, tissue samples were postfixed in 1.5% osmium tetroxide solution (pH 7.4) for 2 hours and processed into epoxy resin. Semi-thin (1 μm) sections were cut and stained with toluidine blue.
Morphometric analysis of peripheral nerves
For morphometric analysis, semi-thin cross sections of the distal portion of the tibial and sural nerves were used, with one section of each nerve used per animal, as previously reported2. For tibial nerve samples, a terminal portion of the tibial nerve approximately 5 mm long from just proximal to the branching of the lateral and medial planter nerve was used. For sural nerve samples, a terminal portion of the sural nerve approximately 5 mm long from just proximal to the terminal branching was used. Digital images (20× objective lens, 3900 × 3090 pixels) were captured using a digital camera (DC500, Leica Microsystems, Wetzlar, Germany) attached to a light microscope (DM5500, Leica Microsystems). The sections were analyzed morphometrically by image processing and analysis software (IP Lab version 4.0, BD Biosciences, Rockville, MD, USA). The following morphometric parameters were analyzed: 1) the total fascicular area; 2) the numbers and sizes (cross-sectional area) of myelinated nerve fibers, myelin, and axons; and 3) and the mean fiber, axon, and myelin size (cross-sectional area). Fiber occupancy (nerve fiber area/fascicular area) was calculated by dividing the total area of myelinated fibers by the total fascicular area. Fiber density (number of fibers/mm2) was calculated by dividing the total number of myelinated fibers by the total fascicular area. Histograms for the size frequency of nerve fibers, axons, and myelin, separated into class intervals increasing by 10 μm2, were constructed.
Intraepidermal nerve fiber density (IENFD)
Foot pads were collected from the plantar surface of the hind paw and were fixed by immersing them in 4% paraformaldehyde in a 0.1 M sodium phosphate buffer (pH 7.4). Samples were trimmed, dehydrated in an automated processor, and embedded in paraffin. Sections (80 µm thick) were deparaffinized in xylene and rehydrated with graded ethanol. The slides were rinsed with 0.05 M Tris-buffered saline (TBS, pH 7.6), treated with 1% hydrogen peroxide in methanol, and again rinsed with TBS. The slides were incubated with 5% normal gout serum for 5 min and then overnight at 4°C with rabbit polyclonal anti-PGP9.5 antibody (diluted 1:200, Dako, Santa Clara, CA, USA). The sections were exposed for 60 min to Alexa Fluor 488-conjugated secondary antibodies (Invitrogen, Carlsbad, CA, USA). The slides were mounted with a mounting medium. The IENFD was quantified according to recently published European Federation of Neurological Societies guidelines20. Five randomly chosen tissue sections from each animal were quantified. Only single IENFs crossing the dermal-epidermal junction were counted, excluding secondary branching and nerve fragments not crossing the dermal-epidermal junction. The data are presented as the number of fibers per millimeter.
Statistical analysis
Data are presented as the mean ± SD. A multiple comparison test was performed to analyze the differences among the four groups. The homogeneity of variance was analyzed by Bartlett’s test, followed by a one-way analysis of variance when the variance was homogeneous. If a significant difference was found among the groups, Tukey’s test (parametric) was performed to test the differences among the mean values. When the variance was heterogeneous, the Kruskal-Wallis H-test (Wilcoxon test) was performed, and if a significant difference was found among the groups, the Steel-Dwass test (nonparametric) was performed to test the differences among the mean values.
A P value of less than 0.05 was considered statistically significant. Statistical analyses were performed using JMP Pro11.2.0 software (SAS Institute, Tokyo, Japan).
Results
Glycosuria, glycemia, and blood pressure monitoring
The average body weights of the HF and N groups were significantly increased compared with those of the AH and AL groups from 13 weeks of age to the time of scheduled necropsy (N group, 419.3 ± 20.1 g; AL group, 300.5 ± 48.9 g; AH group, 312.6 ± 42.8 g; HF group, 495.7 ± 27.4 g) (Fig. 1a). Severe hyperglycemia (>300 mg/dL) and glycosuria (>500 mg/dL, data not shown) continued from the day of alloxan injection to the time of scheduled necropsy (36 weeks of age) in the AH and AL groups; however, all rats in the HF group showed a slightly higher glycemia (<200 mg/dL) until 33 weeks of age and developed hyperglycemia at the time of scheduled necropsy, and all rats in the N group showed normal glycemia (<150 mg/dL) at the time of scheduled necropsy (Fig. 1b). The plasma glucose level of the HF group was significantly increased compared with that of the N group from 33 weeks of age to the time of scheduled necropsy. The plasma triglyceride level in the AH group was significantly increased compared to the AL and N groups from 33 weeks of age (Fig. 1c). The triglyceride level in the AH group was also increased compared with that of the HF groups from 23 to 36 weeks of age (Fig. 1c), but there was no significant difference between the AH and HF groups. The plasma triglyceride level in the HF group was only significantly increased compared with the levels of the AL and N group at the time of scheduled necropsy (Fig. 1c). The total cholesterol levels of the four groups gradually increased, and the levels was significantly elevated in the AH group compared with those of the N, HF, and AL groups (Fig. 1d). The LDL concentrations of the AL, AH, and HF groups were significantly higher than that of the N group at the time of scheduled necropsy. Moreover, the LDL concentration of the AH group was about twice those of the HF and AL groups (Fig. 2). There was no significant difference in the systolic blood pressures among the four groups.
Fig. 1.

Changes in body weight (a) and blood glucose (b), triglyceride (c), and total cholesterol (d) levels in the four groups. Data are expressed as the mean ± SD. * p<0.05 N vs. HF; **p<0.01 N vs. HF; †p<0.05 N vs. AL; ††p<0.01 N vs. AL; ‡p<0.05 N vs. AH; ‡‡p<0.01 N vs. AH; §p<0.05 HF vs. AL; §§p<0.01 HF vs. AL; ||p<0.05 HF vs. AH; ||||p<0.01 HF vs. AH; ¶p<0.05 AL vs. AH; and ¶¶p<0.01 AL vs. AH (a, Tukey’s test; b–d, Steel-Dwass test). N, nondiabetic rats treated with standard rat chow; AL, alloxan-induced diabetic rats; AH; diabetic rats treated with a high-fat diet; HF, nondiabetic rats treated with a high-fat diet.
Fig. 2.

Low-density lipoprotein (LDL) cholesterol concentrations of the four groups. Data are expressed as the mean ± SD. **p<0.01 (Steel-Dwass test)
Motor and sensory nerve conduction velocity (MNCV and SNCV)
The MNCVs of the AH and AL groups were significantly lower than that of the N group, but there was no significant difference between the AH and AL groups (Fig. 3). The MNCV of the HF group slightly decreased compared with that of the N group. The SNCV of the AH group was also slightly but not significantly reduced compared with those of the N, HF, and AL groups (Fig. 3).
Fig. 3.

Motor and sensory nerve conduction velocities in the N, AH, AL, and HF groups. **p<0.01 (Tukey’s test). N, nondiabetic rats treated with standard rat chow; AL, alloxan-induced diabetic rats; AH, diabetic rats treated with a high-fat diet; HF, nondiabetic rats treated with a high-fat diet.
Morphological analysis on the tibial and sural nerves
Myelinated nerve fibers of the tibial nerve in the AH and AL groups showed slight axonal atrophy compared with those of the N and HF groups (Fig. 4). Myelin in the AH group had an almost normal appearance, although some nerve fibers showed myelin distention (Fig. 4). Myelinated nerve fibers of the sural nerve had an almost normal appearance in all groups. The endoneurium, including vessels of the tibial and sural nerves, also had normal structures in all groups.
Fig. 4.

Representative semi-thin sections of tibial and sural nerves in the N, AH, AL, and HF groups. Myelinated nerve fibers of the tibial nerve in the AL and AH groups show slight axonal atrophy compared with those of the HF and AL groups. Myelin in the AH group has an almost normal appearance, but some myelin shows myelin distention (arrows). Myelinated nerve fibers of the sural nerve have an almost normal appearance in the four groups. N, nondiabetic rats treated with standard rat chow; AL, alloxan-induced diabetic rats; AH, diabetic rats treated with a high-fat diet; HF, nondiabetic rats treated with a high-fat diet.
Morphometrical analysis of the tibial and sural nerves
Regarding the tibial nerve, the mean myelin size of the AH group was increased compared with those of the N, HF, and AL groups, and the difference between the AL and AH groups was significant (Table 1). The axon/fiber ratio and mean axon size in the AH group were slightly, but not significantly, decreased compared with those of the N, HF, and AL groups (Table 1). However, there were no significant differences in morphometric parameters, including the aforementioned parameters, among the N, HF, and AL groups.
Table 1. Morphometric Analysis of Tibial and Sural Nerves.

Regarding the sural nerve, the mean myelin sizes and fiber sizes of the HF, AL, and AH groups were decreased compared with those of the N group, and the differences between the N and AH groups were significant (Table 1). The mean axon sizes of the HF, AL, and AH groups were also decreased compared with that of the N group, but there were no significant differences among the four groups (Table 1).
The fiber and myelin size frequency histogram for the tibial nerve indicated a significant shift to a larger size in the AH group compared with the AL and HF groups (p<0.01, Fig. 5a and b), and the axon size frequency histogram showed a significant shift to a smaller size in the AH group compared with the N, HF, and AL groups (p<0.01, Fig. 5c). In the sural nerve, the fiber and myelin size frequency histogram displayed a significant shift to a smaller size in the AH group compared with the N, HF, and AL groups (p<0.01, Fig. 5d and e), and the axon size frequency histogram presented a significant shift to a smaller size in the HF, AL, and AH groups compared with the N group (p<0.01, Fig. 5f).
Fig. 5.

Myelinated fiber, axon, and myelin size frequency histograms for the tibial (a–c) and sural (d–f) nerves in the N, AH, AL, and HF groups. The fiber and myelin sizes of tibial nerve (a, b) indicates a significant shift to a larger size in the AH group (p<0.01; Steel-Dwass test). The axon size of the tibial nerve (c) shows a significant shift to a smaller size in the AH group. (p<0.01; Steel-Dwass test). In the sural nerve, the fiber and myelin sizes (d, e) display a significant shift to a smaller size in the AH group, and the axon size (f) shows a slight shift to a smaller size in the HF, AL, and AH groups compared with the N group (p<0.01; Steel-Dwass test). N, nondiabetic rats treated with standard rat chow; AL, alloxan-induced diabetic rats; AH, diabetic rats treated with a high-fat diet; HF, nondiabetic rats treated with a high-fat diet.
Intraepidermal nerve fiber density (IENFD)
The IENFDs of the four groups were similar, but that of the HF group was lower than those of the AL and AH groups in the skin of the hind paw footpad (Fig. 6).
Fig. 6.
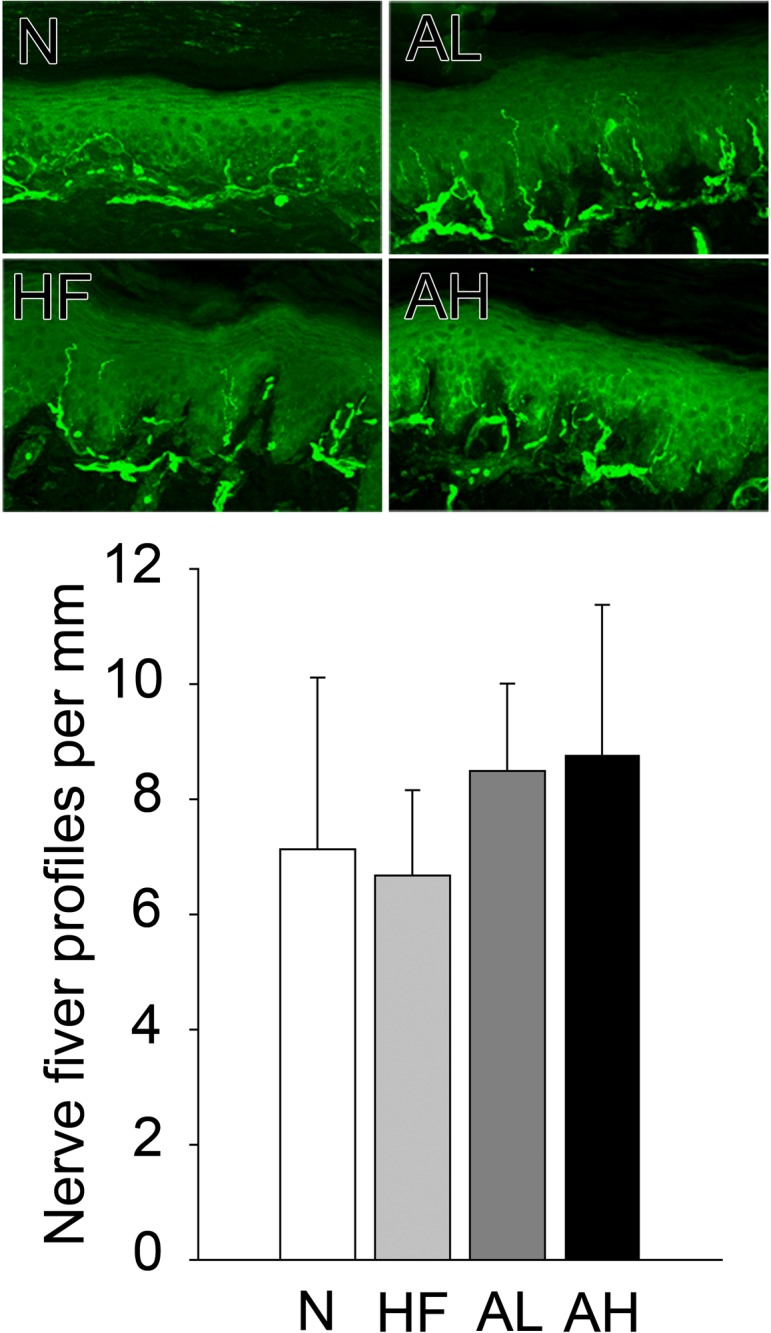
Representative sections indicating the intraepidermal nerve fiber density immunostained for PGP9.5. The IENFDs of the four groups are similar, but that of the HF group is slightly lower than those of the AL and AH groups. N, nondiabetic rats treated with standard rat chow; AL, alloxan-induced diabetic rats; AH, diabetic rats treated with a high-fat diet; HF, nondiabetic rats treated with a high-fat diet.
Discussion
According to the present study, diabetic rats with dyslipidemia had a significantly smaller axon size compared with diabetic rats and nondiabetic rats with dyslipidemia. Axonal atrophy has reportedly been observed in chemically induced or spontaneously diabetic animals, and the occurrence of lesions was one of the characteristic changes in rodent models of diabetic peripheral neuropathy2, 14, 15, 18, 19, 21. Previous study findings on the morphological changes in peripheral motor nerves due to hyperlipidemia are contradictory; dyslipidemia reduced myelin thickness in obese db/db and ob/ob mice, while dyslipidemia had no effect on peripheral nerves in HFD-treated mice7, 11. In the rat model in the present study, it is likely that combined hyperglycemia and hyperlipidemia have enhanced axonal damage compared with hyperlipidemia alone. In other studies, MNCV decreased in diabetic rats/mice with spontaneously or HFD-induced hyperlipidemia6, 7, 8, 22. Furthermore, HFD treatment also decreased MNCV in non-diabetic mice11, 12, 13, although combined hyperglycemia and hyperlipidemia did not exacerbate MNCV in the present study. The MNCV of the HF group may have slightly decreased compared with the MNCV of the N group. Thus, hyperlipidemia may slightly affect the MNCV of WBN rats. However, the effect of hyperglycemia on MNCV may be too robust to allow for demonstration of the potential effects of hyperlipidemia given the distinct decrease of MNCV in the AL group.
In the present study, combined hyperglycemia and hyperlipidemia slightly exacerbated the SNCV compared with hyperlipidemia alone. Patients and animals with diabetes have exhibited a slower SNCV compared with patients and animals without diabetes23, 24. The HFD-fed mice developed an SNCV deficit prior to impaired glucose tolerance11, 12. In the present study, hyperglycemia or hyperlipidemia alone could not decrease the SNCV, but superimposing hyperglycemia on hyperlipidemia caused prolongation of the SNCV, consistent with previous studies6, 13, 22. Morphologically, slight thinning of the myelin sheath of the sensory sural nerve was observed owing to combined hyperglycemia and hyperlipidemia, although significant axonal changes could not be detected. Axonal changes, including atrophy and dwindling, reportedly occurred in the peripheral sensory nerves of chemically induced and spontaneously diabetic animals14, 15, 18, but a decrease in myelin sheath thickness has rarely been observed except in the sensory nerves of WBN rats18. Myelin thinning of sensory nerves has not been reported in animals with hyperlipidemia or with a combination of hyperglycemia and hyperlipidemia, although it has been noted in animals with both diabetes and hypertension23, 24. The combination of hyperglycemia and hyperlipidemia may have had a mild additive effect on the myelin thinning of sensory nerves, as studies have shown that it is easy to cause myelin disturbance in diabetic WBN rats16, 18.
The loss of IENFD is consistently observed both in human patients and in rodent models of diabetes6, 22, 25, 26, 27. In HFD-fed mice, hyperlipidemia decreased the IENFD, while hyperlipidemia did not prompt a change11, 12, 13. Furthermore, the combination of the HFD treatment and diabetes had no effect on the IENFD in mice22, suggesting that neither hyperlipidemia nor hyperglycemia are a factor underlying reduced the IENFD in the present study’s model.
The results of the present study suggest that HFD-induced dyslipidemia may enhance mild peripheral motor and sensory nerve lesions and slightly decrease the sensory nerve conduction velocity in diabetic WBN/Kob rats.
Disclosure of Potential Conflicts of Interest
The authors declare that there are no conflicts of interest regarding the publication of this article.
Acknowledgments
We would like to thank Editage (www.editage.jp) for the English language editing. We thank Yui Mitsuhashi, Shintaro Kanehara, and Kohei Nishimura for technical assistance.
References
- 1.Low PA. Pathogenesis of diabetic neuropathy. In: Joslin’s Diabetes Mellitus, 14 ed. CR Kahn, GC Weir, GL King, AM Jakobson, AC Moses, and RJ Smith (eds). Lipponcott Williams & Wilkins, Boston. 839–851. 2005. [Google Scholar]
- 2.Ozaki K, Hamano H, Matsuura T, and Narama I. Effect of deoxycorticosterone acetate-salt-induced hypertension on diabetic peripheral neuropathy in alloxan-induced diabetic WBN/Kob rats. J Toxicol Pathol. 29: 1–6. 2016. [DOI] [PMC free article] [PubMed] [Google Scholar]
- 3.Tesfaye S, Chaturvedi N, Eaton SE, Ward JD, Manes C, Ionescu-Tirgoviste C, Witte DR, Fuller JH. EURODIAB Prospective Complications Study Group Vascular risk factors and diabetic neuropathy. N Engl J Med. 352: 341–350. 2005. [DOI] [PubMed] [Google Scholar]
- 4.Vincent AM, Hinder LM, Pop-Busui R, and Feldman EL. Hyperlipidemia: a new therapeutic target for diabetic neuropathy. J Peripher Nerv Syst. 14: 257–267. 2009. [DOI] [PMC free article] [PubMed] [Google Scholar]
- 5.Steinmetz A. Lipid-lowering therapy in patients with type 2 diabetes: the case for early intervention. Diabetes Metab Res Rev. 24: 286–293. 2008. [DOI] [PubMed] [Google Scholar]
- 6.Hinder LM, Vincent AM, Hayes JM, McLean LL, and Feldman EL. Apolipoprotein E knockout as the basis for mouse models of dyslipidemia-induced neuropathy. Exp Neurol. 239: 102–110. 2013. [DOI] [PMC free article] [PubMed] [Google Scholar]
- 7.Nowicki M, Kosacka J, Serke H, Blüher M, and Spanel-Borowski K. Altered sciatic nerve fiber morphology and endoneural microvessels in mouse models relevant for obesity, peripheral diabetic polyneuropathy, and the metabolic syndrome. J Neurosci Res. 90: 122–131. 2012. [DOI] [PubMed] [Google Scholar]
- 8.Oltman CL, Coppey LJ, Gellett JS, Davidson EP, Lund DD, and Yorek MA. Progression of vascular and neural dysfunction in sciatic nerves of Zucker diabetic fatty and Zucker rats. Am J Physiol Endocrinol Metab. 289: E113–E122. 2005. [DOI] [PubMed] [Google Scholar]
- 9.Gordon Smith A, and Robinson Singleton J. Idiopathic neuropathy, prediabetes and the metabolic syndrome. J Neurol Sci. 242: 9–14. 2006. [DOI] [PubMed] [Google Scholar]
- 10.Wiggin TD, Sullivan KA, Pop-Busui R, Amato A, Sima AA, and Feldman EL. Elevated triglycerides correlate with progression of diabetic neuropathy. Diabetes. 58: 1634–1640. 2009. [DOI] [PMC free article] [PubMed] [Google Scholar]
- 11.Obrosova IG, Ilnytska O, Lyzogubov VV, Pavlov IA, Mashtalir N, Nadler JL, and Drel VR. High-fat diet induced neuropathy of pre-diabetes and obesity: effects of “healthy” diet and aldose reductase inhibition. Diabetes. 56: 2598–2608. 2007. [DOI] [PubMed] [Google Scholar]
- 12.Drel VR, Mashtalir N, Ilnytska O, Shin J, Li F, Lyzogubov VV, and Obrosova IG. The leptin-deficient (ob/ob) mouse: a new animal model of peripheral neuropathy of type 2 diabetes and obesity. Diabetes. 55: 3335–3343. 2006. [DOI] [PubMed] [Google Scholar]
- 13.Vincent AM, Hayes JM, McLean LL, Vivekanandan-Giri A, Pennathur S, and Feldman EL. Dyslipidemia-induced neuropathy in mice: the role of oxLDL/LOX-1. Diabetes. 58: 2376–2385. 2009. [DOI] [PMC free article] [PubMed] [Google Scholar]
- 14.Powell H, Knox D, Lee S, Charters AC, Orloff M, Garrett R, and Lampert P. Alloxan diabetic neuropathy: electron microscopic studies. Neurology. 27: 60–66. 1977. [DOI] [PubMed] [Google Scholar]
- 15.Yagihashi S, Kudo K, and Nishihira M. Peripheral nerve structures of experimental diabetes rats and the effect of insulin treatment. Tohoku J Exp Med. 127: 35–44. 1979. [DOI] [PubMed] [Google Scholar]
- 16.Narama I, and Kino I. Peripheral motor neuropathy in spontaneously diabetic WBN/Kob rats: a morphometric and electron microscopic study. Acta Neuropathol. 79: 52–60. 1989. [DOI] [PubMed] [Google Scholar]
- 17.Ozaki K, Miura K, Tsuchitani M, and Narama I. Peripheral neuropathy in the spontaneously diabetic WBN/Kob rat. Acta Neuropathol. 92: 603–607. 1996. [DOI] [PubMed] [Google Scholar]
- 18.Yagihashi S, Wada R, Kamijo M, and Nagai K. Peripheral neuropathy in the WBN/Kob rat with chronic pancreatitis and spontaneous diabetes. Lab Invest. 68: 296–307. 1993. [PubMed] [Google Scholar]
- 19.Ozaki K, Yamano S, Matsuura T, and Narama I. Insulin-ameliorated peripheral motor neuropathy in spontaneously diabetic WBN/Kob rats. J Vet Med Sci. 75: 1323–1328. 2013. [DOI] [PMC free article] [PubMed] [Google Scholar]
- 20.Lauria G, Cornblath DR, Johansson O, McArthur JC, Mellgren SI, Nolano M, Rosenberg N, Sommer C. European Federation of Neurological Societies EFNS guidelines on the use of skin biopsy in the diagnosis of peripheral neuropathy. Eur J Neurol. 12: 747–758. 2005. [DOI] [PubMed] [Google Scholar]
- 21.Ozaki K, Sano T, Tsuji N, Matsuura T, and Narama I. Insulin-induced hypoglycemic peripheral motor neuropathy in spontaneously diabetic WBN/Kob rats. Comp Med. 60: 282–287. 2010. [PMC free article] [PubMed] [Google Scholar]
- 22.Guilford BL, Ryals JM, and Wright DE. Phenotypic changes in diabetic neuropathy induced by a high-fat diet in diabetic C57BL/6 mice. Exp Diabetes Res. 2011: 848307 2011. [DOI] [PMC free article] [PubMed] [Google Scholar]
- 23.De Visser A, Hemming A, Yang C, Zaver S, Dhaliwal R, Jawed Z, and Toth C. The adjuvant effect of hypertension upon diabetic peripheral neuropathy in experimental type 2 diabetes. Neurobiol Dis. 62: 18–30. 2014. [DOI] [PubMed] [Google Scholar]
- 24.Gregory JA, Jolivalt CG, Goor J, Mizisin AP, and Calcutt NA. Hypertension-induced peripheral neuropathy and the combined effects of hypertension and diabetes on nerve structure and function in rats. Acta Neuropathol. 124: 561–573. 2012. [DOI] [PubMed] [Google Scholar]
- 25.Christianson JA, Ryals JM, Johnson MS, Dobrowsky RT, and Wright DE. Neurotrophic modulation of myelinated cutaneous innervation and mechanical sensory loss in diabetic mice. Neuroscience. 145: 303–313. 2007. [DOI] [PMC free article] [PubMed] [Google Scholar]
- 26.Johnson MS, Ryals JM, and Wright DE. Early loss of peptidergic intraepidermal nerve fibers in an STZ-induced mouse model of insensate diabetic neuropathy. Pain. 140: 35–47. 2008. [DOI] [PMC free article] [PubMed] [Google Scholar]
- 27.Smith AG, and Singleton JR. Obesity and hyperlipidemia are risk factors for early diabetic neuropathy. J Diabetes Complications. 27: 436–442. 2013. [DOI] [PMC free article] [PubMed] [Google Scholar]