Abstract
Objective
The rate of platelet count reduction appears to differ among different liver diseases. In the present study, we investigated the difference in the platelet counts of patients with nonalcoholic fatty liver disease (NAFLD) and those with chronic liver disease due to hepatitis C virus (CLD-HCV).
Methods
The study population included 620 patients with NAFLD and 405 patients with CLD-HCV, all of whom were diagnosed by liver biopsy. The relationships between the grade of fibrosis and the platelet count in the two diseases were compared. The optimal cut-off value for the diagnosis of liver cirrhosis (LC) was measured. The relationships between the platelet count and anti-platelet antibodies, the serum thrombopoietin level, the grade of splenomegaly and liver stiffness were also investigated in both LC groups.
Results
In NAFLD patients, the platelet count was significantly higher at each grade of fibrosis in comparison to CLD-HCV. The optimal cut-off value for the diagnosis of LC was 16.0×10⁴/μL [sensitivity, 86.7%; specificity, 87.6%; area under the curve (AUC), 0.930] in NAFLD and 12.7×10⁴/μL (sensitivity, 57.8%; specificity, 88.2%; AUC, 0.863) in CLD-HCV. No anti-platelet antibodies were detected in patients with either type of LC. The serum thrombopoietin levels, the distribution of splenomegaly grades, and liver stiffness did not differ between the two LC groups to a statistically significant extent. As the splenomegaly grade increased, the platelet count decreased.
Conclusion
The optimal cut-off values for diagnosing LC differed between the two diseases and should be determined separately. The reason for the difference in platelet reduction is still unclear, and requires further investigation.
Keywords: platelet count, nonalcoholic fatty liver disease, hepatitis C virus
Introduction
Nonalcoholic fatty liver disease (NAFLD) has become the most common type of liver disease in developed countries worldwide. NAFLD covers a wide spectrum from nonalcoholic fatty liver (NAFL) to nonalcoholic steatohepatitis (NASH), which can progress to cirrhosis and hepatocellular carcinoma (HCC) (1-3). NASH was initially identified as a clinicopathological entity, and biopsy is still considered to be the gold standard for a definitive diagnosis. However, liver biopsy has several drawbacks because it is an invasive, painful, and costly procedure. Furthermore, there is a possibility of sampling error and variability in interpretation. Moreover, there is an extremely high prevalence of NAFLD in the general population, and it is impossible to carry out liver biopsies in all NAFLD patients. These shortcomings and drawbacks of liver biopsy highlight the urgent need to find noninvasive markers or imaging techniques for the assessment of NASH. Several biomarkers for distinguishing NASH from NAFLD and/or diagnosing advanced fibrosis or cirrhosis have been evaluated (4).
Recently, Angulo et al. (5) reported that a number of pathologic features were associated with hepatic mortality in a univariate analysis, but that fibrosis was the only independent predictor in a multivariate analysis; thus, the severity of fibrosis rather than the diagnosis of NASH determined hepatic mortality. In other words, the degree of liver fibrosis is the most important index of the severity of NAFLD.
The platelet counts has been shown to be a convenient marker of liver fibrosis in several liver diseases, such as hepatitis C and NAFLD (6-9). The platelet count is easy to measure and the measurement is cost effective. The mechanism underlying the reduction in the platelet count in liver disease has been variously explained by anti-platelet antibodies, the decreased production of thrombopoietin and portal hypertension, including hypersplenism. In addition, the rate of platelet count reduction has been suggested to differ among liver diseases (10,11). Although there are platelet count data for NAFLD and chronic liver disease due to hepatitis C virus (CLD-HCV), they were gathered at different institutes and could not be directly compared (7-9). Mawatari et al. reported on the relationship between liver stiffness (as assessed by transient elastography ) and the platelet count in CLD-HCV and NAFLD (12). However, they did not investigate the relationship between the histological findings of liver fibrosis and the platelet count in the two diseases. In addition, their sample size was small, with just 187 patients (91 patients with NAFLD and 96 patients with CLD-HCV).
In this study, we compared the rates of platelet count reduction between NAFLD and CLD-HCV at the same histological fibrosis stages in a large population of patients who were treated at the same institute, and explored the reasons for the difference.
Materials and Methods
Patients
Among patients with liver disease who were treated at Tokyo Women's Medical University between 2000 and 2016, 620 patients who were diagnosed with NAFLD (clinically and histologically) and 405 patients diagnosed with CLD due to HCV were enrolled in the present study. The diagnosis of NAFLD was based on the following criteria: (1) macrovesicular steatosis affecting at least 5% of the hepatocytes, (2) an intake of <20 g of ethanol/ day in women and <30 g/day in men (confirmed by the attending physician and family members residing with the patient), and (3) the appropriate exclusion of other liver diseases such as alcoholic liver disease, viral hepatitis, autoimmune hepatitis, drug-induced liver disease, primary biliary cholangitis, and primary sclerosing cholangitis (1,2,13). The patients with CLD due to HCV (CLD-HCV) were diagnosed based on the detection of HCV RNA by a quantitative polymerase chain reaction and had not been treated with either interferon or direct antiviral agent (DAA) therapy.
A complete history was obtained and a physical examination was performed in all patients; the following laboratory parameters were then measured: aspartate aminotransferase (AST), alanine aminotransferase (ALT), platelet count, hepatitis B serology (hepatitis B surface antigen, antibody to hepatitis B surface antigen), hepatitis C serology (hepatitis C virus antibody and/or HCV RNA), and autoantibodies (antinuclear antibody and anti-mitochondrial antibody). All of the liver biopsy specimens were examined by the same pathologist essential hypertensive (EH). In NAFLD patients, fibrosis was scored on a 5-grade scale: F0, normal connective tissue; F1, focal perivenular or pericellular fibrosis in zone 3; F2, perivenular or pericellular fibrosis confined to zones 2 and 3 with portal/periportal fibrosis; F3, bridging or septal fibrosis; and F4, cirrhosis (13,14).
In CLD-HCV, the fibrosis stage was scored on a 5-grade scale: F0, normal connective tissue; F1, periportal fibrosis; F2, bridging fibrosis; F3, bridging or septal fibrosis with lobular distortion; and F4, cirrhosis (15).
In F4 patients with NAFLD or CLD-HCV, the anti-platelet antibodies were measured by the mixed passive hemagglutination (MPHA) method, as described by Tsubaki et al. (16). The serum thrombopoietin levels were measured by bioluminescent enzyme immunoassay, as described by Rios et al. (17). The grade of splenomegaly was determined by CT or ultrasound. LC patients were divided into 4 groups (no splenomegaly, mild splenomegaly, moderate splenomegaly and severe splenomegaly) according to the spleen index (SI), which was determined based on the spleen length (cm) × width (cm) as follows: SI ≤39, no splenomegaly; SI 40-60, mild splenomegaly; SI 61-89, moderate splenomegaly; SI ≥90, severe splenomegaly (18).
Transient elastography was performed with a FibroScanⓇ device (Echosenses, Paris, France) and an ultrasound transducer probe mounted on the axis of a vibrator. The tip of the probe transducer was placed in the intercostal space at the level of the right mid-axillary line and at the center of the right liver lobe. The vibration transmitted from the vibrator towards the tissue induces an elastic shear wave that propagates through the tissue. These propagations are followed by pulse-echo ultrasound acquisition, and their velocity, which is directly related to tissue stiffness, is measured (19). Ten successive images were acquired in each patient. The results are expressed as kilopascals (kPa), using a median of 10 valid acquisitions. The success rate was calculated as the ratio of the number of successful acquisitions to the total number of acquisitions, and a success rate of ≥60% or an interquartile range of <30% was considered to indicate a reliable result.
Informed consent was obtained from all of the patients before their enrollment in the study. The study protocol conformed to the ethical guidelines of the 2008 Declaration of Helsinki and was approved by our institution's research committee.
Statistical analysis
The statistical analyses were conducted using the SPSS 12.0 software program (SPSS, Chicago, USA).
The mean platelet counts were expressed as the mean ± standard deviation and were compared by the Mann-Whitney test. The diagnostic performance of the platelet count was assessed by a receiver-operating characteristic (ROC) curve analysis. The probability of true positive (sensitivity) and true negative (specificity) assessment was determined for selected cut-off values, and the area under the ROC curve (AUROC) was calculated. The correlations between the platelet count and the serum thrombopoietin level, the grade of splenomegaly and the ratio of collagen were examined by Spearman's correlation test. The correlation index (R) was calculated. The p values of <0.05 were considered to indicate statistical significance.
Results
Table 1 shows the data of patients with NAFLD and CLD-HCV. The percentage of male patients in each group did not differ to a statistically significant extent. The mean age in the NAFLD group was greater than that in the CLD-HCV group. Table 2 shows the mean platelet counts for each stage of fibrosis. Stage 3 in NAFLD and stage 2 or 3 in CLD-HCV had bridging fibrosis without LC and were thought to be of an equivalent grade. Thus, we compared the platelet counts between F0-1 in NAFLD and F0-1 in CLD-HCV (mean platelet count (μl/L): 24×104 vs. 19×104), F3 in NAFLD and F2-3 in CLD-HCV (18×104 vs. 12×104), F4 in NAFLD and F4 in CLD-HCV (12×104 vs. 10×104). The platelet counts of the NAFLD patients were significantly higher in each fibrosis group.
Table 1.
Patients Profile.
| Total | NAFLD | CLD-HCV | p value |
|---|---|---|---|
| Number | 620 | 405 | |
| Gender (male%) | 55.6 | 52.6 | N.S. |
| Age (mean) | 67.4 | 57.4 | p=0.02 |
| Liver cirrhosis | |||
| Number | 69 | 46 | |
| Gender (male%) | 43.5 | 50.0 | N.S. |
| Age (mean) | 60.5 | 63.1 | N.S. |
NAFLD: nonalcoholic fatty liver disease, CLD-HCV: chronic liver disease due to hepatitis C virus, N.S.: not significant
Table 2.
The Comparison of Platelet Count between NAFLD and CLD-HCV Each Stage.
| Stage | NAFLD n=620 |
Stage | CLD-HCV n=405 |
p value |
|---|---|---|---|---|
| 0-1 | 24×104/μL n=239 |
0-1 | 19×104/μL n=232 |
<0.01 |
| 2 | 22×104/μL n=207 |
- | ||
| 3 | 18×104/μL n=105 |
2-3 | 12×104/μL n=127 |
<0.01 |
| 4 | 12×104/μL n=69 |
4 | 10×104/μL n=46 |
<0.01 |
NAFLD: nonalcoholic fatty liver disease, CLD-HCV: chronic liver disease due to hepatitis C virus
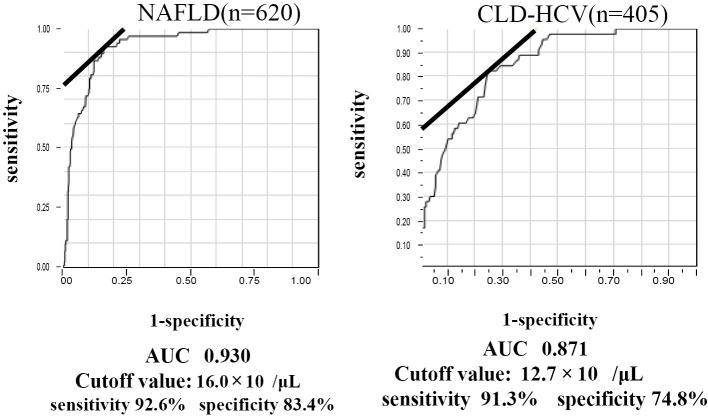
Regarding the diagnosis of LC, the optimal cut-off value of the NAFLD patients with LC was 16.0×10⁴ μl/L: (sensitivity, 86.7%; specificity, 87.6%; AUC, 0.930) while that in HCV patients was 12.7×10⁴ μl/L (sensitivity, 57.8%; specificity, 88.2 %; AUC, 0.863) (Fig. 1). The optimal cut-off value of the NAFLD patients was also higher than that of the CLD-HCV patients.
Figure 1.
The diagnosis of liver cirrhosis in 620 NAFLD patients (A) and 405 chronic liver disease patients with HCV (B). An ROC analysis was performed to calculate the AUC, sensitivity and specificity of the platelet count. The optimal cut-off value for NAFLD-LC was 16.0×10⁴ μl/L (sensitivity, 86.7%; specificity, 87.6%; AUC, 0.930), while that for CLD-HCV-LC was 12.7×10⁴ (sensitivity, 57.8%; specificity, 88.2 %; AUC, 0.863).
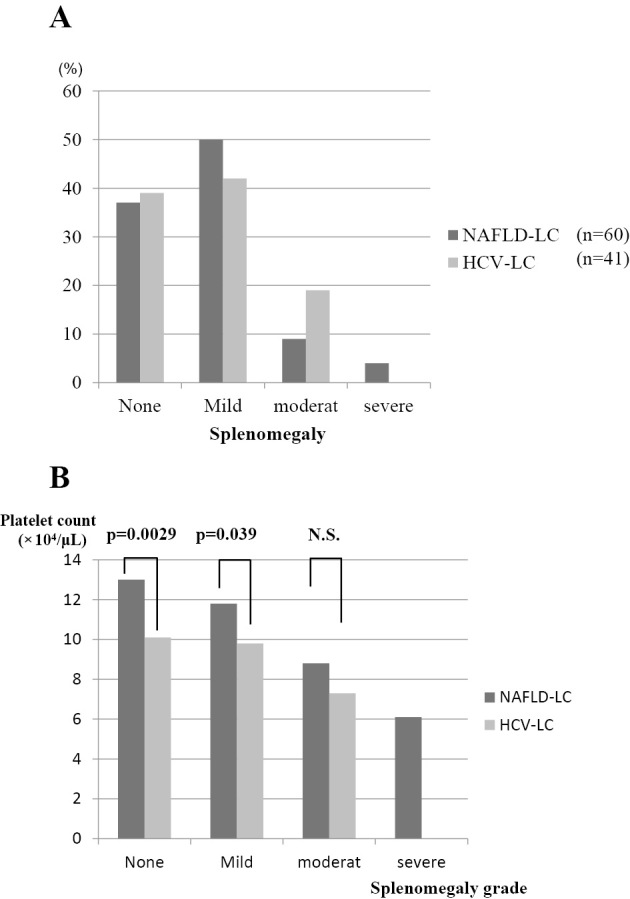
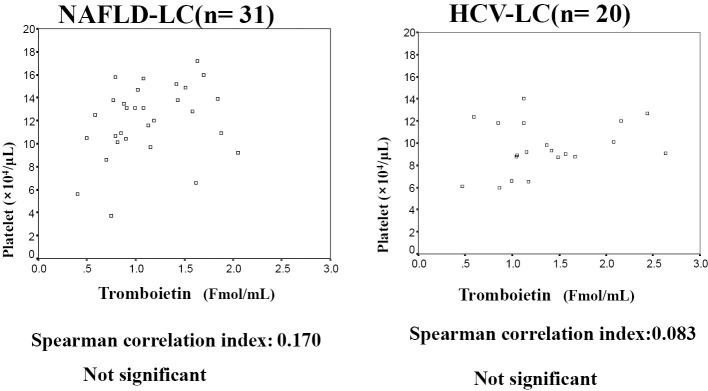
To investigate the mechanism underlying the reduction in the platelet count, we measured the anti-platelet antibodies, serum thrombopoietin level, grade of splenomegaly and liver stiffness in LC patients with NAFLD or CLD-HCV. No anti-platelet antibodies were detected in either LC group (31 NAFLD-LC patients and 20 HCV-LC patients). There was no significant difference in the serum thrombopoietin levels of the two LC groups (NAFLD-LC (n=31), 1.42±1.67 Fmol/mL; HCV-LC (n=20), 1.36±0.58 Fmol/mL]. Furthermore, there was no significant correlation between the platelet count and the serum thrombopoietin level (Fig. 2). The percentages of the various grades of splenomegaly are shown in Fig. 3A (60 NAFLD-LC patients and 41 HCV-LC) patients; the distribution of the grades of splenomegaly did not differ between the two LC groups to a statistically significant extent. Fig. 3B shows the association between the platelet count and the grade of splenomegaly in each LC group. The platelet counts decreased with the progression of splenomegaly in both LC groups. The platelet counts for no splenomegaly and mild splenomegaly in the NAFLD-LC group were significantly higher than those in the HCV-LC group. The same tendency was observed for moderate splenomegaly in NAFLD-LC; however, the difference was not statistically significant. The platelet count was negatively correlated with the grade of splenomegaly (NAFLD-LC, r=-0.383, p<0.01; HCV-LC, r=-0.423, p<0.05).
Figure 2.
The correlation between the serum thrombopoietin level and the platelet count. There was no significant correlation between the serum thrombopoietin level and the platelet count in either LC group. r, correlation index (calculated by Spearman’s correlation test).
Figure 3.

(A), (B). The association between the platelet count and splenomegaly. The percentages of patients with various grades of splenomegaly are shown in A. There was no significant difference in the distributions of the two LC groups. B shows the platelet count for each grade of splenomegaly. The platelet counts for no splenomegaly and mild splenomegaly were significantly higher in the NAFLD-LC group than in the HCV-LC group.
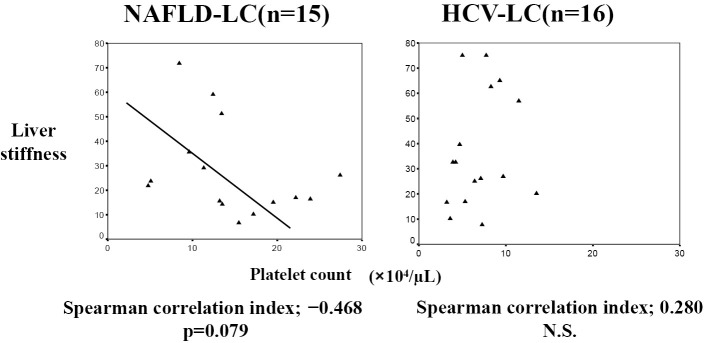
Regarding liver stiffness, there was no difference between the two LC groups [liver stiffness, 27.8+19.1 kPa; in NAFLD-LC (n=15) vs. 36.9+22.8 kPa in HCV-LC (n=16)]. In NAFLD-LC, liver stiffness tended to be negatively associated with the platelet count (r=-0.468, p=0.079); however, there was no significant association in CLD-HCV-LC (r=0.280, not significant, Fig. 4).
Figure 4.
The association between liver stiffness and the platelet count. In the NAFLD-LC group, liver stiffness tended to be negatively associated with the platelet count (r=-0.468, p=0.079). There was no such association in the HCV-LC group (r=0.280, not significant). r, correlation index.
Discussion
We compared platelet counts between NAFLD and CLD-HCV. The platelet counts in NAFLD were significantly higher than in CLD-HCV at all equivalent grades of fibrosis.
The mean age of the NAFLD patients was greater; however, it was thought that age did not influence platelet counts or our results, because the mean age did not differ between the two LC groups. The clinical usefulness of platelet count has been previously reported in both CLD-HCV and NAFLD (7-12). Qiu et al. (9) reported that the optimal cut-off value in LC with HCV was 11×104 μl/L. In contrast, the optimal cut-off value in LC with NAFLD has been reported to be 15.3×10⁴ μl/L (8) and 16.0×10⁴ μl/L (7). This was similar to the cut-off value obtained in the present study (16.0×10⁴ μl/L). These data suggest that the optimal cut-off value of LC with NAFLD is higher than that of LC with HCV. In the present study, we compared the cut-off values between the two diseases in a large population of patients who were treated at the same institute and the evaluations were performed by the same pathologist. Our results confirmed that the cut-off values differed between the two liver diseases, suggesting that different causative mechanisms might account for the of platelet count reductions in the respective diseases.
To explore the mechanism underlying the difference in the rates of platelet reduction, we measured the anti-platelet antibody levels, the thrombopoietin level, the grade of splenomegaly and liver stiffness. The anti-platelet antibody levels and thrombopoietin levels did not differ between the two LC groups. In both LC groups, the grade of splenomegaly was negatively correlated with the platelet count. However, the distribution of the splenomegaly grades did not differ between the two LC groups. Furthermore, there was no difference in the degree of liver stiffness between the two LC groups. In HCV-LC, liver stiffness was not correlated with the platelet count, as shown in Fig. 4. In contrast, liver stiffness tended to be negatively associated with the platelet count in NAFLD-LC. Taken together, it was suggested that both splenomegaly and the degree of liver fibrosis might influence the platelet count in NAFLD. However, another factor (besides splenomegaly) might be associated with the decrease in the platelet count in CLD-HCV.
Sanjo et al. (20) reported that the platelet count was not correlated with the serum thrombopoietin level in CLD-HCV, but that it was correlated with the spleen volume and platelet-associated IgG (PAIgG). In contrast, Giannini et al. (21) reported that the serum thrombopoietin levels were correlated with the degree of liver functional impairment and the degree of liver fibrosis in CLD-HCV. The influence of thrombopoietin remains controversial and should be investigated in the future.
Several papers (20,22) have reported that PAIgG is increased in CLD-HCV. In this study, no anti-platelet antibodies were detected. However, our method for detecting anti-platelet antibodies differed from the method that was used to measure PAIgG. It is necessary to further investigate the differences between PAIgG and anti-platelet antibodies.
Recently, the measurement of liver stiffness by transient elastography was reported to be useful for the quantification of liver fibrosis (19,23). However, Gaia et al. (24) reported that transient elastography could be considered a valid method for the detection of HCV-associated fibrosis in CLD, but that it should be interpreted cautiously in patients with chronic hepatitis B and NAFLD. It has been suggested that obesity or liver steatosis might influence elastographic measurements (25,26). The platelet count may be easier to use and it might be a more precise than elastography for determining the liver stiffness in severely obese NAFLD patients.
This study was associated with some limitations. In order to compare patients with the same condition and to obtain a correct diagnosis of NAFLD, liver biopsies were performed in all patients. Thus, LC patients with decompensated stage and burned-out NASH were excluded. As a result, our comparisons did not include patients with decompensated LC. If we were to re-analyze the cut-off value for LC to include decompensated-stage cases, the cut-off value might change.
In this study, the diagnostic sensitivity, specificity and AUC for the cut-off values of the platelet count showed that it was a useful parameter for identifying liver fibrosis and LC. However, the optimal cut-off values for diagnosing LC were different and should be determined separately for each liver disease. The reason for the difference in the rates of platelet reduction is still unclear and requires further investigation.
The authors state that they have no Conflict of Interest (COI).
References
- 1. Teli MR, James OFW, Burt AD, Bennet MK, Day CP. The natural history of nonalcoholic fatty liver: A follow-up study. Hepatology 22: 1714-1719, 1995. [PubMed] [Google Scholar]
- 2. Neuschwander-Tetri BA, Caldwell SH. Nonalcoholic steatohepatitis: summary of an AASLD single topic conference. Hepatology 37: 1202-1219, 2003. [DOI] [PubMed] [Google Scholar]
- 3. Adams LA, Lymp JF, St Sauver J, et al. The natural history of nonalcoholic fatty liver disease: a population-based cohort study. Gastroenterology 129: 113-121, 2005. [DOI] [PubMed] [Google Scholar]
- 4. Hashimoto E, Farrell GC. Will non-invasive markers replace liver biopsy for diagnosing and staging fibrosis in non-alcoholic steatohepatitis? J Gastroenterol Hepatol 24: 501-503, 2009. [DOI] [PubMed] [Google Scholar]
- 5. Angulo P, Kleiner DE, Dam-Larsen S, et al. Liver fibrosis, but no other histologic features, is associated with long-term outcomes of patients with nonalcoholic fatty liver disease. Gastroenterology 149: 389-397, 2015. [DOI] [PMC free article] [PubMed] [Google Scholar]
- 6. Fontana RJ, Lok AS. Noninvasive monitoring of patients with chronic hepatitis C. Hepatology 36 (5 Suppl 1): S57-S64, 2002. [DOI] [PubMed] [Google Scholar]
- 7. Kaneda H, Hashimoto E, Yatsuji S, Tokushige K, Shiratori K. Hyaluronic acid levels can predict severe fibrosis and platelet counts can predict cirrhosis in patients with nonalcoholic fatty liver disease. J Gastroenterol Hepatol 21: 1459-1465, 2006. [DOI] [PubMed] [Google Scholar]
- 8. Yoneda M, Fujii H, Sumida Y, et al. Platelet count for predicting fibrosis in nonalcoholic fatty liver disease. J Gastroenterol 46: 1300-1306, 2011. [DOI] [PubMed] [Google Scholar]
- 9. Qiu Y, Hoshida Y, Kato N, et al. A simple combination of serum type IV collagen and prothrombin time to diagnose cirrhosis in patients with chronic active hepatitis C. Hepatol Res 30: 214-220, 2004. [DOI] [PubMed] [Google Scholar]
- 10. Lu SN, Wang JH, Liu SL, et al. Thrombocytopenia as a surrogate for cirrhosis and a marker for the identification of patients at high risk for hepatocellular carcinoma. Cancer 107: 2212-2222, 2006. [DOI] [PubMed] [Google Scholar]
- 11. Tejima K, Masuzaki R, Ikeda H, et al. Thrombocytopenia is more severe in patients with advanced chronic hepatitis C than B with the same grade of liver stiffness and splenomegaly. J Gastroenterol 45: 876-884, 2010. [DOI] [PubMed] [Google Scholar]
- 12. Mawatari H, Yoneda M, Kirikoshi H, Maeda S, Nakajima A, Saito S. Thrombocytopenia is more severe in patients with chronic hepatitis C than in patients with nonalcoholic fatty liver disease. J Gastroenterol 47: 606-607, 2012. [DOI] [PubMed] [Google Scholar]
- 13. Brunt EM, Janney CG, Di Biscrglie AM, Neuschwander-Tetri BA, Bacon BR. Nonalcoholic steatohepatitis: a proposal for grading and staining the histological lesions. Am J Gastroenterol 94: 2467-2474, 1999. [DOI] [PubMed] [Google Scholar]
- 14. Brunt EM. Nonalcoholic steatohepatitis: definition and pathology. Semin Liver Dis 21: 3-16, 2001. [DOI] [PubMed] [Google Scholar]
- 15. Ichida F, Tsujib T, Omata M, et al. New Inuyama classification: new criteria for histological assessment of chronic hepatitis. Int Hepatol Comm 7: 112-119, 1996. [Google Scholar]
- 16. Tsubaki K. Anti-platelet antibody by alloimmunization after frequent blood transfusion in patients with hematological disorders. Rinsho Ketsueki 34: 588-592, 1993. (in Japanese, Abstract in English). [PubMed] [Google Scholar]
- 17. Rios R, Sangro B, Herrero I, Quiroga J, Prieto J. The role of TPO in the thrombocytopenia of patients with liver cirrhosis. Am J Gastroenterol 100: 1311-1316, 2005. [DOI] [PubMed] [Google Scholar]
- 18. Ishibashi H, Okumura Y, Higuchi N, et al. Differentiation of mononucleosis from hepatitis by sonographic measurement of spleen size. J Clin Ultrasound 15: 313-316, 1987. [DOI] [PubMed] [Google Scholar]
- 19. Tomeno W, Yoneda M, Imajo K, et al. Evaluation of the Liver Fibrosis Index calculated by using real-time tissue elastography for the non-invasive assessment of liver fibrosis in chronic liver diseases. Hepatol Res 43: 735-742, 2013. [DOI] [PubMed] [Google Scholar]
- 20. Sanjo A, Satoi J, Ohnishi A, Maruno J, Fukata M, Suzuki N. Role of elevated platelet-associated immunoglobulin G and hypersplenism in thrombocytopenia of chronic liver diseases. J Gastroenterol Hepatol 18: 638-644, 2003. [DOI] [PubMed] [Google Scholar]
- 21. Giannini E, Botta F, Borro P, et al. Relationship between thrombopoietin serum levels and liver function in patients with chronic liver disease related to hepatitis C virus infection. Am J Gastroenterol 98: 2516-2520, 2003. [DOI] [PubMed] [Google Scholar]
- 22. Nagamine T, Ohtuka T, Takehara K, Arai T, Takagi H, Mori M. Thrombocytopenia associated with hepatitis C viral infection. J Hepatol 24: 135-140, 1996. [DOI] [PubMed] [Google Scholar]
- 23. Sporea I, Sirli R, Deleanu A, et al. Comparison of the liver stiffness measurement by transient elastography with the liver biopsy. World J Gastroenterol 14; 14: 6513-6517, 2008. [DOI] [PMC free article] [PubMed] [Google Scholar]
- 24. Gaia S, Carenzi S, Barilli AL, et al. Reliability of transient elastography for the detection of fibrosis in non-alcoholic fatty liver disease and chronic viral hepatitis. J Hepatol 54: 64-71, 2011. [DOI] [PubMed] [Google Scholar]
- 25. Fujimori N, Tanaka N, Shibata S, et al. Controlled attenuation parameter is correlated with actual hepatic fat content in patients with non-alcoholic fatty liver disease with none-to-mild obesity and liver fibrosis. Hepatol Res 46: 1019-1027, 2016. [DOI] [PubMed] [Google Scholar]
- 26. Myers RP, Pomier-Layrargues G, Kirsch R, et al. Discordance in fibrosis staging between liver biopsy and transient elastography using the FibroScan XL probe. J Hepatol 56: 564-570, 2012. [DOI] [PubMed] [Google Scholar]


