Abstract
Purpose
To analyze trends in incidence, treatment, and survival of uveal melanoma in the United States from 1973 to 2013 using the Surveillance, Epidemiology, and End Results database.
Materials and Methods
Patients were identified using International Classification of Disease for Oncology codes: C69.3 (choroid), C69.4 (ciliary body and iris), and C69.2 (retina). Trends in age-adjusted incidence, treatment (surgery or radiation), and 5-year relative survival were calculated.
Results
There were 4,999 cases of uveal melanoma. The majority (97.8%) were reported by hospital inpatient/outpatient clinics. Histopathologic confirmation was available in 67.8%. The mean age-adjusted incidence was 5.2 per million (95% CI 5.0–5.4). When the incidence was standardized for race, a small but statistically significant (p < 0.05) annual percentage change of 0.5% was detected in Whites. There was a decline in patients treated with surgery alone (94.2% from 1973 to 1975 vs. 24.7% from 2012 to 2013). A corresponding increase was observed in radiation as primary treatment selection (1.3% from 1973 to 1975 vs. 68.3% from 2012 to 2013). No change in the 5-year relative survival (80.9%) was observed.
Conclusions
The age-adjusted incidence of uveal melanoma has remained stable with a minor increase in Whites. Despite a shift towards globe-preserving treatment, there has not been a concomitant improvement in survival.
Keywords: Uveal melanoma, Incidence, Treatment, Survival
Introduction
The Surveillance, Epidemiology, and End Results (SEER) Program of the National Cancer Institute (NCI) is one of the most authoritative sources of cancer-related statistics in the United States [1]. SEER is an important source for analysis of longitudinal epidemiological trends of uveal melanoma, and the only source of statistics that can be compared with certainty with future studies. This is critical, particularly at a time when newer treatments are evolving. Case ascertainment began on January 1, 1973, following the National Cancer Act of 1971. At present, there are 18 SEER registries that routinely collect data pertaining to patient demographics, tumor site, morphology, stage at diagnosis, treatment selection, and survival. The data collection program covers 28% of the US population (which is considered comparable to the general population), is updated annually, and is available free of charge to the public [2]. As of the November 2015 update, the database included 9,176,963 cases of cancer within the SEER catchment areas, which are estimated to have a 98% case ascertainment [1].
As with other annually published reports/updates of commonly observed cancers in the United States, we feel it is a high priority to establish baseline data for trends in uveal melanoma using population-based registries. This is the only way to keep a “pulse” on evolving cancer trends as we all work collectively to push the field forward. Since the initial publication of SEER database-derived results [3, 4], we have attempted to report 5-year updates [4], similar to annual updates of commonly observed cancers in the United States. In the present update, we analyze trends in age-adjusted incidence, changing spectrum of treatment, and effects on survival in uveal melanoma patients included in the SEER Program database from 1973 to 2013.
Materials and Methods
The National Cancer Institute SEER database file was accessed and analyzed via the SEER*Stat software (version 8.3.2) in client-server mode. This software provided all needed tools to calculate age-adjusted incidence and 5-year relative survival of uveal melanoma, and trends in treatment [1]. SEER cancer statistics are collected according to the place of an individual's residence, rather than by treatment center location. This is important, as large, tertiary referral centers routinely see the majority of patients with uveal melanoma, leading to a potential source of geographic data collection bias. However, as patients travel from all over the US to visit these centers for treatment, data collection performed by place of residence avoids this kind of bias.
Incidence was calculated using a two-step process. First, age-specific rates were determined utilizing census estimates for the US population and the 41-year period of time studied (thus adjusting for population increases). Second, age-specific rates were then age-adjusted to a “standard” population and expressed per million population. In the present study, we followed the lead of the National Cancer Institute (NCI) and others who are currently reporting statistics by adjusting to the US population in the year 2000. This corrects for fluctuations in age distribution of the population over time.
While the SEER database currently includes 18 cancer registries, statistics for this study were calculated only from the original core 9 SEER registries that were present since 1973. Due to the long-term trend analysis that the National Cancer Institute undertakes, it is only possible to include these original core 9 SEER registries for the kind of longitudinal analysis performed here. This was done purposefully in order to avoid the kind of bias that would be introduced by including newer centers lacking statistical data from the earlier time period.
Cases of ocular and adnexal melanoma were identified using the International Classification of Disease for Oncology (ICD-O-2) codes for both morphology (melanoma: 8,720–8,790) and site (eye and adnexa: C69.0-9.9) [5]. The subset of primary uveal melanoma was further identified by site: choroid, ciliary body, iris, and “retina” (C69.2-C69.4). A total of 1.3% of ocular melanoma were coded as arising from the “retina”, which is an exceptionally rare site for primary melanoma [6]. As “retinal melanoma” most likely represented miscoding of uveal melanoma, these cases were included in the analysis. Ocular melanoma coded as “site nonspecific” were excluded. Specific information relating to tumor size was not analyzed as the SEER data were either incomplete or lacked uniformity, precluding meaningful interpretation. For example, greatest tumor diameter is not available for all the years since 1973. This type of data starts in 1988, and the “system” of recording these data changed after 2000.
For example, the 95% confidence interval (CI) was calculated using the method developed by Chiang [7]. For the analysis of treatment selection, individuals were grouped based upon primary therapy (surgery or radiation). Overall trends in the number of patients treated with surgery alone, radiation alone, both, or unknown/no treatment were determined. While treatment trends would ideally be analyzed according to the specific form of radiation (e.g., plaque brachytherapy vs. proton beam), these data are only available from 1987 onwards. Furthermore, these data exist in various forms and are cumbersome to interpret. With the current methodology, our goal was to analyze overall longitudinal trends, in order to get the “big picture” of the past and present state of treatment.
For the analysis of survival, relative survival rates were used. In other words, no adjustment was made using the death certificate “cause of death.” Instead, relative survival is a net survival measure representing cancer survival in the absence of other causes of death. Relative survival is defined as the ratio of the proportion of observed survivors in a cohort of cancer patients to the proportion of expected survivors in a comparable set of cancer-free individuals. The 5-year relative survival was determined for each 3-year time interval between 1973 and 2013, except for the last interval (2012–2013) for which there was insufficient follow-up. Survival calculations were made using the life table method and US census life expectancy tables for gender and age [8]. This research complied with the guidelines for human studies.
Results
During the 41-year time period between 1973 and 2013, there were a total of 6,062 cases of melanoma identified from the SEER database as arising from the eye and the ocular adnexa. Of these, there were 4,999 cases (82.5%) of primary uveal melanoma (site coded as choroid, ciliary body, iris, or “retina”). There were 600 cases (9.9%) of melanoma arising from sites including the conjunctiva, cornea, orbit, or other overlapping categories. A total of 463 cases (7.6%) were from a nonspecified site and such cases were excluded from further analysis (Table 1). There was a nearly equal distribution of primary uveal melanoma by gender (males: 52.3%, females: 47.7%). The median age at diagnosis was 62 years (range: 5–100 years). Laterality was also similar (right eye: 49.5%, left eye: 49.1%, unknown: 1.4%). The majority (98.0%) of cases of uveal melanoma occurred in the White population. Only 0.6% of cases were reported in the Black population, and in the remaining 1.4%, race was unknown. In most (87.5%) individuals, there was no prior reported malignancy; a history of cancer, preceding the diagnosis of uveal melanoma, was recorded in only 12.5% of individuals (Table 2). The largest percentage (97.8%) was reported from hospital inpatient units or hospital-based outpatient clinics. Histopathologic confirmation of diagnosis was available in 67.8% of cases. During the time period from 2001 to 2013, the percent of tumors with histopathologic confirmation of diagnosis decreased to 49.5% (Table 3).
Table 1.
Uveal melanoma from 1973 to 2013: site and morphology
| Site | Frequency, n | Overall, % | 1973–1986, % | 1987–2000, % | 2001–2013, % |
|---|---|---|---|---|---|
| C69.0-Conjunctiva | 358 | 5.9 | 3.9 | 6.3 | 7.0 |
| C69.1-Cornea, NOS | 32 | 0.5 | 0.4 | 0.9 | 0.4 |
| C69.2-Retina | 77 | 1.3 | 1.9 | 1.1 | 1.0 |
| C69.3-Choroid | 4,077 | 67.3 | 58.4 | 65.0 | 75.6 |
| C69.4-Ciliary body and iris | 845 | 13.9 | 18.9 | 14.2 | 10.1 |
| C69.5-Lacrimal gland | 4 | 0.1 | 0.0 | 0.1 | 0.1 |
| C69.6-Orbit, NOS | 70 | 1.2 | 1.3 | 1.4 | 0.9 |
| C69.8-Overlapping lesion | 136 | 2.2 | 2.6 | 3.3 | 1.1 |
| C69.9-Eye, NOS | 463 | 7.6 | 12.7 | 7.8 | 3.8 |
| Total | 6,062 | 100.0 | 100.0 | 100.0 | 100.0 |
All ocular melanomas were identified by site (C69.0–C69.9) and morphology (8,720–8,790). Ciliary body, choroidal, and “retinal” tumors were considered a uveal melanoma (n = 4,999). NOS, not otherwise specified.
Table 2.
Uveal melanoma 1973–2013: general demographic data1
| Aspect | Distribution |
|---|---|
| Gender, % | |
| Male | 52.3 |
| Female | 47.7 |
| Age at diagnosis, years | |
| Range | 5–100 |
| Median | 62 |
| Laterality, % | |
| Right eye | 49.5 |
| Left eye | 49.1 |
| Unknown | 1.4 |
| Race, % | |
| White | 98.0 |
| Black | 0.6 |
| Other/unknown | 1.4 |
| Prior malignancy, % | |
| Present | 12.5 |
| Absent | 87.5 |
Microscopic (histopathology or cytology) confirmation of diagnosis was available in 67.8%.
Table 3.
Uveal melanoma 1973–2013: reporting distribution
| Reporting source (uveal melanoma) | Overall |
1973–1986, % | 1987–2000, % | 2001–2013, % | |
|---|---|---|---|---|---|
| frequency, n | % | ||||
| Hospital inpatient/outpatient or clinic | 4,891 | 97.8 | 99.6 | 98.4 | 96.2 |
| Laboratory only (hospital or private) | 34 | 0.7 | 0.1 | 0.7 | 1.1 |
| Nursing/convalescent home/hospice | 1 | 0.0 | 0.0 | 0.1 | 0.0 |
| Other hospital outpatient/surgery centera | 34 | 0.7 | 0.0 | 0.0 | 1.7 |
| Physician's office | 29 | 0.6 | 0.3 | 0.8 | 0.6 |
| Radiation/medical oncology centera | 10 | 0.2 | 0.0 | 0.0 | 0.5 |
| Total | 4,999 | 100.0 | 100.0 | 100.0 | 100.0 |
2006 onwards.
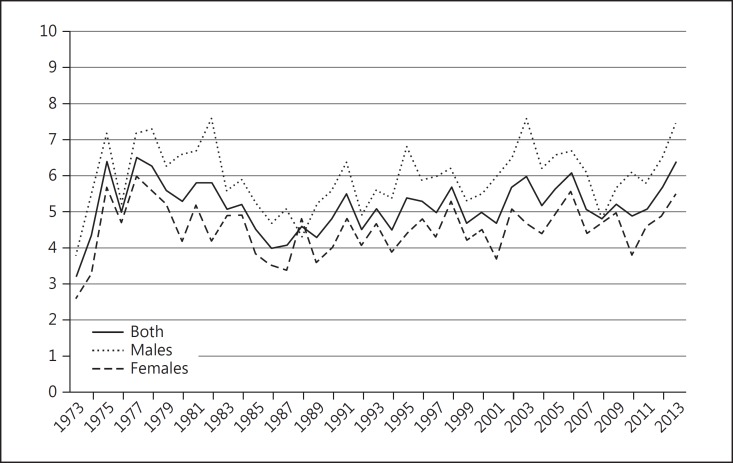
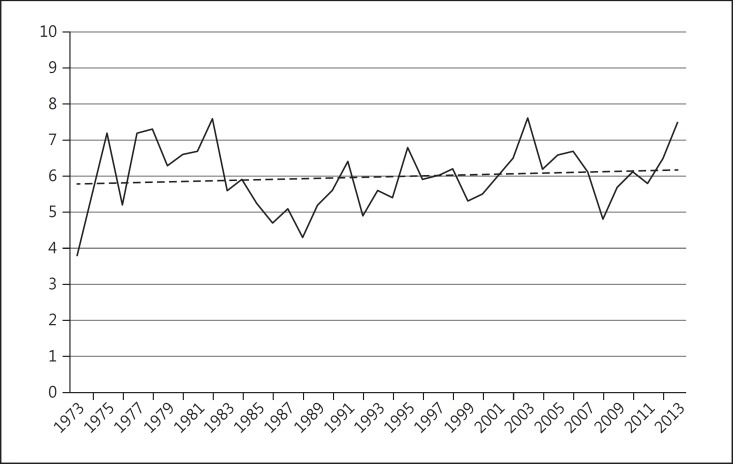
The overall mean age-adjusted incidence of primary uveal melanoma in the US over the 41-year period from 1973 to 2013 was 5.2 per million population (95% CI 5.0–5.4). Males had a significantly higher age-adjusted incidence of 6.0 per million population (95% CI 5.7–6.3) compared to females where the average age-adjusted incidence was 4.5 (95% CI 4.3–4.7). The overall age-adjusted incidence of uveal melanoma remained relatively stable between 1973 and 2013 (Fig. 1). Although the overall incidence remained stable, when the data were standardized by race in order to take into account population-based changes in racial proportions, a small but statistically significant (p < 0.05) annual percentage change of 0.5% was detected in Whites alone (Fig. 2).
Fig. 1.
Age-adjusted incidence of uveal melanoma, 1973–2013. Number of persons per million population (y axis) adjusted to the US 2000 population (uveal melanoma C69.2-C69.4 only).
Fig. 2.
Age-adjusted incidence of uveal melanoma, 1973–2013, for Whites only. Number of persons per million population (y axis) adjusted to US 2000 population (uveal melanoma C69.2-C69.4 only). Since 1973, the APC (average annual percent change) was 0.5% (p < 0.05). (Percent changes were calculated using 1 year for each end point; APCs were calculated using the weighted least squares method.)
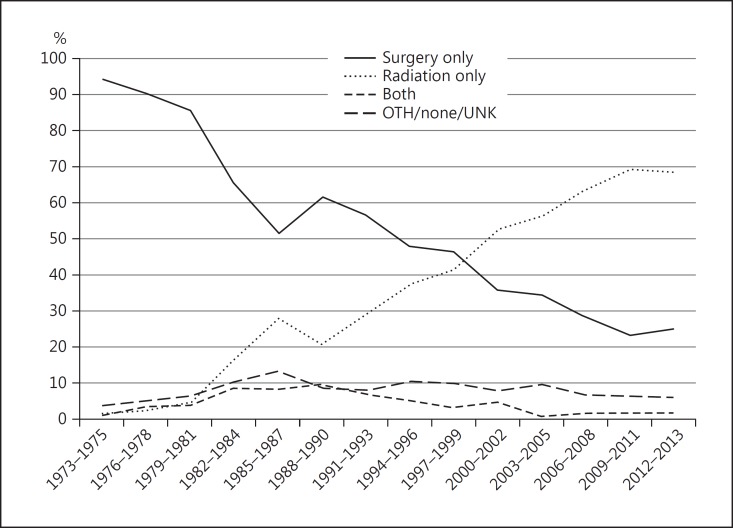
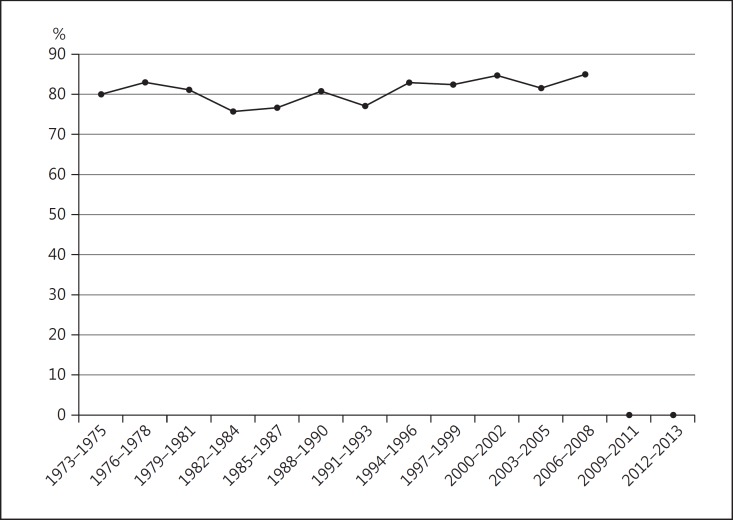
During the years 1973–2013, there was a progressive decline in the percentage of patients treated with surgery alone (94.2% from 1973 to 1975 vs. 24.7% from 2012 to 2013). Correspondingly, there was an increase in the percentage treated with radiation alone (1.3% from 1973 to 1975 vs. 68.3% from 2012 to 2013). No significant change was observed in the number of cases of uveal melanoma treated with both therapies, or with no/unknown treatment (Fig. 3). The 5-year relative survival rate (80.9%) remained stable during the period from 1973 to 2008 (5-year follow-up data are not yet available for 2009–2013) (Fig. 4).
Fig. 3.
Trends in treatment of uveal melanoma, 1973–2013. Percentage of persons treated by each modality (y axis). OTH, other; UNK, unknown.
Fig. 4.
5-year relative survival with uveal melanoma (y axis), 1973–2008.
Discussion
The SEER registries provide population-based data which are more representative of true patterns in disease incidence, treatment, and survival compared to published reports (which are predominantly retrospective) and originate from single centers with many inherent biases. The present 5-year update confirms that the average age-adjusted incidence of uveal melanoma in the US has remained stable (5.2 cases per million population) over the past 4 decades. There has been a sharp decline in surgery (predominantly enucleation) as primary therapy, and a corresponding rise in the percentage of individuals treated with radiation alone (plaque brachytherapy and proton beam). In spite of evolving trends towards eye-sparing treatment, the 5-year relative survival (80.9%) has not changed over the past 4 decades.
Case identification is dependent upon accurate diagnosis and coding practices. Modern ancillary imaging techniques have improved our ability to diagnose uveal melanoma. Additionally, with widespread implementation of the electronic medical record the coding accuracy has increased. These trends are reflected in the decreasing percentage of melanoma coded as site nonspecified: 12.7% from 1973 to 1986 versus 7.8% from 1987 to 2000, and only 3.8% from 2001 to 2013. Similarly, there has been a progressive decrease in the percentage of histopathologically confirmed cases of uveal melanoma: 89.0% from 1973 to 1986, compared to 73.0% from 1987 to 2000, and only 49.5% from 2001 to 2013. The diagnosis of uveal melanoma is largely clinical. Histopathology from enucleated eyes confirms that the accuracy of clinical diagnosis exceeds 99% [9]. Given the recent trend to perform prognostic fine-needle aspiration biopsy, it will be interesting to observe whether the number of histopathologically confirmed cases increases over time [10].
The overall age-adjusted incidence (expressed as individuals per million population) of uveal melanoma has remained stable between 1973 and 2013. Compared to prior SEER reports on uveal melanoma, there was no significant change in the overall age-adjusted incidence from 1973 to 1997 (5.0, 95% CI 4.7–5.4, adjusted to the 2000 US standard population) or 1973–2008 (5.1, 95% CI 4.8–5.3, adjusted to the 2000 US standard population) [3, 4]. However, there continues to be a statistically significant gender-based difference in the incidence (males: 6.0, 95% CI 5.7–6.3 and females: 4.5, 95% CI 4.3–4.7). Although overall incidence has remained unchanged, when analyzed for “Whites only,” a small but statistically significant annual percentage change of 0.5% was detected (p < 0.05).
Treatment selection demonstrated a steady rise in the use of radiation alone, predominantly plaque brachytherapy and proton beam (rather than surgery/enucleation) since the late 1980s. This trend coincided with the Collaborative Ocular Melanoma Study where plaque brachytherapy was offered as an alternative to enucleation for medium-sized tumors. Consistent with Collaborative Ocular Melanoma Study data showing no survival advantage of enucleation over brachytherapy, radiation has continued to predominate as a primary therapy [11]. SEER does not consistently collect specific data regarding type of radiation treatment (i.e., plaque brachytherapy vs. proton beam) or surgery (e.g., enucleation vs. iridocyclectomy) and it is therefore not possible to meaningfully analyze specific treatment trends pertaining to each form of radiation or surgery, respectively. Similarly, SEER does not capture data related to the use of laser therapies, such as transpupillary thermotherapy, which, due to its controversial nature, is used in a minority of cases as primary treatment.
By using relative survival rate instead of all-cause or tumor-specific mortality, the need to identify the exact cause of death is obviated. The present study continues to show that there has been no appreciable change in the 5-year relative survival (80.9%) during the past 4 decades from 1973 to 2013. In recent years, prognostication techniques have evolved, allowing us to become adept at differentiating high-metastatic risk from low-metastatic risk uveal melanoma [12, 13]. Alongside this knowledge, there has been a surge of adjuvant treatment trials for high-risk tumors [14]. In 1973, certainly no such trials existed; however, at present, using search terms such as “uveal melanoma” and “adjuvant” on the https://www.clinicaltrials.gov website yields over 20 entries related to such clinical studies.
In summary, the incidence (5.2 per million population) of uveal melanoma in the US has not changed significantly between 1973 and 2013. While an increasing proportion of patients are being treated with eye-preserving therapies, the 5-year relative survival (80.9%) has remained stagnant. As newer potential therapies emerge, such as immunotherapies and small molecule inhibitors, there will be a continued need to monitor trends treatment selection and survival in uveal melanoma. SEER is the best source of longitudinal data for uveal melanoma that can be meaningfully compared with future studies. Ultimately, the goal is to demonstrate an improvement from the robust baseline characterized in this report using cancer data from the SEER Program database.
Statement of Ethics
The study complied with the guidelines for human studies and animal welfare regulations. The subject gave informed consent, and the study protocol was approved by the institute's committee on human research.
Disclosure Statement
The authors have no relevant conflicts of interest to declare.
Acknowledgement
This work was supported by a Research to Prevent Blindness Challenge Grant, Department of Ophthalmology, Cleveland Clinic Lerner College of Medicine.
References
- 1.Surveillance, Epidemiology, and End Results (SEER) Program ( www.seer.cancer.gov). SEER*Stat Database: Incidence - SEER 18 Regs Research Data + Hurricane Katrina Impacted Louisiana Cases, Nov 2015 Sub (1973–2013).
- 2. https://seer.cancer.gov/about/factsheets/SEER_brochure.pdf.
- 3.Singh AD, Topham A. Incidence of uveal melanoma in the United States: 1973–1997. Ophthalmology. 2003;110:956–961. doi: 10.1016/S0161-6420(03)00078-2. [DOI] [PubMed] [Google Scholar]
- 4.Singh AD, Turell ME, Topham AK. Uveal melanoma: trends in incidence, treatment, and survival. Ophthalmology. 2011;118:1881–1885. doi: 10.1016/j.ophtha.2011.01.040. [DOI] [PubMed] [Google Scholar]
- 5.Percy C, van Holten V, Muir C, editors. International Classification for Diseases for Oncology. ed 2. Geneva: World Health Organization; 1990. [Google Scholar]
- 6.Freitag SK, Eagle RC, Jr, Shields JA, Duker JS, Font RL. Melanogenic neuroectodermal tumor of the retina (primary malignant melanoma of the retina) Arch Ophthalmol. 1997;115:1581–1584. doi: 10.1001/archopht.1997.01100160751015. [DOI] [PubMed] [Google Scholar]
- 7.Chiang C. Standard error of the age-adjusted rate. Vital Stat Spec Rep. 1961;47 [Google Scholar]
- 8.Ederer F, Axtell LM, Cutler SJ. The relative survival rate: a statistical methodology. Natl Cancer Inst Monogr. 1961;6:101–121. [PubMed] [Google Scholar]
- 9.Collaborative Ocular Melanoma Study Group Accuracy of diagnosis of choroidal melanomas in the Collaborative Ocular Melanoma Study: COMS report No. 1. Arch Ophthalmol. 1990;108:1268–1273. doi: 10.1001/archopht.1990.01070110084030. [DOI] [PubMed] [Google Scholar]
- 10.Singh AD, Medina CA, Singh N, Aronow ME, Biscotti CV, Triozzi PL. Fine-needle aspiration biopsy of uveal melanoma: outcomes and complications. Br J Ophthalmol. 2016;100:456–462. doi: 10.1136/bjophthalmol-2015-306921. [DOI] [PubMed] [Google Scholar]
- 11.Diener-West M, Earle JD, Fine SL, Hawkins BS, Moy CS, Reynolds SM, Schachat AP, Straatsma BR, Collaborative Ocular Melanoma Study Group The COMS randomized trial of iodine 125 brachytherapy for choroidal melanoma, III: initial mortality findings. COMS Report No. 18. Arch Ophthalmol. 2001;119:969–982. doi: 10.1001/archopht.119.7.969. [DOI] [PubMed] [Google Scholar]
- 12.Field MG, Harbour JW. Recent developments in prognostic and predictive testing in uveal melanoma. Curr Opin Ophthalmol. 2014;25:234–239. doi: 10.1097/ICU.0000000000000051. [DOI] [PMC free article] [PubMed] [Google Scholar]
- 13.Singh AD. Prognostication of uveal melanoma: a work in progress. JAMA Ophthalmol. 2016;134:740–741. doi: 10.1001/jamaophthalmol.2016.1070. [DOI] [PubMed] [Google Scholar]
- 14.Dacarbazine and recombinant interferon alfa-2b in treating patients with primary uveal melanoma with genetic imbalance. ClinicalTrials.gov identifier NCT01100528. http://clinicaltrials.gov/ct2/show/NCT01100528


