

Abstract
Motivation: Several efficient gene–gene interaction tests have been developed for unrelated case–control samples in genome-wide association studies (GWAS), making it possible to test tens of billions of interaction pairs of single-nucleotide polymorphisms (SNPs) in a reasonable timeframe. However, current family-based gene–gene interaction tests are computationally expensive and are not applicable to genome-wide interaction analysis.
Results: We developed an efficient family-based gene–gene interaction test, GCORE, for trios (i.e. two parents and one affected sib). The GCORE compares interlocus correlations at two SNPs between the transmitted and non-transmitted alleles. We used simulation studies to compare the statistical properties such as type I error rates and power for the GCORE with several other family-based interaction tests under various scenarios. We applied the GCORE to a family-based GWAS for autism consisting of approximately 2000 trios. Testing a total of 22 471 383 013 interaction pairs in the GWAS can be finished in 36 h by the GCORE without large-scale computing resources, demonstrating that the test is practical for genome-wide gene–gene interaction analysis in trios.
Availability and implementation: GCORE is implemented with C ++ and is available at http://gscore.sourceforge.net.
Contact: rchung@nhri.org.tw
Supplementary information: Supplementary data are available at Bioinformatics online.
1 Introduction
Genome-wide association studies (GWAS) have been widely used in complex disease studies to identify the association of single-nucleotide polymorphisms (SNPs) with the disease. Although GWAS have successfully identified many significant SNPs, most SNPs exhibit modest effects on the disease and can only explain a small proportion of the heritability of the disease (Manolio et al., 2009). As complex diseases are caused by the joint effects of multiple genes, gene–gene interactions may also play an important role in disease etiology. Significant gene–gene interactions have been identified for several diseases, such as Alzheimer’s disease, autism and schizophrenia (Ebbert et al., 2014; Gasso et al., 2010; Ma et al., 2005). Therefore, it is important to develop powerful and efficient gene–gene interaction methods for GWAS.
Two major challenges are faced when performing interaction analysis in GWAS. The first is the computational burden resulting from tens of billions of tests when considering all possible pairwise interactions between SNPs. Several computationally efficient algorithms have been developed for pairwise interaction analysis for case–control GWAS, such as the fast epistasis test implemented in PLINK (Purcell et al., 2007), SNPHarvester (Yang et al., 2009), SNPRuler (Wan et al., 2010), BOOST (Wan et al., 2010) and TEAM (Zhang et al., 2010). The second challenge is the multiple-testing correction burden resulting from the extremely large number of tests. To achieve genome-wide significance for these interaction tests, a large sample size or strong interaction effects between SNPs are required.
Several gene–gene interaction methods have also been developed for family-based association studies. For families with at least one affected and unaffected child, conditional logistic regression (CLR) and logistic regression based on generalized estimating equations (GEE) (Zeger et al., 1988) can be used for testing interactions (Hancock et al., 2007). CLR has further been extended to accommodate families with one affected child and two parents (i.e. trios), using the affected offspring as a case and ‘pseudocontrols’ created based on the parental genotypes (Cordell et al., 2004). UNPHASED is a likelihood ratio test that can be used for testing interactions by comparing the likelihoods of genotypes given the disease status with and without modeling the interaction (Dudbridge, 2008). Multifactor Dimensionality Reduction (MDR) (Ritchie et al., 2001), a machine-learning method developed for case–control studies, has been extended to several family-based interaction tests, such as MDR-PDT (Martin et al., 2006), PGMDR (Chen et al., 2011) and FAM-MDR (Cattaert et al., 2010). A summary of tools available for gene–gene interaction analysis is shown in Table 1 and a more detailed overview of these tools can be found in the Supplementary Materials. Also more comprehensive reviews of gene–gene interaction methods can be found in some review papers (Cordell, 2009; Niel et al., 2015). As shown in Table 1, current family-based interaction methods are applicable to only candidate gene regions. Iterative algorithms such as the Newton–Raphson method are used in parameter estimations in CLR or GEE, as well as in the likelihood ratio tests. MDR-based approaches use cross-validation for model evaluation and permutations to approximate the distributions of the test statistics. These algorithms require intensive calculations. Hence, these tests would not be applicable for analyzing genome-wide interactions with tens of billions of tests.
Table 1.
Summary of available gene–gene interaction tools
| Toola | Sample type accepted by the tool | Genome-wide/Candidate regionb |
|---|---|---|
| BEAM | Case–control | Genome-wide |
| BOOST | Case–control | Genome-wide |
| PLINK | Case–control, Case-only | Genome-wide |
| MDR | Case–control, DSP | Candidate region |
| Random Forest | Case–control | Genome-wide |
| SNPHarvester | Case–control | Genome-wide |
| SNPRuler | Case–control | Genome-wide |
| TEAM | Case–control | Genome-wide |
| GEE | Family (trios, DSPs) | Candidate region |
| UNPHASED | Family (nuclear families) | Candidate region |
| MDR-PDT | Family (nuclear families) | Candidate region |
| PGMDR | Family (general pedigrees) | Candidate region |
aCitations can be found in the Supplementary Materials.
bApplicable to genome-wide scale or only to candidate regions.
We developed an efficient gene–gene interaction test which considers correlations in trios (GCORE). The GCORE is extended from the fast epistasis test in PLINK. The GCORE statistic compares interlocus correlations at two SNPs between the transmitted and non-transmitted alleles. We used theoretical distributions to model the statistic and calculate the variance and covariance. Thus, the test does not use any iterative algorithms, ensuring that the test is fast and applicable to genome-wide interaction studies. We performed a comprehensive simulation study to evaluate the type I error rates for the GCORE and other gene–gene interaction tests capable of analyzing family data with available software, including GEE, UNPHASED and MDR-PDT. Simulations were also used to compare the power of the GCORE with the three tests under various scenarios. Our simulation results suggest that the GCORE can be used as a screening tool to efficiently identify the potential pairs of SNPs with interaction effects, and other tests with higher power such as the likelihood ratio test implemented in UNPHASED can be further used to evaluate the significance of the SNP pairs. Finally, we applied the GCORE to a family-based GWAS for autism to screen all possible pairs of SNPs within genes, and UNPHASED was used to further test the pairs of SNPs identified by the GCORE.
2 Methods
We first reviewed the PLINK (Purcell et al., 2007) interaction statistic in the Supplementary Materials and then introduced the GCORE test statistic.
2.1 The GCORE statistic
Assume we have n trios, and we are testing the interaction for two SNPs , with alleles A and a, and , with alleles B and b. Here we loosely define a haplotype as a set of alleles at the two SNPs (e.g. AB, Ab, aB or ab), where the two SNPs can be on different chromosomes.
Similar to the Transmission Disequilibrium Test (TDT) (Spielman et al., 1993), we calculate the transmitted (T) and non-transmitted (NT) haplotype statistics, as shown in Table 2. Each parent has two haplotypes, one that is transmitted and one that isn’t. In Table 2, let each cell count be the number of parents who transmitted a haplotype and did not transmit another haplotype to the affected child. For example, is the number of parents with the transmitted haplotype AB and the non-transmitted haplotype AB. Since the sum of all cell counts is 2n and Table 2 includes all possible outcomes of the parental haplotypes, the cell counts in Table 2 follow a multinomial distribution. In order to calculate the odds ratios for the T and NT statistics, Table 2 is reorganized into 2 2 tables, shown in Tables 3 and 4, by taking the marginal count of the T or NT statistics for each haplotype. The T and NT statistics are used as cases and controls, respectively, in families.
Table 2.
T (transmitted) and NT (non-transmitted) statistics for two SNPs
| NT | T |
Total | |||
|---|---|---|---|---|---|
| AB | Ab | aB | ab | ||
| AB | n11 | n12 | n13 | n14 | n11+ n12+ n13+ n14 |
| Ab | n21 | n22 | n23 | n24 | n21+ n22+ n23+ n24 |
| aB | n31 | n32 | n33 | n34 | n31+ n32+ n33+ n34 |
| ab | n41 | n42 | n43 | n44 | n41+ n42+ n43+ n44 |
| Total | n11+ | n12+ | n13+ | n14+ | |
| n21+ | n22+ | n23+ | n24+ | 2n | |
| n31+ | n32+ | n33+ | n34+ | ||
| n41 | n42 | n43 | n44 | ||
Table 3.
T (transmitted) statistics for two SNPs
| Case |
||
|---|---|---|
| A | a | |
| B | T: n11+ n21+ n31+ n41 | T: n13+ n23+ n33+ n43 |
| b | T: n12+ n22+ n32+ n42 | T: n14+ n24+ n34+ n44 |
Table 4.
NT (non-transmitted) statistics for two SNPs
| Control |
||
|---|---|---|
| A | a | |
| B | NT: n11+ n12+ n13+ n14 | NT: n31+ n32+ n33+ n34 |
| b | NT: n21+ n22+ n23+ n24 | NT: n41+ n42+ n43+ n44 |
Based on Tables 3 and 4, the odds ratios between the two SNPs, and , for cases (i.e. T) and controls (i.e. NT) can be calculated as follows:
| (1) |
| (2) |
Similar to the PLINK approach, the GCORE statistic for the gene–gene interaction test compares the difference in the log odds ratios between cases and controls. Assume that and are the sample estimators for the odds ratios ORcase and ORcontrol, respectively. The GCORE statistic G is calculated as follows:
| (3) |
Under the null hypothesis that there is no interaction between the two SNPs, when the two SNPs are in LE. When there is a correlation between alleles at the two SNPs, which can be caused by linkage disequilibrium (LD) or population stratification, under the null. Therefore, under the null, the GCORE statistic G follows a normal distribution with a mean of 0 and a standard deviation of 1. The PLINK statistic ZPLINK was designed for unrelated case–control data. Thus, the variance of the difference in the two log odds ratios is the sum of the variance for the individual log odds ratios. However, the odds ratios in the GCORE statistic are statistically correlated due to the correlation in families. Thus, the covariance between the two log odds ratios is considered in calculating the variance for the difference in the two log odds ratios. A similar approach to calculating the covariance of two correlated odds ratios as proposed in Bagos (2012) was used. The detailed derivation for the variance is given in the Supplementary Materials.
Constructing Table 2 requires knowledge of the haplotype phases in the trios. There are several sophisticated and efficient haplotype phasing programs for trios, such as Merlin (Abecasis et al., 2002), BEAGLE (Browning and Browning, 2009) and SHAPEIT (Delaneau et al., 2012). One of these programs can be used to resolve the haplotype phases in the sample before running the GCORE. Moreover, the GCORE does not assume LE between SNPs, given that the haplotype phases are known, but assumes that the haplotype frequencies for haplotypes at the two SNPs are in HWE. Ueki and Cordell (2012) showed that inferring haplotype phases can introduce extra variance in the interaction statistic and ignoring the variance may cause the inflation of type I error rates for the interaction tests in unrelated case–control data. Because the variance of inferring haplotype phases is not considered in the GCORE statistic, we used simulations to evaluate the type I error rates for the GCORE test when the haplotype phases were inferred based on the tested family data.
2.2 Simulations
We conducted a comprehensive simulation study to evaluate the type I error rates and power for the GCORE and other interaction tests with available software, including the interaction test based on logistic regression with GEE, UNPHASED and MDR-PDT, under different scenarios.
We used the simulation tool, SeqSIMLA2 (Chung et al., 2015), to generate trios. Note that there are other simulation tools such as genomeSIMLA (Edwards et al., 2008) and simuPOP (Peng and Amos, 2008) that can simulate gene–gene interaction effects of SNPs on disease in families. However, SeqSIMLA2 is flexible of adopting external reference haplotypes simulated under realistic human genetic structures. To produce the reference haplotypes, we used HAPGEN2 (Su et al., 2011) to simulate 10 000 haplotypes in two randomly selected 5 MB regions on chromosomes 1 and 2 similar to the allele frequencies and LD structures in the Utah Residents (CEPH) with Northern and Western European Ancestry (CEU) samples from the 1000 Genomes Project (Consortium, 2010) data. Using the 10 000 haplotypes, SeqSIMLA2 performed gene dropping to generate trios, while trios with affected children were ascertained. We selected the following logistic function as the penetrance function in SeqSIMLA2:
| (4) |
where X1 and X2 are coding of genotypes based on an additive, dominant or recessive model for the two disease SNPs, determines the disease prevalence, λ1 and λ2 represent the effect sizes of the main effects for the disease SNPs, and λ3 determines the interaction effect for the two disease SNPs.
As the GCORE requires phased data, Merlin was used to resolve haplotype phases in the trios for all the simulation scenarios. The haplotypes corresponding to the most likely gene flow pattern were used (with the–best option in Merlin). The type I error rates were first evaluated by selecting two unlinked loci on the two chromosomes with no interaction effects on the disease. We considered six different sets of minor allele frequencies (MAFs) for the two selected SNPs (i.e. 0.05, 0.05; 0.05, 0.2; 0.1, 0.1; 0.2, 0.2; 0.2, 0.4; and 0.4, 0.4) and three different numbers of trios (i.e. 500, 1000 and 2000). When interactions for two SNPs on the same chromosome are tested, there may be LD between the two SNPs. Thus, we also tested two SNPs in different degrees of LD (LD measures r2= 0.1, 0.3, 0.5 and 0.7) to evaluate the type I error rates. The presence of main effects but no interaction effects may inflate the type I error rates for interaction tests (Hu et al., 2014; Ueki and Cordell, 2012). Therefore, we also evaluated the type I error rates in the presence of only main effects under different disease prevalences (0.01, 0.05 and 0.1) and disease models (recessive, additive and dominant models). We simulated a scenario where only one main effect () was present, and a scenario where two main effects were present for two different effect sizes (; ). Finally, we evaluated the type I error rates for the GCORE in the presence of population stratification. The details of the simulations can be found in the Supplementary Materials. Each type I error rate was calculated over 5000 replicates of simulated samples.
For the power comparisons, we simulated two unlinked loci on the two chromosomes that have interaction effects on the disease. The power was calculated with significance levels of 0.05 and 0.01 using 1000 replicates of samples. The parameters we considered in the power simulations included the number of trios (i.e. 500, 1000 and 2000), sets of MAFs (i.e. 0.2, 0.2; 0.2, 0.4; and 0.4, 0.4) and sets of effect sizes (i.e. ; ; ). The default settings in our power simulations were 1000 trios, MAFs of 0.2 and 0.2 for the two disease loci, and . We changed one parameter at a time for each of the scenarios.
3 Implementation
Although the calculation of the GCORE test statistic is fast, using the GCORE to test tens of billions of SNP pairs for a GWAS dataset remains very time consuming. Two strategies were used to improve the analysis efficiency in the GCORE program. POSIX Threads (Pthreads) in UNIX are used to parallelize the tests running on a machine with multiple cores. Moreover, the user can specify the chromosome pair so that the GCORE will test SNP pairs only between the specified chromosomes. Therefore, tests for different chromosome pairs can be performed on different computers, such as in a cluster environment.
At present, GEE is mostly implemented in R, which is not comparable for performance with the GCORE. Instead, we used the epistasis test in PLINK, which is also implemented in C ++ and is based on logistic regression, assuming that all samples were independent. The GEE procedure typically runs a regular logistic regression, assuming that all observations are independent, to obtain initial estimates of the parameters. Therefore, we expected that the run time for GEE implemented in C ++ would be longer than the PLINK epistasis test based on logistic regression. We estimated the run time for testing 4 500 000, 22 500 000 and 45 000 000 SNP pairs in 1000 trios on a LINUX server with Xeon 2.0 GHz CPU and 24 GB RAM. The run time for the GCORE included the time it took to run Merlin for resolving the haplotype phases, a Perl script to transform the Merlin output file to the GCORE input file, and the GCORE tests.
4 Results
4.1 Type I error rates
The type I error rates under different simulation scenarios are shown in Tables 5–7 and their 95% confidence intervals are shown in Tables S4, S6 and S7 in the Supplementary Materials. Table 5 shows the type I error estimates for different sets of MAFs at the two SNPs in 1000 trios at two significance levels ( = 0.05 and 0.01), while the type I error rates for different sets of MAFs in 500 and 2000 trios are shown in Table S5 in the Supplementary Materials. All of the tests had appropriate type I error rates that were close to the nominal levels when both SNPs had an MAF 0.2. However, the type I error rates for GEE and UNPHASED were inflated for SNP pairs with MAFs < 0.2, while the GCORE was conservative in these scenarios. This is not surprising as GEE, UNPHASED and the GCORE all rely on the asymptotic assumption of a normal or chi-square distribution for hypothesis testing, and the assumption can be violated for small samples. In contrast, MDR-PDT maintained appropriate type I error rates across the whole spectrum of MAFs in our simulations, as the permutation test is valid for small samples.
Table 5.
Type I error rates for testing two SNPs with different sets of minor allele frequencies in 1000 trios at the significant levels and
| MAF/Tests | GCORE | GEE | UNPHASED | MDR-PDT |
|---|---|---|---|---|
| MAF 0.05, 0.05 | ||||
| 0.0258 a | 0.1056 b | 0.0914 | 0.0482 | |
| 0.0006 | 0.0408 | 0.0280 | 0.0100 | |
| MAF 0.05, 0.2 | ||||
| 0.0484 | 0.0568 | 0.077 | 0.0500 | |
| 0.0086 | 0.0116 | 0.188 | 0.0114 | |
| MAF 0.1, 0.1 | ||||
| 0.0450 | 0.0560 | 0.0812 | 0.0508 | |
| 0.0092 | 0.0158 | 0.0234 | 0.0124 | |
| MAF 0.2, 0.2 | ||||
| 0.0460 | 0.0578 | 0.0494 | 0.0436 | |
| 0.0088 | 0.0108 | 0.0100 | 0.0094 | |
| MAF 0.2, 0.4 | ||||
| 0.0468 | 0.0552 | 0.0486 | 0.0480 | |
| 0.0094 | 0.0134 | 0.0108 | 0.0098 | |
| MAF 0.4, 0.4 | ||||
| 0.0504 | 0.0512 | 0.0426 | 0.0506 | |
| 0.0106 | 0.0114 | 0.0092 | 0.0136 |
aValues with italic form mean the upper bound of the 95% confidence intervals < the expected levels.
bValues marked as bold mean the lower bound of the 95% confidence intervals > the expected levels.
Table 6.
Type I error rates and their 95% confidence intervals for testing two SNPs with different degrees of LD in 1000 trios at the significant levels and .
| MAF/Tests | GCORE | GEE | UNPHASED | MDR-PDT |
|---|---|---|---|---|
| LD r2=0.7 | ||||
| 0.0668 a | 0.0496 | 0.4488 | 0.0484 | |
| 0.0146 | 0.0084 | 0.2282 | 0.0106 | |
| LD r2=0.5 | ||||
| 0.0588 | 0.0462 | 0.3510 | 0.0508 | |
| 0.0108 | 0.0082 | 0.1660 | 0.0098 | |
| LD r2=0.3 | ||||
| 0.0532 | 0.0486 | 0.2442 | 0.0478 | |
| 0.0114 | 0.0094 | 0.0840 | 0.0112 | |
| LD r2=0.1 | ||||
| 0.0520 | 0.0490 | 0.1126 | 0.0470 | |
| 0.0082 | 0.0090 | 0.0336 | 0.0080 |
aValues marked as bold mean the lower bound of the 95% confidence intervals > the expected levels.
Table 7.
Type I error rates and their 95% confidence intervals for testing two SNPs in the presence of main effects under an additive model with different disease prevalences
| Disease prevalence |
||||
|---|---|---|---|---|
| Test | 0.01 | 0.05 | 0.1 | |
| GCORE | 0.0508 | 0.0538 | 0.0526 | |
| GEE | 0.0544 | 0.0536 | 0.0460 | |
| UNPHASED | 0.0566 a | 0.0608 | 0.0548 | |
| GCORE | 0.0488 | 0.0538 | 0.0510 | |
| GEE | 0.0600 | 0.0606 | 0.0628 | |
| UNPHASED | 0.0588 | 0.0522 | 0.0578 | |
| GCORE | 0.0570 | 0.0660 | 0.0688 | |
| GEE | 0.1956 | 0.1788 | 0.1658 | |
| UNPHASED | 0.0612 | 0.0578 | 0.0616 | |
aValues marked as bold show the lower bound of the 95% confidence intervals > the expected levels.
Table 6 shows the type I error rates at different levels of LD between a pair of tested SNPs. GEE and MDR-PDT maintained appropriate type I error rates with different levels of LD. The GCORE maintained proper type I error rates when the LD was not strong (i.e. r2 = 0.3 and 0.1); however, the type I error rates for the GCORE can be inflated if the LD r2between the two SNPs is 0.5. On the other hand, UNPHASED is liberal for all levels of LD. Therefore, the GCORE and UNPHASED are suitable for testing SNP pairs that are not in LD.
Table 7 shows the type I error rates for the GCORE, GEE and UNPHASED when the SNPs have main effects but no interaction effects under an additive model. The results for the dominant and recessive models are shown in Table S8 in the Supplementary Materials. The type I error rate for MDR-PDT was not evaluated in this scenario as the null hypothesis for MDR-PDT includes the assumption that the two SNPs have no main effects (Edwards et al., 2010). If only one SNP had a strong main effect (λ1 = ln(2), λ2 = 0), the type I error rates for the GCORE and GEE were generally close to the 0.05 nominal level across different disease prevalences and disease models, while the type I error rates for UNPHASED were somewhat inflated. Moreover, the type I error rates for the three tests can be inflated when both SNPs have strong main effects (λ1 = ln(2), λ2 = ln(2)), particularly under the dominant model, and the degree of inflation increased with higher prevalence. The results were consistent with previous findings for unrelated cases and controls that strong main effects of the SNPs being tested can inflate the type I error rates for interaction tests based on logistic regression or comparing odds ratios (Hu et al., 2014). In the presence of population stratification, the GCORE maintained proper type I error rates, as shown in Table S9 in the Supplementary Materials.
4.2 Power
Figure 1 shows the power comparison under different interaction effect sizes, numbers of trios and MAFs. Similar power patterns were observed in these scenarios. That is, MDR-PDT had the highest power, followed closely by UNPHASED. The power for the GCORE was lower than the power for MDR-PDT and UNPHASED, but higher than GEE. As expected, the power for all methods increased with larger effect size, larger number of trios and higher MAFs.
Fig. 1.
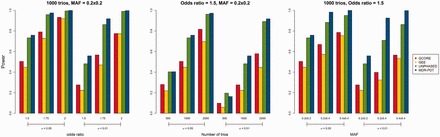
Power comparison for the GCORE, GEE, UNPHASED and MDR-PDT under different scenarios at the significant levels of 0.05 and 0.01 (Color version of this figure is available at Bioinformatics online.)
4.3 Performance comparison
Figure 2 shows the run time plot for the GCORE and PLINK. A clear advantage of the GCORE in terms of run time over PLINK can be observed in the plot. For example, the total run time of the GCORE for testing 4 500 000 pairs of SNPs was about 11 min, while the run time for PLINK was about 4 h 12 min. Therefore, the GCORE ran 20 times more efficient than a logistic regression based test for interaction. As GEE requires more time than the logistic regression test, the GCORE is expected to run more than 20 times faster than GEE. Moreover, when the GCORE tests were performed in parallel using 10 cores, the run time was 2 min and 22 s for testing the same number of SNP pairs as before. We did not compare the run time of the GCORE with UNPHASED, which is also implemented in C ++, because of its computational complexity. For example, UNPHASED required an hour and 10 min for testing only 1000 pairs of SNPs in 1000 trios.
Fig. 2.

Comparison of run time between GCORE and PLINK (Color version of this figure is available at Bioinformatics online.)
4.4 A two-stage genome-wide pairwise interaction strategy
A two-stage approach has been described in the PLINK user manual for a genome-wide gene–gene interaction study for case–control GWAS. That is, the PLINK fast epistasis test can be used as a screening tool for identifying a potential subset of interaction pairs of SNPs using a less stringent p-value threshold. Then a standard test such as the test based on logistic regression can be used to test the subset of SNPs, and the significance of the tests is determined based on the genome-wide significance threshold. Similarly, the GCORE can be used as a screening tool for a family-based genome-wide interaction study. The results from our power studies suggest that MDR-PDT is the most powerful test across different scenarios. However, a large number of permutations is required in MDR-PDT to obtain a small p-value (e.g. 10−10). In contrast, the p-value in UNPHASED is rapidly calculated from a chi-square distribution. Because UNPHASED shows comparable power to MDR-PDT in several scenarios, UNPHASED is suitable to be used in the second stage to evaluate the significant pairs identified by the GCORE. Figure 3 shows the power comparisons between the two-stage strategy using different P-value thresholds and UNPHASED. More details about the simulations can be found in the Supplementary Materials. As seen in the Figure, the power for the two-stage strategy based on the GCORE P-value threshold of 10−3 is close to the power for UNPHASED. However, the power for the two-stage strategy using the GCORE P-value threshold of 10−5 can be significantly lower than the power for UNPHASED.
Fig. 3.

Power comparison of the two-stage strategy with UNPHASED. UNPHASED_1e-3, UNPHASED_1e-4 and UNPHASED_1e-5 are the two-stage strategies using the GCORE P-value thresholds of 10-3, 10-4 and 10-5, respectively (Color version of this figure is available at Bioinformatics online.)
4.5 Real data analysis
We applied the two-stage genome-wide interaction analysis strategy to a family-based GWAS for autism from the Autism Genome Project (AGP) (Anney et al., 2010; Autism Genome Project et al., 2007; Pinto et al., 2010). The dataset contained nuclear families with autism spectrum disorder (ASD) sampled in two stages from Europe and North America. The stage 1 dataset consisted of approximately 1400 ASD families genotyped on the Illumina Infinium 1 M-single SNP array, and the stage 2 dataset consisted of 1301 ASD families genotyped on either the Illumina Infinium 1 M-single or the 1 M-duo array. The data from both stages were combined in our analysis. The same quality control (QC) procedures as described in Anney et al. (Anney et al., 2010) were applied to the data. Because UNPHASED can be a liberal test for testing SNP pairs with MAFs < 0.2, we removed the SNPs with MAFs < 0.2. After the QC, there were 1979 trios and 447 187 SNPs. We restricted our analysis to SNPs within genes. The hg18 gene annotations were downloaded from the UCSC genome browser website. Interaction tests for all possible pairs of SNPs that were not in LD between any two genes were performed using the GCORE, which resulted in 22 471 383 013 tests, and the number of independent tests was estimated as 738 771 507 using the method described in Babron et al. (Babron et al., 2015). As the simulation results suggest that the power for the two-stage strategy using the GCORE P-value threshold of 10−3 was close to the power for UNPHASED, the threshold was applied to the analysis. A total of 21 899 953 pairs with the GCORE P-values < 10−3 were tested by UNPHASED in the second stage.
The GCORE was performed in parallel on 10 nodes equipped with AMD Opteron 2.2 GHz CPU and 48 GB of memory, where each node ran 20 threads, for testing the 22 471 383 013 SNP pairs in a cluster environment. The analysis was finished in 36 h. The same resources were used for UNPHASED for testing the 21 899 953 SNP pairs in the second stage, and the analysis was finished in 7 days. However, if the same resources were used for UNPHASED for testing the 22 471 383 013 pairs of SNPs, more than 7000 days would be required. This again demonstrates the efficiency of the GCORE test. Table 8 shows the five most significant pairs identified by the two stage approach. The marginal test P-values from the TDT are also shown in Table 8. The most significant interaction was between the SNPs in the neuron-derived neurotrophic factor (NDNF) gene and the beta-carotene oxygenase 1 (BCO1) gene, with a P-value of from UNPHASED. However, the test would not be significant after correcting for multiple testing of 738 771 507 tests using the Bonferroni threshold of .
Table 8.
The 5 most significant SNP interaction pairs identified by the two-stage analysis
| SNP names (gene) | MAF | TDT P-value | UNPHASED P-value | GCORE P-value |
|---|---|---|---|---|
| rs17353535 (NDNF) | 0.215 | 0.641 | ||
| rs6564863 (BCO1) | 0.351 | 0.551 | ||
| rs17432229 (NDNF) | 0.214 | 0.699 | ||
| rs6564863 (BCO1) | 0.351 | 0.551 | ||
| rs7310159 (TBX5) | 0.261 | 0.877 | ||
| rs11159502 (SEL1L) | 0.309 | 0.624 | ||
| rs3775914 (NDNF) | 0.215 | 0.680 | ||
| rs6564863 (BCO1) | 0.351 | 0.551 | ||
| rs2901925 (NLGN1) | 0.323 | 1.000 | ||
| rs7863451 (GARNL3) | 0.355 | 0.250 |
5 Discussion
We proposed an efficient gene–gene interaction test, GCORE, which considers correlations in trios. A comprehensive simulation study was conducted to evaluate the properties of the GCORE and other family-based interaction tests with software available. The comparisons of properties between these tests are summarized in Table S10 in the Supplementary Materials. Each test has its advantages and disadvantages. The main advantage of the GCORE over other tests is that it can be used to perform a genome-wide interaction study without large-scale computing resources. In contrast, based on our real data analysis for the AGP GWAS, thousands of computing nodes will be required for UNPHASED to finish the genome-wide interaction analysis within a month. The major disadvantage of the GCORE is that its power can be significantly lower than MDR-PDT and UNPHASED in some situations. However, since the significance threshold is less stringent for the GCORE used as a screening tool, the type II errors of failing to detect the true interactions can be reduced for the GCORE.
Although LE for the two tested SNPs is not assumed in the GCORE, our simulation results showed that the type I error rates for the GCORE were inflated when the LD r2 between the two SNPs was >0.3. Ueki and Cordell (2012) demonstrated that the variance for the interaction test statistic for case–control samples based on haplotype frequencies became larger with higher LD levels between the two SNPs. As haplotype phase inference is not considered in the variance estimator for the GCORE, this might explain why the type I error rates for the GCORE were more seriously inflated with the increase of LD levels between the two SNPs.
Our simulation results suggest that the GCORE is robust to population stratification, which can cause LD between the tested SNPs. However, if was not included in the GCORE statistic, which reduced the test to a case-only test, the type I error rates can be seriously inflated in this scenario (e.g. type I error rate was 0.72 at the 0.05 level for Scenario 1 in Supplementary Table S9 for SNPs with MAFs of 0.2). Therefore, should be included in the GCORE statistic even for unlinked SNPs so that the type I error rates can be maintained in the presence of population stratification.
The GCORE was shown to be conservative for testing SNP pairs with MAFs < 0.2 in samples of 500 and 1000 trios. However, the GCORE maintained proper type I error rates across different MAFs in 2000 trios, except that in a SNP pair with MAFs of (0.05, 0.05), the test was also conservative at the 0.01 significance level. Therefore, increasing the sample size will allow the GCORE to properly test SNP pairs with low MAFs. In contrast, UNPHASED and GEE were more liberal with larger sample size. Hence, the two tests are suitable for testing SNPs with MAFs ≥ 0.2. However, SNPs with MAFs lower than 0.2 may also have interaction effects on complex diseases. MDR-PDT, which maintained correct type I error rates across different MAFs, can be used for testing SNPs with MAFs < 0.2. As MDR-PDT is computationally intensive, efficient interaction methods that consider SNPs with low MAFs with high power are desirable for GWAS. The algorithms developed for rare variants, such as the burden test (Madsen and Browning, 2009) or the sequence kernel association test (Wu et al., 2011), may be extended for interaction tests that accommodate SNPs with low MAFs.
To demonstrate that the two-stage strategy is computationally feasible in practice, we applied the strategy to the AGP GWAS dataset. The total run time suggest that this strategy is applicable to genome-wide interaction analysis in GWAS. Although the interaction pairs identified by the two-stage strategy were not significant when using the stringent genome-wide significance threshold, interestingly, the functions of some genes such as NDNF and neuroligin 1 (NLGN1) in the 5 most significant pairs are related to functions of neurons. NDNF is a neurotrophic factor derived from neurons. NDNF was exclusively expressed in neurons in a mouse model (Kuang et al., 2010). In addition, NLGN1 encodes a protein belonging to a family of neuronal cell surface proteins, which may play a role in the formation and remodeling of central nervous system synapses. More interestingly, copy number variations in NLGN1 have been founded to be associated with autism (Glessner et al., 2009). However, the interactions between the genes have not been reported in the literatures. Further studies are warranted to evaluate the roles of the interactions of these genes in ASD.
In conclusion, the GCORE test has three promising properties: it properly considers correlations in families, shows comparable power with GEE, and is highly efficient. Therefore, the GCORE will be very useful for testing a very large number of pairs of SNPs in family-based genome-wide interaction studies.
Supplementary Material
Acknowledgements
We are grateful to the National Center for High-performance Computing in Taiwan for computer time and facilities. The datasets used for the analysis described in this manuscript were obtained from dbGaP at http://www.ncbi.nlm.nih.gov/gap through dbGaP accession number, phs000267.v4.p2. Submission of the data, phs000267.v4.p2, to dbGaP was provided by Dr. Bernie Devlin on behalf of the Autism Genome Project (AGP). Collection and submission of the data to dbGaP were supported by a grant from the Medical Research Council (G0601030) and the Wellcome Trust (075491/Z/04), Anthony P. Monaco, P.I., University of Oxford.
Funding: This work was funded by grants from the National Health Research Institutes (PH-104-PP-10) and Ministry of Science and Technology (NSC 102-2221-E-400-001-MY2) in Taiwan.
Conflict of Interest: none declared.
References
- Abecasis G.R. et al. (2002) Merlin–rapid analysis of dense genetic maps using sparse gene flow trees. Nat. Genet., 30, 97–101. [DOI] [PubMed] [Google Scholar]
- Anney R. et al. (2010) A genome-wide scan for common alleles affecting risk for autism. Hum. Mol. Genet., 19, 4072–4082. [DOI] [PMC free article] [PubMed] [Google Scholar]
- Autism Genome Project,C. et al. (2007) Mapping autism risk loci using genetic linkage and chromosomal rearrangements. Nat. Genet., 39, 319–328. [DOI] [PMC free article] [PubMed] [Google Scholar]
- Babron M.C. et al. (2015) New correction for multiple testing in gene–gene interaction studies. Ann. Hum. Genet., 79, 380–384. [DOI] [PubMed] [Google Scholar]
- Bagos P.G. (2012) On the covariance of two correlated log-odds ratios. Stat. Med., 31, 1418–1431. [DOI] [PubMed] [Google Scholar]
- Browning B.L., Browning S.R. (2009) A unified approach to genotype imputation and haplotype-phase inference for large data sets of trios and unrelated individuals. Am. J. Hum. Genet., 84, 210–223. [DOI] [PMC free article] [PubMed] [Google Scholar]
- Cattaert T. et al. (2010) FAM-MDR: a flexible family-based multifactor dimensionality reduction technique to detect epistasis using related individuals. PloS One, 5 e10304. [DOI] [PMC free article] [PubMed] [Google Scholar]
- Chen G.B. et al. (2011) A faster pedigree-based generalized multifactor dimensionality reduction method for detecting gene–gene interactions. Stat. Its Interface, 4, 295–304. [DOI] [PMC free article] [PubMed] [Google Scholar]
- Chung R.H. et al. (2015) SeqSIMLA2: simulating correlated quantitative traits accounting for shared environmental effects in user-specified pedigree structure. Genet. Epidemiol., 39, 20–24. [DOI] [PubMed] [Google Scholar]
- Consortium T.G.P. (2010) A map of human genome variation from population-scale sequencing. Nature, 467, 1061–1073. [DOI] [PMC free article] [PubMed] [Google Scholar]
- Cordell H.J. (2009) Detecting gene–gene interactions that underlie human diseases. Nat. Rev. Genet., 10, 392–404. [DOI] [PMC free article] [PubMed] [Google Scholar]
- Cordell H.J. et al. (2004) Case/pseudocontrol analysis in genetic association studies: a unified framework for detection of genotype and haplotype associations, gene–gene and gene–environment interactions, and parent-of-origin effects. Genet. Epidemiol., 26, 167–185. [DOI] [PubMed] [Google Scholar]
- Delaneau O. et al. (2012) A linear complexity phasing method for thousands of genomes. Nat. Methods, 9, 179–181. [DOI] [PubMed] [Google Scholar]
- Dudbridge F. (2008) Likelihood-based association analysis for nuclear families and unrelated subjects with missing genotype data. Hum. Hered., 66, 87–98. [DOI] [PMC free article] [PubMed] [Google Scholar]
- Ebbert M.T. et al. (2014) Population-based analysis of Alzheimer's disease risk alleles implicates genetic interactions. Biol. Psychiatry, 75, 732–737. [DOI] [PMC free article] [PubMed] [Google Scholar]
- Edwards T.L. et al. (2008) Generating linkage disequilibrium patterns in data simulations using genome SIMLA. Lect. Notes Comput. Sci., 4973, 24–35. [Google Scholar]
- Edwards T.L. et al. (2010) A general framework for formal tests of interaction after exhaustive search methods with applications to MDR and MDR-PDT. PloS One, 5, e9363. [DOI] [PMC free article] [PubMed] [Google Scholar]
- Gasso P. et al. (2010) Xenobiotic metabolizing and transporter genes: gene–gene interactions in schizophrenia and related disorders. Pharmacogenomics, 11, 1725–1731. [DOI] [PubMed] [Google Scholar]
- Glessner J.T. et al. (2009) Autism genome-wide copy number variation reveals ubiquitin and neuronal genes. Nature, 459, 569–573. [DOI] [PMC free article] [PubMed] [Google Scholar]
- Hancock D.B. et al. (2007) Methods for interaction analyses using family-based case-control data: conditional logistic regression versus generalized estimating equations. Genet. Epidemiol., 31, 883–893. [DOI] [PubMed] [Google Scholar]
- Hu J.K. et al. (2014) Testing gene–gene interactions in genome wide association studies. Genet. Epidemiol., 38, 123–134. [DOI] [PMC free article] [PubMed] [Google Scholar]
- Kuang X.L. et al. (2010) Spatio-temporal expression of a novel neuron-derived neurotrophic factor (NDNF) in mouse brains during development. BMC Neuroscience, 11, 137. [DOI] [PMC free article] [PubMed] [Google Scholar]
- Ma D.Q. et al. (2005) Identification of significant association and gene–gene interaction of GABA receptor subunit genes in autism. Amer. J. Hum. Genet., 77, 377–388. [DOI] [PMC free article] [PubMed] [Google Scholar]
- Madsen B.E., Browning S.R. (2009) A groupwise association test for rare mutations using a weighted sum statistic. PLos Genet., 5, e1000384. [DOI] [PMC free article] [PubMed] [Google Scholar]
- Manolio T.A. et al. (2009) Finding the missing heritability of complex diseases. Nature, 461, 747–753. [DOI] [PMC free article] [PubMed] [Google Scholar]
- Martin E.R. et al. (2006) A novel method to identify gene–gene effects in nuclear families: the MDR-PDT. Genet. Epidemiol., 30, 111–123. [DOI] [PubMed] [Google Scholar]
- Niel C. et al. (2015) A survey about methods dedicated to epistasis detection. Front. Genet., 6, 285. [DOI] [PMC free article] [PubMed] [Google Scholar]
- Peng B., Amos C.I. (2008) Forward-time simulations of non-random mating populations using simuPOP. Bioinformatics, 24, 1408–1409. [DOI] [PMC free article] [PubMed] [Google Scholar]
- Pinto D. et al. (2010) Functional impact of global rare copy number variation in autism spectrum disorders. Nature, 466, 368–372. [DOI] [PMC free article] [PubMed] [Google Scholar]
- Purcell S. et al. (2007) PLINK: a tool set for whole-genome association and population-based linkage analyses. Am. J. Hum. Genet., 81, 559–575. [DOI] [PMC free article] [PubMed] [Google Scholar]
- Ritchie M.D. et al. (2001) Multifactor-dimensionality reduction reveals high-order interactions among estrogen-metabolism genes in sporadic breast cancer. Am. J. Hum. Genet., 69, 138–147. [DOI] [PMC free article] [PubMed] [Google Scholar]
- Spielman R.S. et al. (1993) Transmission test for linkage disequilibrium: the insulin gene region and insulin-dependent diabetes mellitus (IDDM). Am. J. Hum. Genet., 52, 506–516. [PMC free article] [PubMed] [Google Scholar]
- Su Z. et al. (2011) HAPGEN2: simulation of multiple disease SNPs. Bioinformatics, 27, 2304–2305. [DOI] [PMC free article] [PubMed] [Google Scholar]
- Ueki M., Cordell H.J. (2012) Improved statistics for genome-wide interaction analysis. PLos Genet., 8, e1002625. [DOI] [PMC free article] [PubMed] [Google Scholar]
- Wan X. et al. (2010) BOOST: a fast approach to detecting gene–gene interactions in genome-wide case–control studies. Am. J. Hum. Genet., 87, 325–340. [DOI] [PMC free article] [PubMed] [Google Scholar]
- Wan X. et al. (2010) Predictive rule inference for epistatic interaction detection in genome-wide association studies. Bioinformatics, 26, 30–37. [DOI] [PubMed] [Google Scholar]
- Wu M.C. et al. (2011) Rare-variant association testing for sequencing data with the sequence kernel association test. Am. J. Hum. Genet., 89, 82–93. [DOI] [PMC free article] [PubMed] [Google Scholar]
- Yang C. et al. (2009) SNPHarvester: a filtering-based approach for detecting epistatic interactions in genome-wide association studies. Bioinformatics, 25, 504–511. [DOI] [PubMed] [Google Scholar]
- Zeger S.L. et al. (1988) Models for longitudinal data: a generalized estimating equation approach. Biometrics, 44, 1049–1060. [PubMed] [Google Scholar]
- Zhang X. et al. (2010) TEAM: efficient two-locus epistasis tests in human genome- wide association study. Bioinformatics, 26, i217–i227. [DOI] [PMC free article] [PubMed] [Google Scholar]
Associated Data
This section collects any data citations, data availability statements, or supplementary materials included in this article.