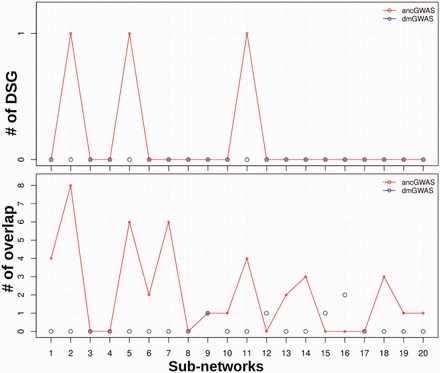
Fig. 4.

Comparing dmGWAS and ancGWAS. (A) Number of overlaping genes between the top sub-networks from dmGWAS and ancGWAS and the simulated disease-susceptibility genes (DSG). (B) Number of overlapping genes between top sub-networks from dmGWAS and ancGWAS and the entire disease pathway (AGED_MOUSE_HYPOTH_UP). Line plot is ancGWAS and circle plot is dmGWAS
