Abstract
Adsorption can be an effective way of purifying polyphenols from complex mixtures. However, polyphenols may be present in small concentrations, making it difficult to selectively adsorb them onto standard hydrophobic resins and obtain appreciable adsorption. In this work, nonfunctionalized hydrophobic resins (Amberlite XAD-7HP, XAD-16) are compared with functionalized resins with imidazole (Biotage RENSA PX) and pyridine (RENSA PY) in terms of capacity and selectivity toward p-coumaric acid, trans-resveratrol, and naringenin. The obtained results indicate that, due to hydrogen bonding, the functionalized resins provide more capacity (e.g., 80 mg·g–1 vs 11.3 mg·g–1 for trans-resveratrol) and up to five times more selectivity than standard resins. Despite such strong affinity, at low pH, the isotherm slope can decrease up to four times when compared to the XAD resins for the same ethanol content, making desorption easier. The included isotherm data is enough to model any chromatography dynamic simulation for the studied compounds.
1. Introduction
Polyphenols are molecules which have a range of different biotechnological applications (e.g., as food additives, nutraceuticals, and food colorants).1 These molecules are secondary metabolites naturally produced by plants, which can act as radical scavengers due to the high stabilization provided by ring aromaticity.2 Over the last years, research on their health properties has grown considerably,3 with authors studying the properties of these molecules in the prevention of diseases such as Alzheimer’s and several types of cancer.4 Furthermore, the increasing interest in these compounds has led to the creation of projects such as the BacHBerry project (www.bachberry.eu), funded by the seventh Framework Programme of the European commission. This project aimed to discover new phenolic compounds with interesting properties (e.g., health-promoting, colorants) and develop a sustainable process for their production using bacterial platforms. The downstream process development for the capture and purification of polyphenols produced in such a way is then crucial for the success of the project.
It is known that most of the state-of-the-art methods for the capture of these polyphenols—although from plant extracts—consist of an adsorption step,5 where an aqueous stream is contacted with macroporous hydrophobic resins such as the Amberlite XAD series, which usually consists of a polystyrene–divinylbenzene copolymer matrix with a very large surface area. Even though extensive investigation on the adsorption of polyphenols onto several macroporous hydrophobic resins, such as the above-mentioned, has been published,6 not much research work has been done—to the best of our knowledge—concerning hydrophobic functionalized resins and their possible advantages in a capture or purification step of polyphenols. Although in a typical capture step one is looking for resin beads with large surface areas, which should correspond to large adsorption capacities, the bottleneck in the case of hydrophobic polyphenols is their usual low concentration in water. As high concentrations in the liquid phase cannot be attained (e.g., solubility of trans-resveratrol in water is around 30 mg·L–1),7 most hydrophobic resins may not get saturated. Consequently, the associated costs of a typical batch capture step, in bind and elute mode, may rise due to the larger column volume and increased amount of solvent needed. A strategy that might be followed instead is to use hydrophobic resins that are functionalized with certain chemical groups (e.g., pyridine, imidazole), which can have an increased affinity toward the polyphenols and get more easily saturated at much lower concentrations. An example of such resins is the RENSA series from Biotage.
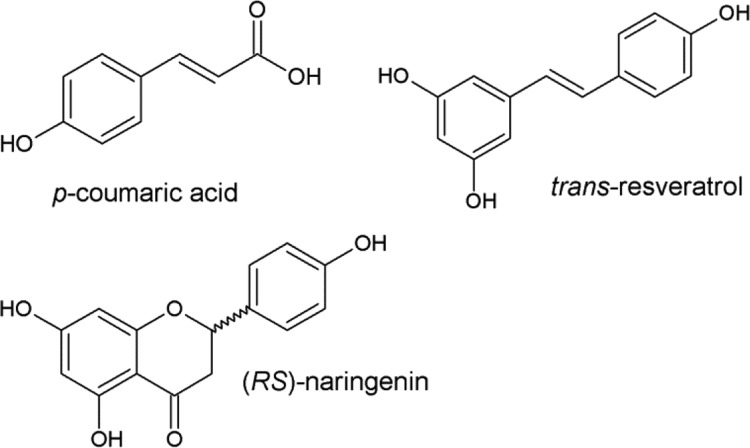
This paper presents the obtained adsorption equilibrium isotherms of three model hydrophobic polyphenols—p-coumaric acid, trans-resveratrol, and naringenin (Figure 1)—using functionalized (RENSA PX (imidazole) and RENSA PY (pyridine)) and nonfunctionalized resins (Amberlite XAD-7HP and XAD-16) and different water–ethanol mixtures, in order to establish a comparison between their adsorption and desorption performances. This will also allow a preliminary calculation of the associated capital and operational costs of a batch capture step, in bind and elute mode, using the two indicated alternatives. Moreover, the dependence of the isotherm slopes with ethanol is also modeled with an exponential function, so that it is possible to model any chromatography unit operation using well-known mechanistic models.8
Figure 1.
Chemical structure of the model polyphenols used in this work.
In the following section, a description of the used materials and methods is given, including a compilation of the physical characteristics of the tested resins. The main obtained results and their discussion are presented on Section 3, and the conclusions are included in Section 4.
2. Experimental Section
2.1. Chemicals
For the preparation of all the solutions, Milli-Q grade water and ethanol absolute for analysis (EMPARTA ACS, Merck Millipore) were used. The polyphenol trans-resveratrol ≥98% was obtained from Evolva. Naringenin (natural (US), 98%) and p-coumaric acid ≥98% were purchased from Sigma-Aldrich. Butyl acetate purum ≥ 98.5% was obtained from Fluka.
2.2. Adsorbents
The selected nonfunctionalized adsorbents were the Amberlite XAD-16 and XAD-7HP resins from Sigma-Aldrich. The goal was to select resins with different dipole moments (and, hence, hydrophobicity) and different surface areas, in order to study their impact on the adsorption of polyphenols. For the functionalized resins, two types of functional groups were selected: phenyl + imidazole (RENSA PX) and phenyl + pyridine (RENSA PY). All these resins possess a styrenic backbone that provides stability for a wide range of pH values 1–14. The RENSA resins were obtained from Biotage AB, Sweden.
The physical properties of the selected resins are indicated in Table A1. Whenever not mentioned, all the values shown were obtained from the suppliers.
Table A1. Summary of the Physical Characteristics of the Selected Hydrophobic Resins.
| resin | dipole moment | diameter (μm) | surface area (m2·g dry–1) | porosity (mL·mL–1) | wet density (gwet·mL–1) | wet/dry mass ratio | skeletal density (gdry·mL–1) | bulk density (gwet mL–1) |
|---|---|---|---|---|---|---|---|---|
| XAD-7HP | 1.8 | 500 | 450 | 0.59 | 1.05 | 2.9 | 1.24 | 630 |
| XAD-16 | 0.3 | 500 | 900 | 0.66 | 1.02 | 2.9 | 1.08 | 610 |
| RENSA PX | n.a. | 60 | 100 | 0.69 | 1.03 | 2.9a | 1.11 ± 0.03b | 620 |
| RENSA PY | n.a. | 100 | 500 | 0.63 | 1.04 | 2.6a | 1.13 ± 0.03b | 620 |
In Table A1 (Appendix), the porosity was obtained in mL·g dry–1 from the supplier and converted to mL·mL–1 using
| 1 |
The wet/dry mass ratio was obtained considering that the moisture holding capacity of both resins is 65% (data from supplier). The bulk density (ρbulk) was calculated from the resin wet density (ρwet) and by considering that the external porosity (ε) is 0.4:9
| 2 |
The wet density values for the XAD resins were obtained from the supplier. For the functionalized resins, those values were calculated using the following equation:
| 3 |
where ϕ is the water mass fraction of the wet resin (determined from the wet/dry mass ratio), ρwat is the water density at 20 °C (0.998 g·mL–1),10 and ρskel is the skeletal density.
The porosity values (in mL·g dry–1) were obtained using eq 4:
| 4 |
where mwet and mdry correspond to the resin wet and dry mass, respectively. These values were then converted to mL·mL–1 using eq 1.
For preparing the resins for the batch uptake experiments, they were prewetted with ethanol and then washed with Milli-Q water. Afterward, they were equilibrated with the appropriate water–ethanol mixture, depending on the considered experimental condition. For the RENSA resins, this procedure was done using filter plates, to which vacuum was applied in order to remove the excess solvent. For the XAD resins, due to their larger size, this process was performed in a plastic syringe with a 0.2 μm tip filter. In the end, the surface excess moisture would be removed using paper tissue.
2.3. Resin Properties Determination
2.3.1. Resin Skeletal Density
The skeletal density of the RENSA resins was obtained by liquid pycnometry, as described elsewhere.11 The solvent used in this process was ethanol, due to its capability of filling the hydrophobic resin pores.
2.3.2. Resin Wet/Dry Ratio
For determining the ratio of wet weight/dry weight, a given mass of prewet resin was added to a plastic boat. After it was left to dry at 60 °C for 1 day, the difference between the wet and dry weights was calculated.
2.4. Equilibrium Experiments
For the batch uptake experiments, depending on the concentration region of the isotherm and the ethanol percentage, two different methods were used. For the solutions containing 0% ethanol (pure Milli-Q water) to 20% ethanol, three different shake-flasks were prepared for each polyphenol/resin combination. After equilibrium was reached, a given amount of liquid volume present at the end of the experiment would be replaced by fresh stock solution, saturated with the desired polyphenol. These would be repeated for at most three cycles, in order to obtain the isotherm for successive higher concentrations in the liquid phase. For the case where solutions contained at least 35% ethanol, the isotherm would be determined with only one cycle of experiments, where each shake-flask contained different initial concentrations of the polyphenolic solution.
Glass flasks with either 5 or 70 mL were used, to vary the liquid/solid phase ratio. The prepared shake-flasks were closed with rubber stops to prevent evaporation. The shaking of the smaller flasks (5 mL liquid volume) was performed in a Heidolph Titramax 1000 incubation platform and shaken at 450 rpm, at room temperature. For the larger flasks (70 mL liquid volume), shaking was performed in a Sartorius Certomat BS-1 at 150 rpm and 20 °C. In all the experiments, shaking was maintained for at least 3 h in order to achieve equilibrium (kinetic data not shown). Room temperature was controlled on a daily basis, and it remained between 20 ± 2 °C.
The amount of polyphenol adsorbed by each resin was obtained by mass balance, where the initial and final concentrations were measured by UHPLC (protocol indicated in Section 2.5):
| 5 |
In this equation, C0 and Ce represent the initial and final (equilibrium) concentrations, respectively. VL is the liquid volume and mres the mass of wet resin used.
The equilibrium data was modeled according to either the Langmuir isotherm (eq 6) or the linear isotherm model (eq 7):
| 6 |
| 7 |
The symbol qmax represents the maximum capacity, KL the affinity constant, and K the isotherm slope for the linear model.
The Langmuir isotherm model was chosen, given that it provides a good mechanistic description of the adsorption of neutral molecules.12 The Langmuir model was chosen over the linear model whenever its Akaike information criteria (eq 8) was lower by, at least, one unit:
| 8 |
In the last equation, np is the number of parameters used by the model and SSE is the sum of squared errors. This is approximately equivalent to saying that the parameter qmax would not bring a sufficient improvement in the description of the experimental data.
For modeling the isotherm dependence on the ethanol concentration, the initial isotherm slope dependence on the modifier (ethanol) was described using an exponential model that resembles a previously developed model used to predict protein retention as a function of salt molality:13
| 9 |
The term inside square brackets represents the initial isotherm slope (which is a function of ethanol concentration). The factors αi and γi are regression parameters, dependent on the compound and the adsorbent. Cmod is the modifier concentration (volumetric percentage), which in this work corresponds to ethanol.
2.5. Analytics
The quantification of p-coumaric acid, trans-resveratrol, and naringenin was carried out by UHPLC (Ultimate 3000, Thermo Scientific, U.S.A.) in a C18 column (Acquity UPLC HSS column, 1.8 μm, 2.1 mm x100 mm Waters, Milford, U.S.A.). Mobile phase A consisted of 10% formic acid in Milli-Q water and mobile phase B of 10% formic acid in acetonitrile. Every run was performed in isocratic mode, with the mobile phase containing 33.5% of B and 66.5% of A and flowing at 0.30 mL/min. The detection of p-coumaric acid was performed at 340 nm, that of trans-resveratrol at 304 nm, and that of naringenin at 289 nm.
2.6. Error Analysis
For all the performed batch experiments, the uncertainty associated with the measurements and the regressed parameters was obtained as described elsewhere.14 The standard deviation of the measurements was calculated according to the theory of error propagation.15 The standard deviation of the estimated parameters was obtained by taking the parameter covariance matrix as the inverse of the Fisher information matrix:
| 10 |
where σi is the standard deviation of the ith observation and J is the Jacobian matrix of the least-squares regression function.
3. Results and Discussion
3.1. Adsorption Equilibrium Isotherm Determination
In order to be able to compare the adsorption and desorption efficiency of the different resins, the knowledge of the isotherms of the three considered polyphenols is essential. In this section, the adsorption equilibrium isotherms for p-coumaric acid, naringenin, and trans-resveratrol, in different water–ethanol solutions, are presented. The results are compared and discussed taking into account the different chemical properties of each compound and of each resin.
3.1.1. p-Coumaric Acid
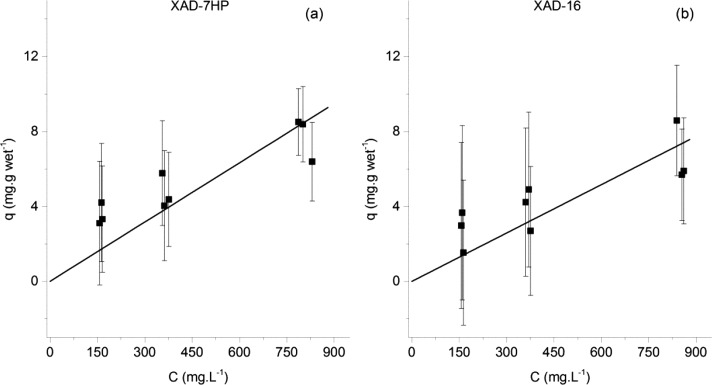
The adsorption equilibrium isotherms of p-coumaric acid onto the Amberlite XAD-16 resin and XAD-7HP are shown in Figure 2.
Figure 2.
Adsorption equilibrium isotherms of p-coumaric acid onto the Amberlite XAD-7HP resin (left) and the Amberlite XAD-16 resin (right). The isotherm data for the adsorption onto the XAD-7HP resin was published elsewhere.16
The capacity was expected to be relatively low, as p-coumaric acid is in its basic form in a pH 7.0 buffer (pka is 4.01).17 As the molecule carries a negative charge, its solubility in water is expected to increase and its hydrophobic interaction with the resin polymer backbone is also expected to decrease. As it is also possible to observe, there is a slightly higher adsorption capacity when using the XAD-7HP than the XAD-16 resin. The proposed explanation is that the XAD-7HP, since is made of an acrylic polymer with a higher dipole moment, can better establish polar interactions than the XAD-16 version, which is composed of a low dipole moment, styrene–divinylbenzene polymer.
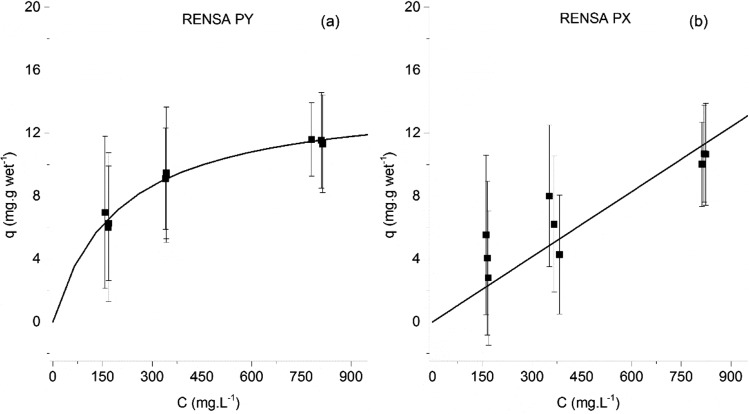
The adsorption equilibrium isotherms of p-coumaric acid were also determined for the RENSA resins (shown in Figure 3) in the same pH 7.0 buffer. The adsorption strength seems to be only slightly higher when compared to the Amberlite XAD resins. One possible explanation is that although p-coumaric acid is deprotonated at pH 7.0, one of its hydroxyl groups is still able to participate in hydrogen bonding with the nitrogen atoms present both in imidazole and in pyridine functional groups. Both those molecules have a lone pair of electrons localized on a nitrogen atom, which can act as a hydrogen bond donor.
Figure 3.
Adsorption equilibrium isotherms of p-coumaric acid onto the RENSA PY resin (left) and the RENSA PX resin (right).
For all the adsorption equilibrium isotherm data obtained for p-coumaric acid, the estimated parameters are indicated in Table 1.
Table 1. Estimated Isotherm Parameters for p-Coumaric Acid onto the XAD and the RENSA Resins, Using Milli-Q Water as Solventa.
| XAD-7HP | XAD-16 | PX | PY | |
|---|---|---|---|---|
| Qmax (mg·gwet–1) | - | - | - | 14 ± 3 |
| KL (L·mg–1) | - | - | - | 0.005 ± 0.002 |
| K (L·gwet–1) | 0.011 ± 0.001 | 0.009 ± 0.001 | 0.014 ± 0.001 | - |
When the parameter K is indicated, the linear isotherm was used. Otherwise, the Langmuir model was applied.
3.1.2. Naringenin
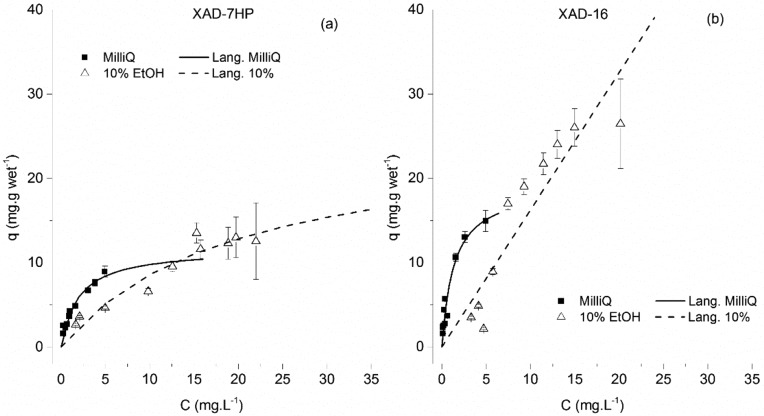
The fact that important hydrogen bonding can occur between polyphenols and these functionalized resins is what most likely contributes for a much stronger affinity. This effect is much more pronounced for naringenin and trans-resveratrol than for p-coumaric acid. In Figures 4 and 5, the adsorption equilibrium isotherms of naringenin onto the Amberlite XAD-16 and XAD-7HP resins are shown. The results are depicted in two different figures for clarity, given the difference in the liquid phase concentration range.
Figure 4.
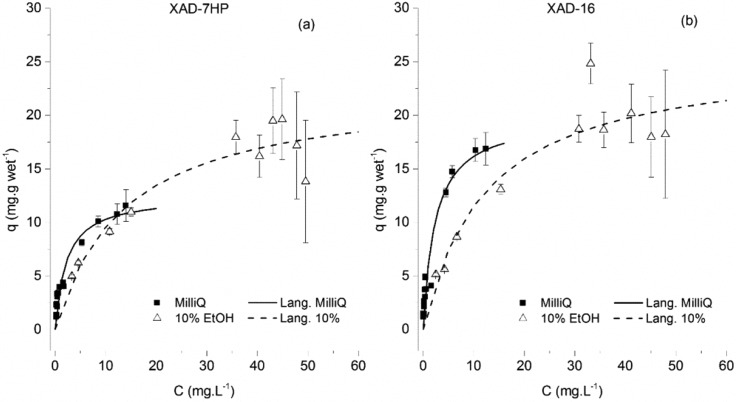
Adsorption equilibrium isotherms of naringenin onto the Amberlite XAD-7HP (a) and XAD-16 (b) resins. Results are shown for Milli-Q water and 10% ethanol.
Figure 5.
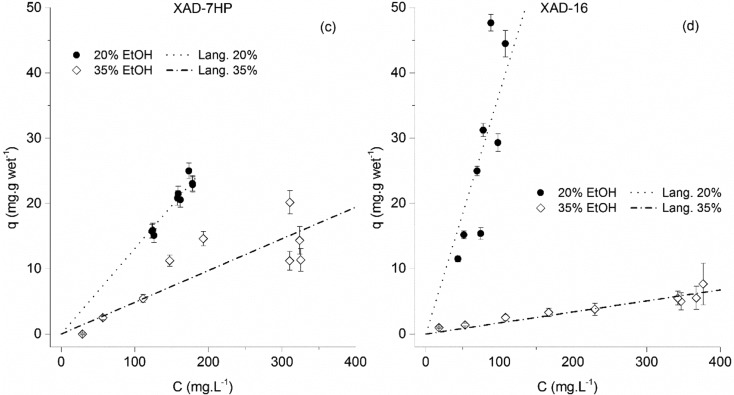
Adsorption equilibrium isotherms of naringenin onto the Amberlite XAD-7HP (c) and XAD-16 (d) resins. Results are shown for 20% and 35% ethanol.
For the aqueous solution, the maximum capacity is on the order of 19 mg·g wet–1 for the XAD-16 resin and of 11 mg g wet–1 for the XAD-7HP resin (Table 2). The affinity constants are 0.77 L·mg–1 and 0.53 L·mg–1 for the XAD-16 and XAD-7HP resins, respectively (Table 2).
Table 2. Estimated Isotherm Parameters for Naringenin onto the XAD and the RENSA Resins, Using Different Water/Ethanol Solutionsa.
| ethanol % |
||||||||
|---|---|---|---|---|---|---|---|---|
| 0% | 10% | 20% | 35% | 0% | 10% | 20% | 35% | |
| XAD-7HP | XAD-16 | |||||||
| Qmax (mg·gwet–1) | 11 ± 1 | 25 ± 5 | - | - | 19 ± 2 | - | - | - |
| KL (L·mg–1) | 0.53 ± 0.07 | 0.05 ± 0.01 | - | - | 0.77 ± 0.09 | - | - | - |
| K (L·gwet–1) | - | - | 0.53 ± 0.01 | 0.019 ± 0.003 | - | 1.63 ± 0.02 | 0.77 ± 0.02 | 0.017 ± 0.004 |
| RENSA PY | RENSA PX | |||||||
| Qmax (mg·gwet–1) | 38 ± 2 | - | 38 ± 2 | 38 ± 2 | 31 ± 1 | - | 31 ± 1 | 31 ± 1 |
| KL (L·mg–1) | 4.1 ± 0.4 | - | 0.104 ± 0.009 | 0.0085 ± 0.0009 | 1.2 ± 0.1 | - | 0.052 ± 0.005 | 0.013 ± 0.002 |
When the parameter K is indicated, the linear isotherm was used. Otherwise, the Langmuir model was applied.
As expected, the affinity of naringenin toward the resins decreased with the percentage of ethanol. This behavior is probably mainly due to the increased interactions between the hydrophobic molecule and the more hydrophobic liquid phase, as the ethanol content increases. Unlike what was observed for p-coumaric acid, the XAD-16 resin seemed now to have a better adsorption performance than the XAD-7HP. The proposed explanation is equivalent to the one proposed for p-coumaric acid: since the XAD-16 resin is made of a more hydrophobic polymer, it is expected to participate in stronger interactions with naringenin, when compared to the XAD-7HP.
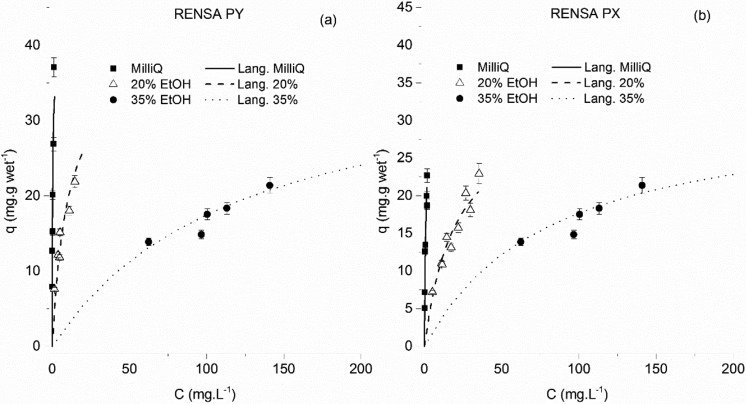
The isotherm data of naringenin onto the RENSA resins is depicted in Figure 6. As it is possible to observe, the isotherms determined with Milli-Q water are much steeper than the ones for the XAD resins. For example, the affinity constant for the RENSA PY is of 4.1 L·mg–1 (Table 2), which is about 10 times higher than for the XAD-16. This order of magnitude for the affinity constant is also much higher than what was observed for the adsorption of similar polyphenols onto standard hydrophobic resins.18 This increased affinity is probably due to the hydrogen bonding interactions that can occur between the hydroxyl groups in the polyphenols and the nitrogen atoms present in both RENSA PX and RENSA PY resins. This effect is now much more pronounced than it was for p-coumaric acid. Furthermore, the maximum capacity attained for the PY resin is approximately 38 mg·g wet–1, and for the PX resin it is 31 mg·g wet–1. These values are between 1.6 and 3.5 times higher than the ones obtained for XAD resins, which proves that a larger surface area does not necessarily imply a higher capacity.
Figure 6.
Adsorption equilibrium isotherms of naringenin onto the RENSA PY resin (a) and the RENSA PX resin (b), using different ethanol percentages.
It should also be stated at this point that, for the adsorption parameter estimation with the RENSA resins, a constant qmax was assumed (independent of the ethanol percentage). The reason was twofold: the assumption of a constant saturation capacity for small molecules in reverse-phase adsorption has been observed previously,8 and a Langmuir model with a constant saturation capacity provided a lower Akaike information value than a model with three different capacities (one for each ethanol percentage).
As it was shown in the previous isotherms, the tendency is for the isotherm slope to decrease with increasing concentration of ethanol. The suggested explanation is also the same as given before: the increased hydrophobicity of the mobile phase.
The fact that the maximum capacity for the RENSA resins can be assumed to be constant, independently of the percentage of ethanol, does not seem to occur with the XAD resins. The proposed justification is that the orientation in which the polyphenol binds to the nonfunctionalized hydrophobic resins varies with increasing ethanol percentage. When an aqueous solution is present, probably the molecule tends to completely spread over the surface in order to minimize its content with the water molecules and maximize its hydrophobic interactions with the resin. On the other hand, if ethanol is added, its orientation toward the surface might change in order to balance the interactions with the solvent and the hydrophobic surface. For the case of the functionalized resins, a similar mechanism might exist as in affinity chromatography: a specific molecule positioning ensures that a lower energy state is achieved, which might be solvent invariable (at least in this case using water–ethanol mixtures).
3.1.3. trans-Resveratrol
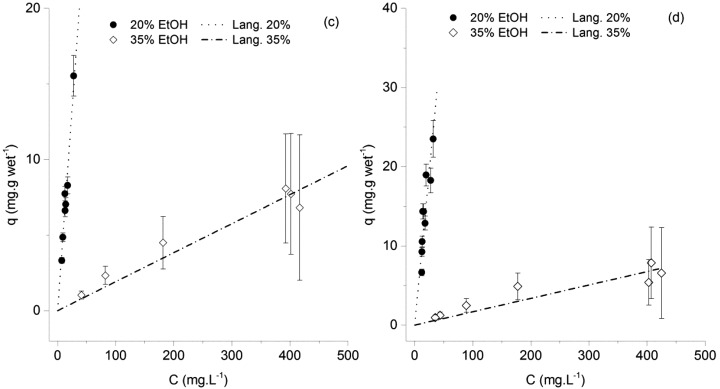
For the case of trans-resveratrol, a much more noticeable difference between the performance of the XAD resins and the RENSA resins occurs. In Figures 7 and 8, the isotherms for the XAD resins are depicted. The maximum capacity for a trans-resveratrol aqueous solution seems to reach 18 mg·g wet–1 for the XAD-16 and 11 mg·g wet–1 for the XAD-7HP.
Figure 7.
Adsorption equilibrium isotherms of trans-resveratrol onto the Amberlite XAD-7HP (a) and XAD-16 (b) resins. Results are shown for Milli-Q water and 10% ethanol. The isotherm data for the adsorption onto the XAD-7HP resin, using Milli-Q water, was published elsewhere.16
Figure 8.
Adsorption equilibrium isotherms of trans-resveratrol onto the Amberlite XAD-7HP (c) and XAD-16 (d) resins. Results are shown for 20% and 35% ethanol.
Like in the case of naringenin, the resin maximum capacity, for both XAD resins, seems to depend on the ethanol percentage. In Table 3, the regressed isotherm parameters are indicated. As previously mentioned, these isotherms were represented in different plots for improved clarity.
Table 3. Estimated Isotherm Parameters for trans-Resveratrol onto the XAD and the RENSA Resins, Using Different Water/Ethanol Solutionsa.
| ethanol
% |
||||||||
|---|---|---|---|---|---|---|---|---|
| 0% | 10% | 20% | 35% | 0% | 10% | 20% | 35% | |
| XAD-7HP | XAD-16 | |||||||
| Qmax (mg·gwet–1) | 11.3 ± 0.5 | 21 ± 2 | - | - | 17.7 ± 0.8 | 23 ± 2 | - | - |
| KL (L·mg–1) | 0.53 ± 0.03 | 0.08 ± 0.01 | - | - | 0.53 ± 0.03 | 0.09 ± 0.01 | - | - |
| K (L·gwet–1) | - | - | 0.129 ± 0.006 | 0.055 ± 0.003 | - | . | 0.369 ± 0.007 | 0.017 ± 0.003 |
| RENSA PY | RENSA PX | |||||||
| Qmax (mg·gwet–1) | 58 ± 3 | - | 58 ± 3 | 58 ± 3 | 80 ± 5 | - | 80 ± 5 | 80 ± 5 |
| KL (L·mg–1) | 0.49 ± 0.04 | - | 0.0061 ± 0.0007 | 0.0012 ± 0.0001 | 0.26 ± 0.02 | - | 0.019 ± 0.003 | 0.0073 ± 0.0006 |
When the parameter K is indicated, the linear isotherm was used. Otherwise, the Langmuir model was applied.
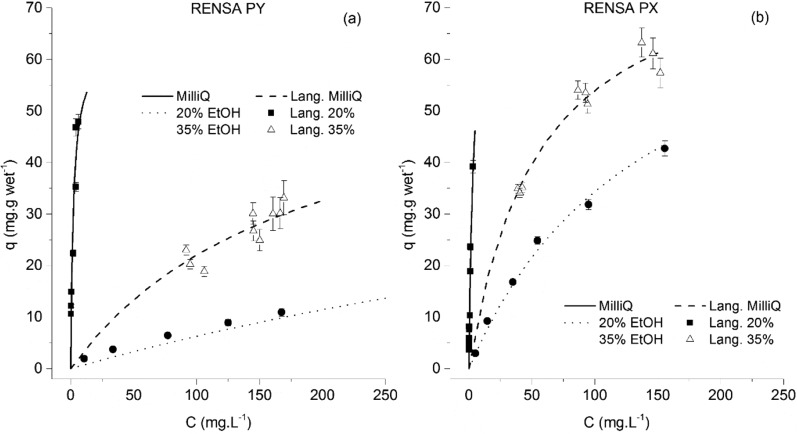
For the functionalized resins, a much better performance was obtained (Figure 9). The maximum capacity for the PX resin was estimated at 80 mg·g wet–1 and that of PY at 58 mg·g wet resin–1. These results are in an improvement of at least 3.3 times (when comparing RENSA PY over the XAD-16). The isotherm determined in pure water presents also a higher slope than with the XAD resins, which is again an indication of a possible specific interaction between these resins and the polyphenols (through hydrogen bonding). The improved performance of these functionalized resins is also seen when compared to other hydrophobic macroporous resins not considered in this work, where the adsorption capacities for trans-resveratrol are around 25 mg·g–1.19
Figure 9.
Adsorption equilibrium isotherms of trans-resveratrol onto the RENSA PY resin (left) and the RENSA PX resin (right).
The estimated isotherm parameters for trans-resveratrol onto the RENSA resins are compiled in Table 3. It is worth mentioning that specific strong interactions between polyphenols and molecules containing nitrogen have been already documented. For example, it is known that there is a highly strong interaction between polyphenols and proteins which have a large number of histidine and proline residues.20 Interestingly, histidine has a side chain imidazole group—included in the PX resins—and proline a pyrrolidine group.
Despite the high affinity of these hydrophobic polyphenols toward the RENSA resins, one of the possible drawbacks when using these adsorbents is a difficult desorption. To confirm this, when analyzing Table 3, one can check that the isotherm slope for resveratrol when using the RENSA PX resin is more than 10 times higher than when using the XAD-7HP. One of the possibilities to counteract this effect is to protonate the nitrogen groups present in pyridine or imidazole, in order for them not to act as hydrogen bond donors and thus weaken their interaction (Figure 10).
Figure 10.
Acid–base reaction involving the molecule of imidazole.
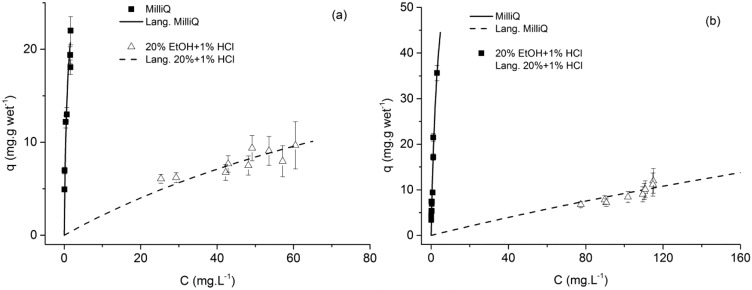
To confirm this hypothesis, the adsorption equilibrium isotherms of both trans-resveratrol and naringenin onto the RENSA PX were obtained for 20% ethanol solutions containing 1% (v/v) of a 37% HCl solution and they are displayed in Figure 11.
Figure 11.
Adsorption equilibrium isotherms of naringenin (left) and trans-resveratrol (right) onto the RENSA PX resin, when adding 1% HCl to the ethanolic solutions.
The estimated isotherm parameters, again assuming a constant qmax, are indicated in Table 4.
Table 4. Comparison of the Estimated Isotherm Parameters for trans-Resveratrol and Naringenin onto the RENSA Resins, for 20% Ethanol (the parameters for the experiments with Milli-Q water are shown as a reference)a.
|
trans-resveratrol on RENSA
PX |
naringenin
on RENSA PX |
|||||
|---|---|---|---|---|---|---|
| water | 20% | 20% + 1% HCl | water | 20% | 20% + 1% HCl | |
| Qmax (mg·gwet–1) | 80 ± 5 | 80 ± 5 | 80 ± 5 | 31 ± 1 | 31 ± 1 | 31 ± 1 |
| KL (L·mg–1) | 0.26 ± 0.02 | 0.019 ± 0.003 | 0.0013 ± 0.0001 | 1.2 ± 0.1 | 0.052 ± 0.005 | 0.0074 ± 0.0006 |
As it is indicated, the slope reduces approximately by a factor of 10.
As it was proposed, by adding 1% HCl to the water–ethanol solutions, a much weaker adsorption equilibrium isotherm is obtained. The fact that imidazole is no longer able to participate in hydrogen bonding not only makes desorption possible, but it also seems to become easier than for the XAD resins. In Table 5, the initial slope of the isotherms of trans-resveratrol and naringenin are compared for both XAD and RENSA resins.
Table 5. Initial Isotherm Slope of trans-Resveratrol (left) and Naringenin (right) onto the Studied XAD Resins and the RENSA PX Resin at 20% EtOH and 20% EtOH + 1% HCl.
|
trans-resveratrol |
naringenin |
|||
|---|---|---|---|---|
| resin | 20% EtOHa (L·g wet–1) | 20% EtOH + 1% HCla (L·g wet–1) | 20% EtOHa (L·g wet–1) | 20% EtOH + 1% HCla (L·g wet–1) |
| XAD-7HP | 0.129 ± 0.006 | - | 0.53 ± 0.01 | - |
| XAD-16 | 0.369 ± 0.007 | - | 0.77 ± 0.02 | - |
| PX | 1.5 ± 0.3 | 0.10 ± 0.02 | 1.6 ± 0.2 | 0.23 ± 0.03 |
Liquid phase.
As indicated in the table, by adding 1% HCl to the ethanolic solution, the isotherm slope becomes even lower than the weakest XAD resin—XAD-7HP. From these results, it is possible to conclude that, by acidifying the ethanolic mixture, elution of both naringenin and trans-resveratrol should become even easier than with the XAD resins, making them more efficient not only for adsorption but also for desorption.
3.2. Isotherm Slope as a Function of Ethanol Content
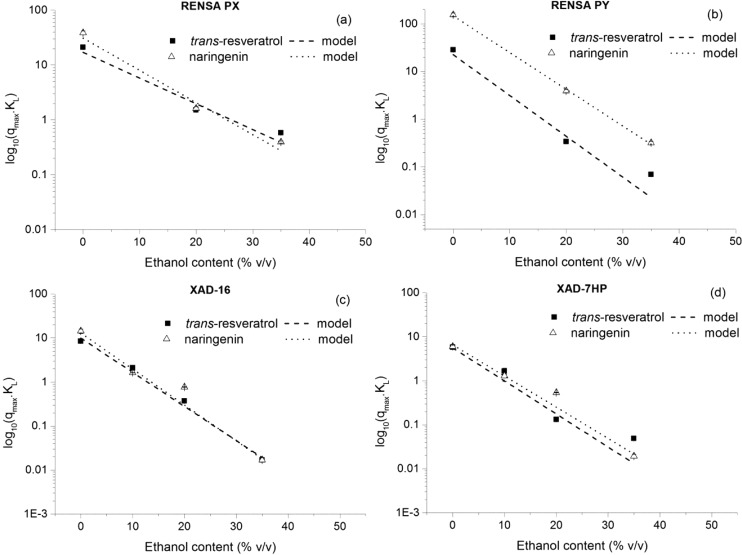
In order to develop a mechanistic model for any chromatographic process, it is necessary to describe the dependence of the isotherm slope with the modifier concentration to be used (ethanol in this case). For this purpose, the previously introduced exponential model was used (eq 9), which relates the isotherm slope with the concentration of modifier. In Figure 12, the variation of the isotherm slopes with the ethanol concentration for all the systems investigated is depicted, together with the fitted exponential model.
Figure 12.
Dependence of the isotherm slope (qmaxKL) with the ethanol volumetric percentage in the mobile phase. For all the cases, the exponential model seems to provide a good description of the observed experimental data.
The estimated parameters are indicated in Table 6 for both trans-resveratrol and naringenin. The obtained results seem to confirm that the lower capacity of the resins at higher ethanol content is mainly due to the higher partition of these molecules for the liquid phase rather than adsorption competition. This conclusion is based on the previously assumed exponential model, which seems to describe well the trend of the experimental observations, given the obtained R2 values (Table 6).
Table 6. Estimated Parameters for the Exponential Model Applied to trans-Resveratrol and Naringenin, Describing How the Isotherm Slope Varies with the Percentage of Modifier (ethanol in this case).
| XAD-7HP | XAD-16 | PY | PX | |
|---|---|---|---|---|
| trans-resveratrol | ||||
| α | 5.59 ± 0.05 | 9.9 ± 0.1 | 23 ± 1 | 17 ± 4 |
| γ | –0.1728 ± 0.0005 | –0.1786 ± 0.0004 | –0.197 ± 0.002 | –0.108 ± 0.007 |
| R2 | 0.978 | 0.953 | 0.956 | 0.956 |
| naringenin | ||||
| α | 6.6 ± 0.2 | 13.0 ± 0.2 | 146 ± 90 | 31 ± 7 |
| γ | –0.163 ± 0.001 | –0.1882 ± 0.0004 | –0.18 ± 0.02 | –0.135 ± 0.007 |
| R2 | 0.980 | 0.985 | 0.998 | 0.962 |
3.3. Resin Performance Comparison: Capacity and Selectivity
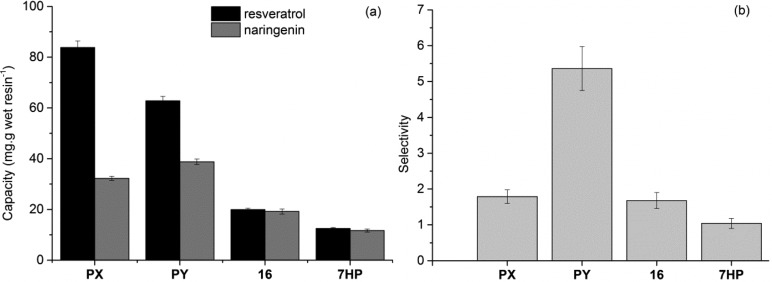
In order to quantify the different performances of the two groups of resins, two performance parameters were compared: their maximum capacity (Figure 13a) and their naringenin/trans-resveratrol selectivity (Figure 13b). For the calculation of selectivity, the ratio of the initial isotherm slopes determined with Milli-Q water was calculated.
Figure 13.
Comparison of the maximum capacity and selectivity for the three different model polyphenols tested. Capacity (shown on the left) seems to be much higher for the functionalized resins. Regarding selectivity (shown on the right), the RENSA PY clearly outperforms all the other options for a possible trans-resveratrol/naringenin separation.
As one can observe for both cases, the RENSA resins have a better capacity than the XAD series. This indicates that these resins might be a better option when intended for use in an initial capture step. Considering, for example, the adsorption of trans-resveratrol onto the PX resin, its capacity is almost ten times the one of XAD-7HP. While the RENSA resins are more expensive than the XAD series, this would mean that almost 10 times less resin would be needed, resulting also in a smaller column.
In terms of selectivity, the trans-resveratrol/naringenin case was selected, as it is a more challenge purification. From all the studied materials, the RENSA PY clearly stands out. This higher selectivity can be explained from the fact that not only hydrophobicity—like for the XAD resins—but also hydrogen bonding is also involved during binding. So, in the end, a mixed-mode like behavior is likely to be present and enhance the specificity of these resins. This did not seem to happen with the PX resin, but other factors might also be involved. It may be possible that, for example, the geometry of the adsorption interaction is similar for both trans-resveratrol and naringenin. In that case, despite the higher capacity, not much selectivity is achieved.
Another aspect should also be mentioned at this point, and it is related to peak resolution. Given that both RENSA resins have approximately five times less diameter than the XAD resins, even if the selectivity for a given separation is the same (e.g., RENSA PX and XAD-16), peak resolution should be much better due to the improved mass transfer.21 For this reason, the RENSA resins should also probably be a better option for a purification step than the XAD resins. However, in order to have a more definite conclusion, a more in-depth economic analysis would be needed.
4. Conclusions
This work exploited the potential of using hydrophobic resins, functionalized either with imidazole or pyridine, for the adsorption of three polyphenols: p-coumaric acid, trans-resveratrol, and naringenin. A comprehensive isotherm determination was performed for a range of different ethanol concentrations in water. A model for describing the single-component isotherms as a function of the modifier concentration (ethanol) was provided, and it proved to fit quite well the experimental observations. The regressed parameters are enough for the reader to perform any dynamic chromatography simulations, provided they estimate the needed mass transfer coefficients.
The obtained results indicated that functionalized resins could achieve much higher adsorption capacity, proving that this is not exclusively determined by surface area but probably also by the binding orientation. The suggested explanation is based on the capability of pyridine and imidazole to establish hydrogen bonding, a mechanism that is also present in the strong polyphenol–protein interactions, when histidine and proline residues are present. It thus becomes possible for polyphenols—rich in hydroxyl groups—not only to establish hydrophobic interactions with the resin backbone (as it happens with the XAD resins) but also to have an increased interaction energy through hydrogen bonding. The same mechanism can probably explain why the RENSA PY resin could achieve a much higher selectivity for the trans-resveratrol/naringenin separation. Unlike the case of the XAD resins, a mixed mode behavior may be present, based on both hydrophobic and hydrogen bonding interactions. This can add another degree of freedom, which can affect both the geometry and the strength of the adsorption interaction and thus increase selectivity.
These results would have no practical applicability if desorption of the desired compounds would not be possible. Nonetheless this study demonstrated that, by acidifying the water/ethanol elution solution, polyphenol desorption became not only possible but even easier than for the XAD resins, for the same ethanol concentration. By protonating the imidazole group in RENSA PX resin, hydrogen bonding could no longer occur, thus weakening the adsorption interaction.
Both in terms of capacity and selectivity, this work proposes that the RENSA resins might be a better option than the standard XAD resins, despite their higher cost. Being able to use less resin would probably result in less inventory and also in a smaller column size and solvent annual cost. However, more detailed economic studies are required to achieve stronger conclusions.
Acknowledgments
This work was supported by the BacHBerry project (www.bachberry.eu), within the 7th Framework (Project No. FP7-613793). We would also like to thank Ecevit Yilmaz, from Biotage, for all the information provided concerning the RENSA resins.
Appendix
The main physical properties of the resins used in this work are indicated in Table A1.
The authors declare no competing financial interest.
References
- Transparency Market Research. Polyphenols Market by Product (Grape Seed, Green Tea, Apple and Others), by Application (Functional Beverages, Functional Food, Dietary Supplements and Others): Global Industry Analysis, Size, Share, Growth, Trends and Forecast, 2012–2018; 2013. [Google Scholar]
- Alov P.; Tsakovska I.; Pajeva I. Computational Studies of Free Radical-Scavenging Properties of Phenolic Compounds. Curr. Top. Med. Chem. 2015, 15 (2), 85–104. 10.2174/1568026615666141209143702. [DOI] [PMC free article] [PubMed] [Google Scholar]
- Scalbert A.; Johnson I. T.; Saltmarsh M. Polyphenols: antioxidants and beyond. Am. J. Clin. Nutr. 2005, 81 (1), 215S–217S. 10.1093/ajcn/81.1.215S. [DOI] [PubMed] [Google Scholar]
- Pandey K. B.; Rizvi S. I. Plant polyphenols as dietary antioxidants in human health and disease. Oxid. Med. Cell. Longevity 2009, 2 (5), 270–278. 10.4161/oxim.2.5.9498. [DOI] [PMC free article] [PubMed] [Google Scholar]
- Kammerer D. R.; Carle R.; Stanley R. A.; Saleh Z. S. Pilot-scale resin adsorption as a means to recover and fractionate apple polyphenols. J. Agric. Food Chem. 2010, 58 (11), 6787–96. 10.1021/jf1000869. [DOI] [PubMed] [Google Scholar]
- Soto M. L.; Moure A.; Domínguez H.; Parajó J. C. Recovery, concentration and purification of phenolic compounds by adsorption: a review. J. Food Eng. 2011, 105 (1), 1–27. 10.1016/j.jfoodeng.2011.02.010. [DOI] [Google Scholar]
- Sun X. L.; Shao Y. D.; Yan W. D. Measurement and Correlation of Solubilities of trans-Resveratrol in Ethanol plus Water and Acetone plus Water Mixed Solvents at Different Temperatures. J. Chem. Eng. Data 2008, 53 (11), 2562–2566. 10.1021/je800410b. [DOI] [Google Scholar]
- Guiochon G.; Felinger A.; Shirazi D. G.; Katti A. M.. Fundamentals of Preparative and Nonlinear Chromatography; Academic Press: 2006. [Google Scholar]
- Carta G.; Jungbauer A.. Protein Chromatography: process development and scale-up; Wiley: 2010. [Google Scholar]
- Green D.; Perry R.. Perry’s Chemical Engineers’ Handbook, 8th ed.; McGraw-Hill Education: 2007. [Google Scholar]
- Dorfner K.Ion exchangers, 1st ed.; Walter de Gruyter: 1991. [Google Scholar]
- Monsanto M.; Mestrom R.; Zondervan E.; Bongers P.; Meuldijk J. Solvent Swing Adsorption for the Recovery of Polyphenols from Black Tea. Ind. Eng. Chem. Res. 2015, 54 (1), 434–442. 10.1021/ie503590m. [DOI] [Google Scholar]
- Melander W. R.; el Rassi Z.; Horvath C. Interplay of hydrophobic and electrostatic interactions in biopolymer chromatography. Effect of salts on the retention of proteins. J. Chromatogr. 1989, 469, 3–27. 10.1016/S0021-9673(01)96437-4. [DOI] [PubMed] [Google Scholar]
- Méndez Sevillano D.; Jankowiak L.; van Gaalen T. L. T.; van der Wielen L. A. M.; Hooshyar N.; van der Goot A. J.; Ottens M. Mechanism of Isoflavone Adsorption from Okara Extracts onto Food-Grade Resins. Ind. Eng. Chem. Res. 2014, 53 (39), 15245–15252. 10.1021/ie5026419. [DOI] [Google Scholar]
- Skoog D. A.; Holler F. J.; Crouch S. R.. Principles of instrumental analysis; Brooks Cole: 2007. [Google Scholar]
- Braga A.; Silva M.; Oliveira J.; Silva R.; Ferreira P.; Ottens M.; Rocha I.; Faria N., An adsorptive bioprocess for production and recovery of resveratrol with Corynebacterium glutamicum. J. Chem. Technol. Biotechnol. 2018; 10.1002/jctb.5538 [DOI] [Google Scholar]
- Chemicalize was used for calculating the pKa of p-coumaric acid, January 2018, https://chemicalize.com/ developed by ChemAxon (http://www.chemaxon.com).
- Sevillano D. M.; van der Wielen L. A.; Hooshyar N.; Ottens M. Resin selection for the separation of caffeine from green tea catechins. Food Bioprod. Process. 2014, 92 (2), 192–198. 10.1016/j.fbp.2014.02.002. [DOI] [Google Scholar]
- Xiong Q.; Zhang Q.; Zhang D.; Shi Y.; Jiang C.; Shi X. Preliminary separation and purification of resveratrol from extract of peanut (Arachis hypogaea) sprouts by macroporous adsorption resins. Food Chem. 2014, 145, 1–7. 10.1016/j.foodchem.2013.07.140. [DOI] [PubMed] [Google Scholar]
- Charlton A. J.; Baxter N. J.; Khan M. L.; Moir A. J.; Haslam E.; Davies A. P.; Williamson M. P. Polyphenol/peptide binding and precipitation. J. Agric. Food Chem. 2002, 50 (6), 1593–601. 10.1021/jf010897z. [DOI] [PubMed] [Google Scholar]
- Felinger A.; Guiochon G. Comparison of the kinetic models of linear chromatography. Chromatographia 2004, 60, S175–S180. 10.1365/s10337-004-0288-7. [DOI] [Google Scholar]


