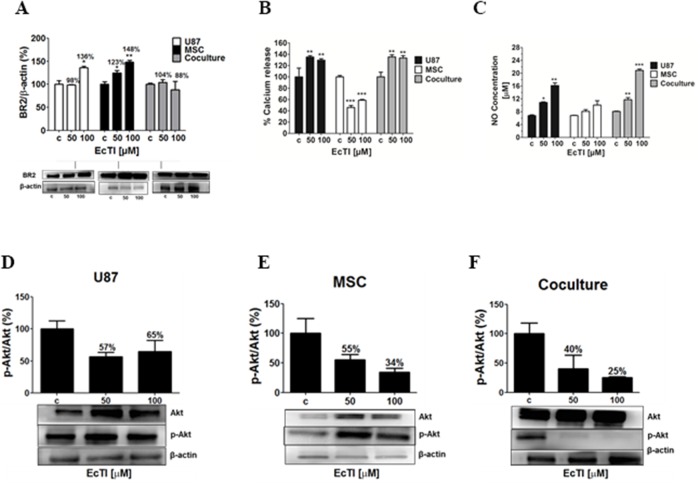
Figure 6. The Effect of EcTI on the expression of the bradykinin receptor 2 (BR2), oxide nitric (NO), and Akt protein.
Expression of BR2 in the cell culture of cancer U87 cells, mesenchymal stem cells (MSC), and coculture (A). The quantification of the relative BR2 expression in each sample was performed by densitometry analysis in the Image J software with β-actin normalization. The effects of EcTI on calcium release (B) and detection of NO concentration (C) in U87 cells, MSCs, and coculture. Expression of the ratio p-Akt/Akt in MSC (D), U87 (E), and coculture (F) compared to non-treated control (c) cells. The error bars represent SD. *p < 0.05, **p< 0.005, ***p< 0.0005 were considered significant.

