

Abstract
Study Objectives:
To determine the reproducibility of the Epworth Sleepiness Scale (ESS) score in a clinical population referred for diagnostic testing with suspected obstructive sleep apnea.
Methods:
A retrospective audit of patients referred for a diagnostic sleep study with suspected sleep apnea was undertaken. Data collection was two 3-month time periods from January to March in 2012 and 2014. To evaluate reproducibility, the ESS score at primary care referral was compared to the ESS score at first specialist assessment/sleep assessment. The proportion of scores changing by more than 2, 3, 5, or 7 points was determined. Data were analyzed using Bland-Altman plots and paired t tests.
Results:
A total of 154 patients (68% male) with a mean ± standard deviation age of 51 ± 13 years, body mass index 36 ± 10 kg/m2, and apnea-hypopnea index 43 ± 40 events/h were included. The average ESS score change was −0.2 with a standard deviation of 3.9 reflecting a wide scatter. A difference between the sequential ESS scores of 5 or more was seen in 21% of subjects.
Conclusions:
In a clinical obstructive sleep apnea referral population, the ESS score was variable when administered sequentially. Given this variability the ESS should not be used as the sole tool to prioritize patients for obstructive sleep apnea assessment.
Commentary:
A commentary on this article appears in this issue on page 711.
Citation:
Campbell AJ, Neill AM, Scott DA. Clinical reproducibility of the Epworth Sleepiness Scale for patients with suspected sleep apnea. J Clin Sleep Med. 2018;14(5):791–795.
Keywords: primary health care, referral and consultation, sleep, sleep apnea syndromes
BRIEF SUMMARY
Current Knowledge/Study Rationale: Despite being used worldwide in clinical and research settings, assessment of the reproducibility of the Epworth Sleepiness Scale (ESS) score has been limited to normal subjects. In a setting of suspected obstructive sleep apnea, the ESS score is being used for triaging patients for publicly funded assessments from primary care referral in the United Kingdom and New Zealand without knowledge of its reliability throughout a referral pathway. This study aims to document reproducibility of the ESS score in a suspected obstructive sleep apnea population across a diagnostic referral pathway.
Study Impact: In a clinical obstructive sleep apnea referral population, the ESS score is variable when administered sequentially. Given this variability, the ESS should not be used as the sole tool to prioritize patients for obstructive sleep apnea assessment.
INTRODUCTION
Obstructive sleep apnea (OSA) is a common sleep-related breathing disorder, affecting about 2% to 4% of the New Zealand adult population.1 Repetitive breathing pauses during sleep throughout the night result from the collapse of the upper airway and lead to a distinctive choking-arousal type sleep pattern.2 Fragmented sleep periods and disturbances in normal sleep architecture throughout the night leave sufferers of OSA with significant daytime sleepiness that has been shown to place these individuals at increased risk of motor vehicle accidents,3 hypertension, type 2 diabetes, cerebrovascular accidents, and coronary heart disease.4
The Epworth Sleepiness Scale (ESS) is a simple method for assessing subjective daytime levels of sleepiness in adults.5 The patient is asked to retrospectively characterize daytime sleepiness for a range of situations encountered in day-to-day life. For each question, patients rate their chance of dozing on a scale of 0 to 3. The ESS score is the sum of these 8 situational subscores, with the total score ranging from 0 to 24. A score of 10 or more indicates significant daytime somnolence and 16 or more suggests severe daytime somnolence.5
Demand for OSA services is on the rise in most countries. The ESS is being used in many New Zealand services as a key decision point to determine access to diagnostic testing and treatment. With limited government health funding in New Zealand for sleep apnea services, it is important that patients with the greatest clinical need are identified so that they can be treated. Clinical prioritization tools such as the ESS serve alongside other clinical information collected from a general practitioner (or primary care physician) to triage patients referred for assessment by a specialist.
Diagnostic clinical pathways including sleep testing are used to confirm the presence and severity of OSA. Nasal continuous positive airway pressure (CPAP), when used in symptomatic patients with moderate to severe disease, has been shown to be highly cost-effective; therefore, effective prioritization and symptom assessment of patients with suspected sleep apnea is of great importance.6,7
The ESS was originally validated by Johns comparing control subjects to patients in whom a variety of sleep disorders had been diagnosed.8 It is now used frequently in research assessing response to intervention and clinically to assess sleepiness as a proxy measurement to screen for sleep disorders.9
When the ESS is administered sequentially, the test-retest reproducibility has been shown to be strong in normal subjects.8 There is a paucity of research evaluating the reproducibility or test-retest reproducibility of the ESS in a clinical population with sleep related breathing disorders. To our knowledge, only one study examined ESS reproducibility in a population of patients with suspected sleep apnea referred from private snoring clinics to a tertiary sleep clinic.10
The aim of this study was to determine the reproducibility of the ESS in a clinical cohort with suspected OSA.
METHODS
A retrospective audit of patients referred for sleep study assessment at a tertiary level sleep service (WellSleep) was undertaken from 2012 and 2014 data. Both private and government-funded data were reviewed.
From retrospective review the following information was extracted: subject demographics, age, anthropometric measurements (body mass index [BMI], neck circumference), diagnosed hypertension or diabetes, and apnea-hypopnea index (AHI) from overnight sleep assessment (Level I, Level II, or Level III studies). Total ESS score from each step of the referral pathway was the primary outcome variable. The audit period included government-funded patients for the first 3 months and privately referred patients for the first 6 months of 2012 and 2014, respectively. We exclusively selected patients referred with suspected sleep apnea, excluding patients who had sleep assessments for adjustment of treatment device settings, evaluation of current treatments (CPAP, mandibular advancement splint, surgery) and testing for other sleep disorders. If the primary care referral failed to provide an ESS score, they were excluded from the final analysis. ESS scores at primary care referral were compared to ESS scores at first specialist assessment (FSA) or ESS performed at sleep study assessment (two-tailed t test for paired samples). We used the FSA in most cases; however, some patients were referred directly to sleep study before FSA in which case we used the earliest ESS score. The patients had no intervention between primary care referral (apart from being given conservative management advice, eg, weight loss), and the FSA or sleep study.
The ESS repeatability was assessed further using a Bland-Altman analysis11 as well as calculating the percentage of patients with discrepancies ≥ 3, ≥ 5, or ≥ 7 in the ESS score. The Pearson correlation coefficient was calculated to determine correlation of individual scores at primary care and FSA/sleep study.
Ethical approval was obtained from the Otago University Health Sciences Ethics committee via Head of Department approval and the audit was registered with the Capital and Coast District Health Board Audit team.
Analysis was done using SPSS (version 24.0, SPSS, Chicago, Illinois, United States), and values of P < .05 were considered statistically significant.
RESULTS
A cohort of 328 patients was reviewed to form the dataset. A total of 154 patients during the audit period had complete ESS data available and were included in the analysis, as shown in Figure 1. The 146 subjects missing ESS data and excluded were not different from the analysis group in terms of age (included versus excluded mean ± standard deviation [SD]: 50.9 ± 13.7 versus 52.4 ± 12.7 years, P = .33), sex (χ2 = 1.500, 1 df, P = .221), AHI (42.7 ± 39.9 versus 40.7 ± 37.9 events/h, P = .65), or BMI (36.3 ± 9.9 versus 34.2 ± 8.5 kg/m2, P = .06) but were more likely to have been referred privately than to the government-funded sleep service (χ2 = 32.6, 1 df, P < .05).
Figure 1. Subject inclusion pathway.
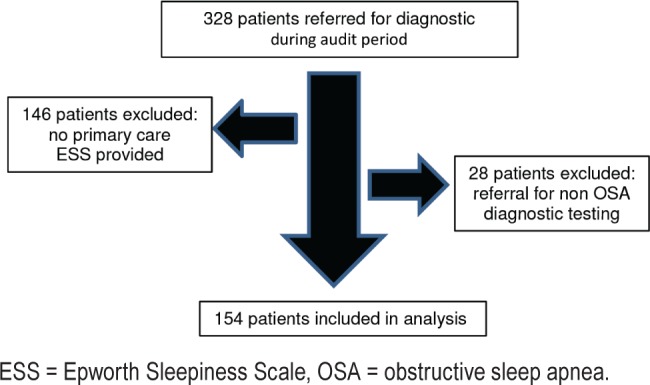
ESS = Epworth Sleepiness Scale, OSA = obstructive sleep apnea.
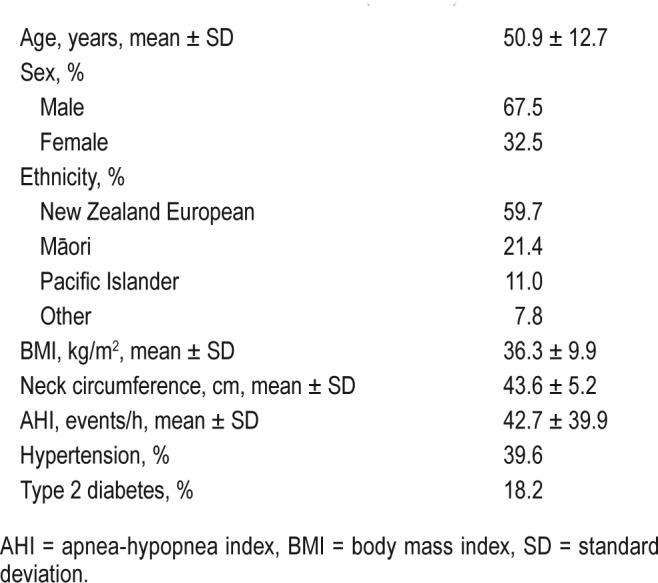
Table 1 reports patient characteristics. The mean ± SD age of our study sample was 50.9 ± 12.7 years and 67.5% were male. The study sample had anthropomorphic features associated with OSA, with a mean BMI of 36.3 ± 9.9 kg/m2 and neck circumference of 43.6 ± 5.2 cm. Mean AHI for the sample was 42.7 ± 39.9 (range 0 to 165) events/h. There was a high proportion of patients in whom comorbidities had been diagnosed, including 39.6% with hypertension and 18.2% with type 2 diabetes.
Table 1.
Patient characteristics (n = 154).
There was no statistically significant difference between the mean ESS score of 13.7 ± 4.9 at the time of primary care referral and 13.5 ± 4.6 at sleep study/FSA visit (P = .61). The average ESS score change was −0.2 with SD of 3.9 (Figure 2). When a multivariable analysis of covariance was conducted with age, BMI, AHI as covariates and sex, diabetes, and hypertension as factors, only age was significantly related to the change in ESS score (F1,145 = 7.325, P = .008). However, we note that the R2 value was quite small, with an adjusted R2 of 0.030; we can only conclude that 3% of the variability in ESS change was explained by all the predictors in the model. There appears to be no bias in the change of ESS scores, with equal differences spread across the full range of possible ESS scores.
Figure 2. Bland-Altman analysis of ESS at primary care referral and FSA/sleep study.
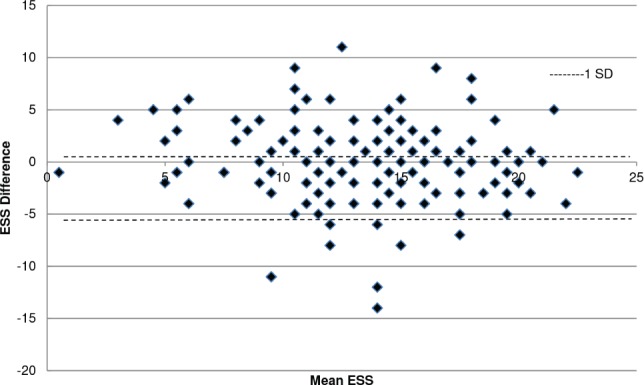
ESS = Epworth Sleepiness Scale, FSA = first specialist assessment, SD = standard deviation.
There was good correlation between ESS at primary care referral and ESS done at FSA/sleep study (coefficient of determination = 0.45, P < .01, Figure 3). Eleven patients (7%) had an ESS score above 10 at the time of primary care referral and an ESS score < 10 at time of sleep study/FSA visit, and 12 patients (7.8%) reported an ESS score < 10 at primary care referral but an ESS score > 10 at sleep study/FSA visit.
Figure 3. Correlation between ESS at primary care referral and FSA/sleep study.
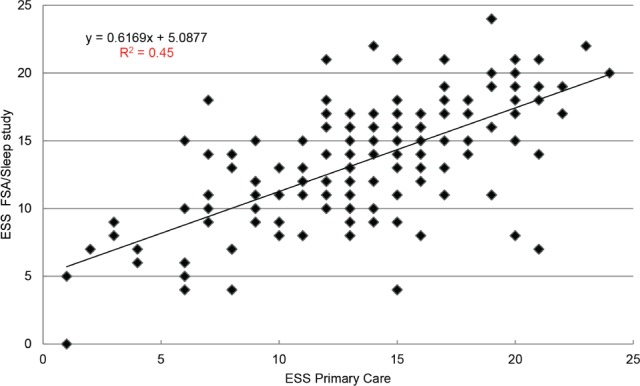
ESS = Epworth Sleepiness Scale, FSA = first specialist assessment.
An ESS score difference of 3 or higher occurred in 46% of patients, an ESS score difference of 5 or higher occurred in 21% of patients, and an ESS score difference of 7 or higher occurred in 8% of patients (Table 2). This is shown alongside data from studies by Johns, Chung, and Nguyen et al.8,10,12 The two studies by Johns and Chung show ESS discrepancy with healthy participants,8,12 whereas the study by Nguyen et al. is a sample of patients with suspected OSA.10
Table 2.
Discrepancy between ESS score in studies that measured test-retest reliability.

DISCUSSION
The ESS is a simple, self-administered subjective sleepiness questionnaire for evaluating propensity to sleep during the day. The study found that along a clinical pathway, repeated measures of the ESS varied to a surprisingly great extent. We did not find, as we had originally hypothesized, evidence between the two timepoints of ESS inflation with higher primary care scores or an increase over time as might be expected in an increasingly resource-constrained, government-funded health system. The variability was high in our clinical population, which needs to be carefully considered in the context of prioritization and determining access to government funded services or treatments.
There is limited evidence on the ESS test-retest reproducibility in the literature.13 Early studies by Johns and Chung evaluated reproducibility of the ESS using only control subjects, rather than in patients with suspected sleep apnea.8,12 A Canadian study in 2006 was the first, to our knowledge, to evaluate reproducibility of the ESS in patients with suspected sleep apnea.10 These patients were referred from private snoring clinics to a tertiary sleep clinic; this is similar to the current study, except current referrals were from primary care physicians. The studies using healthy subjects had much less discrepancy in ESS scores but also had similar measures of spread (Johns: SD = 2.3; Chung: SD = 2.4 ESS points).8,12
In this study we evaluated the test-retest variability of the ESS in our cohort of patients with suspected OSA by analyzing the percentage of subjects who had a difference of at least 2, 3, 5, and 7 between ESS scores. Comparing against previous evaluation studies, our findings of 46% of our subjects having an ESS change of 3 or higher and 21% having a change in ESS score of 5 or higher are similar to the discrepancy seen from the study by Nguyen et al. where subjects were also patients with suspected OSA.10 The spread of ESS score change was also similar, with both our study and that of Nguyen et al. reporting an SD of 3.9.10
This study has a number of strengths in terms of number of data points collected and the nonbias of the results in terms of patients not knowing we would compare answers. The final study population represents a typical clinical sleep apnea cohort and a mix of both male, female, and age ranges and New Zealand ethnicities.
A limitation of the study is being unable to confirm that both measures of ESS were completed by the subject themselves and not family or doctor. Our study population also included individuals of several ethnicities and therefore English comprehension may have varied across the group and altered the ESS score. The average time between measures was not systematically recorded but was usually less than 6 months. It is therefore possible that some of the variability could be explained by changes in levels of subjective sleepiness related to the effects of conservative treatment advice, or an increase or reduction in total sleep time.
The ESS does not correlate well with polysomnography metrics of OSA severity when evaluating excessive daytime sleepiness and has limited predictability for patients with suspected OSA.14,15 The Sleep Heart Health Study reports a significant number of subjects with severe OSA and low ESS scores (40.2%) and a proportion of subjects with higher ESS scores (> 10) had an AHI of < 5 events/h,16 reducing confidence in the ESS alone to help predict OSA. However, it is widely used to assist with prioritization of suspected OSA referrals (United Kingdom and New Zealand).17,18
The total ESS score is being used as a measure to help identify increased crash risk. In a study of commercial drivers by Howard et al.,19 a high total ESS score predicted higher accident risk; however, in a New Zealand adult population the total score did not predict crash risk.3 In the New Zealand study, question 8 in the ESS (related to being in a car) was independently related to a positive answer to questions about self-reported accidents in the past 3 years. These effects remained significant after controlling for increasing time on the road per week, male sex, and lower age,3 which are all recognized risk factors for automobile crashes. Sleepiness in cars, in the situations described in the ESS, seems to predispose middle-aged people to all types of crash involvement, not just crashes they thought were specifically due to fatigue or to falling asleep.3
In the current study, the Bland-Altman plot demonstrated a wide scatter of values for intrasubject ESS score differences on sequential testing, with 95% of differences ranging from nearly −8 to +8 and a mean change of 0.2 (P = .61). There is no evidence to suggest bias between sequential ESS scores at different pathway steps but that scores can go up or down. Nguyen et al., who retrospectively assessed the repeatability of the ESS with a similar patient population and context to the current study, found similar findings.10
CONCLUSIONS
Although the current study found no specific bias to ESS scores at different referral OSA pathway steps, the ESS can vary up or down across the referral process in a clinical cohort. Therefore, care must be taken when using the ESS as a prioritization or treatment decision tool.
DISCLOSURE STATEMENT
Work for this study was performed at the Otago University Wellington. All authors have seen and approved the manuscript. Funding was supplied by Maurice and Phyllis Paykel Trust The authors report no conflicts of interest.
ACKNOWLEDGMENTS
Funding was supplied by Maurice and Phyllis Paykel Trust. Statistical advice provided by Dalice Sim.
ABBREVIATIONS
- AHI
apnea-hypopnea index
- BMI
body mass index
- ESS
Epworth Sleepiness Scale
- FSA
first specialist assessment
- OSA
obstructive sleep apnea
- SD
standard deviation
REFERENCES
- 1.Mihaere K, Harris R, Gander P, et al. Obstructive sleep apnoea in New Zealand adults: prevalence and risk factors among Maori and non-Maori. Sleep. 2009;32(7):949–956. doi: 10.1093/sleep/32.7.949. [DOI] [PMC free article] [PubMed] [Google Scholar]
- 2.Greenstone M, Hack M. Obstructive sleep apnoea. BMJ. 2014;348:g3745. doi: 10.1136/bmj.g3745. [DOI] [PubMed] [Google Scholar]
- 3.Gander PH, Marshall NS, Harris RB, Reid P. Sleep, sleepiness and motor vehicle accidents: a national survey. Aust NZ J Public Health. 2005;29(1):16–21. doi: 10.1111/j.1467-842x.2005.tb00742.x. [DOI] [PubMed] [Google Scholar]
- 4.Marshall N, Wong K, Liu P, et al. Sleep apnea as an independent risk factor for all-cause mortality: the Busselton Health Study. Sleep. 2008;31(8):1079–1085. [PMC free article] [PubMed] [Google Scholar]
- 5.Johns M. A new method for measuring daytime sleepiness: the Epworth Sleepiness Scale. Sleep. 1991;14(6):540–545. doi: 10.1093/sleep/14.6.540. [DOI] [PubMed] [Google Scholar]
- 6.Scott H, Scott W, Mihaere K, et al. Economic evaluation of the treatment of obstructive sleep apnoea syndrome in Aoteraroa/New Zealand. IRBRP. 2007;3(2):237–261. [Google Scholar]
- 7.Gander P, Scott G, Mihaere K, et al. Societal costs of obstructive sleep apnoea syndrome. NZ Med J. 2010;123(1321):13–23. [PubMed] [Google Scholar]
- 8.Johns M. Reliability and factor analysis of the Epworth Sleepiness Scale. Sleep. 1992;15(4):376–381. doi: 10.1093/sleep/15.4.376. [DOI] [PubMed] [Google Scholar]
- 9.Jenkinson C, Davies RJ, Mullins R, et al. Comparison of therapeutic and subtherapeutic nasal continuous positive airway pressure for obstructive sleep apnoea: a randomised prospective parallel trial. Lancet. 1999;353(9170):2100–2105. doi: 10.1016/S0140-6736(98)10532-9. [DOI] [PubMed] [Google Scholar]
- 10.Nguyen A, Baltzan M, Small D, et al. Clinical reproducibility of the Epworth Sleepiness Scale. J Clin Sleep Med. 2006;2(2):170–174. [PubMed] [Google Scholar]
- 11.Bland J, Altman D. Statistical methods for assessing agreement between two methods of clinical measurement. Lancet. 1986;1:307–310. [PubMed] [Google Scholar]
- 12.Chung K. Use of the Epworth Sleepiness Scale in Chinese patients with obstructive sleep apnea and normal hospital employees. J Psychosom Res. 2000;49(5):367–372. doi: 10.1016/s0022-3999(00)00186-0. [DOI] [PubMed] [Google Scholar]
- 13.Kendzerska T, Smith P, Brignardello-Petersen R, et al. Evaluation of the measurement properties of the Epworth Sleepiness Scale: a systematic review. Sleep Med Rev. 2014;18(4):321–331. doi: 10.1016/j.smrv.2013.08.002. [DOI] [PubMed] [Google Scholar]
- 14.Bausmer U, Gouveris H, Selivanova O, et al. Correlation of the Epworth Sleepiness Scale with respiratory sleep parameters in patients with sleep-related breathing disorders and upper airway pathology. Eur Arch Otorhinolaryngol. 2010;267(10):1645–1648. doi: 10.1007/s00405-010-1250-y. [DOI] [PubMed] [Google Scholar]
- 15.Sil A, Barr G. Assessment of predictive ability of Epworth scoring in screening patients with sleep apnoea. J Laryngol Otol. 2012;126(4):372–379. doi: 10.1017/S0022215111003082. [DOI] [PubMed] [Google Scholar]
- 16.Kapur VK, Baldwin CM, Resnick HE, Gottlieb DJ, Nieto J. Sleepiness in patients with moderate to severe sleep-disordered breathing. Sleep. 2005;28(4):472–477. doi: 10.1093/sleep/28.4.472. [DOI] [PubMed] [Google Scholar]
- 17.New and updated pathways: August 2014. Obstructive sleep apnoea/hypopnoea (OSAHS) Map of Medicine website. [Accessed August 17, 2017]. http://mapofmedicine.com/care-pathway-update-publication-august-2014/. Published August 1, 2014.
- 18.Epton MJ, Kelly PT, Shand BI, et al. Development and outcomes of a primary care-based sleep assessment service in Canterbury, New Zealand. NPJ Prim Care Respir Med. 2017;27(1):26. doi: 10.1038/s41533-017-0030-1. [DOI] [PMC free article] [PubMed] [Google Scholar]
- 19.Howard ME, Desai AV, Grunstein RR, et al. Sleepiness, sleep-disordered breathing, and accident risk factors in commercial vehicle drivers. Am J Respir Crit Care Med. 2004;170(9):1014–1021. doi: 10.1164/rccm.200312-1782OC. [DOI] [PubMed] [Google Scholar]