Abstract
Background
The relationships between scan duration, signal-to-noise ratio (SNR) and sample size must be considered and understood to design optimal GABA-edited magnetic resonance spectroscopy (MRS) studies.
New Method
Simulations investigated the effects of signal averaging on SNR, measurement error and group-level variance against a known ground truth. Relative root mean square errors (measurement error) and coefficients of variation (group-level variance) were calculated. GABA-edited data from 18 participants acquired from five voxels were used to examine the relationships between scan duration, SNR and quantitative outcomes in vivo. These relationships were then used to determine the sample sizes required to observe different effect sizes.
Results
In both simulated and in vivo data, SNR increased with the square root of the number of averages. Both measurement error and group-level variance were shown to follow an inverse-square-root function, indicating no significant impact of cumulative artifacts. Comparisons between the first two-thirds of the data and the full dataset showed no statistical difference in group-level variance. There was, however, some variability across the five voxels depending on SNR, which impacted the sample sizes needed to detect group differences in specific brain regions.
Comparison with Existing Methods
Typical scan durations can be reduced if taking into account a statistically acceptable amount of variance and the magnitudes of predicted effects.
Conclusions
While scan duration in GABA-edited MRS has typically been considered in terms of SNR, it is more appropriate to think in terms of the amount of measurement error and group-level variance that provides sufficient statistical power.
Keywords: edited MRS, GABA, sample size, scan duration, signal-to-noise ratio, quantification
1. Introduction
Measurement of in vivo γ-aminobutyric acid (GABA) using J-difference spectral-edited 1H magnetic resonance spectroscopy (MRS) at 3 Tesla (T) is increasingly performed in clinical and cognitive neuroscience (Ende, 2015; Öz et al., 2014). Spectral editing is the recommended approach for detecting GABA due to its inherently low concentration and the overlapping signals of more abundant metabolites. Spectral editing exploits the properties of scalar coupling to resolve the signals of lower-concentration metabolites that are typically overlapped by other stronger signals. Narrowband radiofrequency editing pulses are used to selectively modulate the spin systems of scalar-coupled molecules (e.g., GABA) such that the overlapping signals of metabolites are removed and the desired signal is retained (Harris et al., 2017).
Although spectral editing is effective in resolving the signal of lower-concentration metabolites, the detected signals have relatively low amplitudes (due to both low concentration and splitting due to coupling). Thus, the relatively low signal-to-noise ratio (SNR) of these weak signals requires extensive signal averaging: typically, several hundreds of averages are acquired over a timespan of approximately ten minutes. However, there is increasing demand to limit the total scan duration for increased participant compliance and/or to enable more measurements within a scan session (e.g., to measure metabolites in more brain regions or to perform other MRI acquisitions). While the theoretical relationship between SNR and signal averages is well-understood, and guidelines exist for the number of signal averages to acquire (based on the acquisition parameters of previous studies, for instance), there has not been a concentrated effort to understand the relationships between SNR, measurement error and group-level variance in the context of edited MRS experiments. In an earlier methodological review of MRS of GABA, Puts and Edden (2012) noted that the average SNR of GABA measurements reported in studies up until that point was equivalent to a 7-min acquisition in a 27-mL voxel at 3T. Currently, a typical scan time for editing GABA tends more conservatively toward 10 min, though the balance between SNR and measurement time for a given edited measurement varies based on the needs of a specific study (Mullins et al., 2014).
For given levels of longitudinal and transverse relaxation and efficacy of RF coil hardware, and standardized acquisition methodology, the SNR of an uncoupled singlet resonance can be expressed as SNR ∝ B0V√N, where B0 is the main magnetic field strength, V is the volume of the MRS voxel and N is the number of repetitions (signal averages). The √N term arises because MR signals are phase-coherent and noise is an inherently random process; therefore, signal will increase faster than noise does (Ernst, 1965; Traficante, 1991). The noise in the measurement arises from a combination of thermal noise caused by the Brownian motion of electrons in tissue and RF coils, system noise in MRI scanners and physiological noise in biological samples (Edelstein et al., 1986; Hoult and Richards, 1976; Krüger and Glover, 2001; Redpath, 1998).
The physical properties of MR spectra, such as SNR and linewidth, and their impact on quantification reliability have been investigated in the past, but only for unedited MRS acquisitions. Kanowski et al. (2004) found a moderate effect of SNR and linewidth on error estimates of metabolite measurements at 1.5T, which was more pronounced for lower-concentration metabolites. Macrì et al. (2004) reported similar findings at this field strength in the cerebellum. These effects were more unambiguously observed by Bartha (2007) for measurements detected at 4T. It should be pointed out that unedited spectra are typically quantified using linear-combination modeling, where measurement error will be highly dependent on the parameters of the metabolite basis set, and SNR-proportional biases in quantified concentrations are commonly observed. Thus, measurement error will also depend on which metabolites or macromolecules are included in the basis set as well as on the amount of noise filtering that is applied (Bartha et al., 1999; Jiru et al., 2006; Macrì et al., 2004).
Experimental design must consider both predicted measurement error (i.e., intraindividual variability) and the predicted interindividual variance of a sample cohort. For a given sample of MRS measurements, interindividual differences will contribute a fixed amount of variance that does not depend on SNR, while intraindividual measurement error will reduce with increasing measurement SNR. Especially concerning for edited MRS is the possibility that motion-related subtraction artifacts (Evans et al., 2013; Harris et al., 2014) might accumulate with increasing scan duration, leading to an increasing variance component. Therefore, an objective of this paper is to appraise the effects of signal averaging on the SNR of GABA-edited spectra, and the associated effects on measurement error and group-level variance. Understanding how SNR relates to these sources of variance enables the design of optimized edited MRS experiments, both by considering the required number of signal averages for a single acquisition and providing guidance on the required sample sizes for a predicted effect.
In this paper, we examine the degree to which signal averaging limits reliable quantification in edited MRS measurements, with a specific focus on GABA editing. Through simulations and analysis of in vivo data we demonstrate that group-level variance stabilizes (i.e., reaches a limit where gains become minimal and not statistically different) in spite of unlimited increases in SNR. Using these results, we then calculate the sample sizes required to detect group differences of varying magnitudes as a function of number of signal averages.
2. Methods
2.1. Simulations
Simulations were run to assess the effect of SNR on measurement error and group-level variance in edited MRS data with a known ground truth. Twenty simulated datasets of GABA-edited MEGA-PRESS (Mescher et al., 1998) acquisitions with known signal integrals and fixed linewidth were generated. Each acquisition was then used to generate 160 pairs of ON/OFF subspectra (320 averages). Randomly generated Gaussian noise was added to each subspectrum such that the GABA SNR of the edited difference (DIFF) spectra of the full acquisition (320 averages) was ∼25, as estimated from a previous study (Mikkelsen et al., 2017). For each dataset, DIFF spectra were generated by binning into 8x averages, where 1 ≤ x ≤ 40, giving 40 spectra per dataset of increasing SNR. The 3.0 ppm GABA signal in each DIFF spectrum was fitted with a two-Gaussian function using nonlinear least-squares regression and then integrated. SNR was measured in the frequency domain as the ratio between the amplitude of the modeled GABA signal and twice the standard deviation of noise signal between 9 and 10 ppm (Mikkelsen et al., 2017). Model fit error was calculated as the standard deviation of the fit residuals normalized to the amplitude of the modeled GABA signal. Simulations were performed in MATLAB (The MathWorks Inc., Natick, MA); the GABA-edited MEGA-PRESS spectra were simulated using FID-A (Simpson et al., 2017). ON/OFF subspectra were simulated with a basis set of 14 metabolites, a residual water signal and eight macromolecule resonances as described previously (Near et al., 2013). These simulations were repeated 200 times for each of the 20 datasets, where noise was resampled each time.
Measurement error was assessed by calculating the relative root mean square error (RRMSE) (Sundin et al., 1999) of the modeled GABA signal integral for each dataset at each level of signal averaging:
| [1] |
where B is the number of simulations run, Ip is the true GABA signal integral for dataset p and is the modeled GABA signal integral for the pth dataset in the bth simulation. As a measure of group-level variance, the coefficient of variation (CV) of modeled signal integrals across the datasets was calculated at each level of signal averaging for each simulation. A square-root function was fitted to the mean of SNR values for each dataset to determine how well the estimated SNR followed the expected relationship:
| [2] |
where n is the number of binned signal averages and a represents the SNR of the first 8 averages. Assuming measurement error is inversely proportional to SNR, an inverse-square-root function was fitted to the mean of model fit errors for each dataset and to the mean of RRMSEs:
| [3] |
where b accounts for the error arising from imperfect modeling of the GABA signal and a + b is the model fit error of the first 8 averages.
2.2. In Vivo Experiments
Similar analyses were performed on in vivo GABA-edited data from a previously published study (Harris et al., 2015). Briefly, MEGA-PRESS was used to acquire GABA-edited measurements in 18 healthy adults (27.8 ± 4.0 years; 11 females/7 males) in five separate voxels (Figure 1): auditory cortex (AUD); dorsolateral prefrontal cortex (DLFPC); frontal eye field (FEF); sensorimotor cortex (SM); and occipital cortex (OCC). These voxel locations are typical for in vivo MRS studies as described previously (Boy et al., 2011; Gaetz et al., 2014; Puts et al., 2011; Sumner et al., 2010). MEGA-PRESS acquisition parameters were: 14-ms sinc-Gaussian editing pulses (ON/OFF = 1.9/7.46 ppm); TR/TE = 2000/68 ms; 320 averages with ON/OFF scans alternating every 2 TRs (∼10 min scan time); 2048 discrete data points; 2 kHz spectral width. Acquisitions were performed on a 3T Philips Achieva scanner (Philips Healthcare, The Netherlands) using a 32-channel phased-array head coil. Voxel sizes were 3 × 3 × 3 cm3 for all voxels except the AUD voxel, which was 4 × 3 × 2 cm3. Scans were performed with approval from the local institutional review board and with written informed consent from volunteers.
Figure 1.
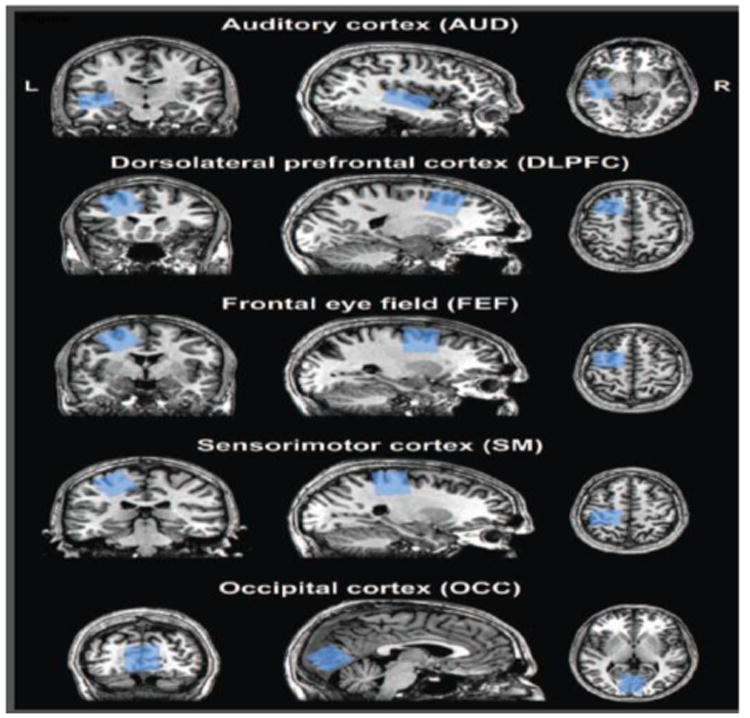
Representative placement of the five MRS voxels. The voxel masks for one participant are co-registered onto their corresponding high-resolution structural image.
2.3. Data Processing
Data were analyzed in Gannet (Edden et al., 2014) following the software's automated data processing pipeline and using additional custom in-house MATLAB code (Mikkelsen et al., 2017). To test the SNR dependence of the in vivo GABA-edited measurements, cumulatively binned averages of 4x TRs were calculated as above. Due to excessive B0 field drift and/or participant head motion that could not be resolved with retrospective frequency-and-phase correction (Near et al., 2015), 10 datasets were excluded from further analysis (2 AUD, 2 DLPFC, 1 FEF, 3 OCC, 2 SM). The outlier rejection algorithm in Gannet removed up to 20 bad averages, so for consistency, all edited measurements were based on acquisitions with up to 300 signal averages. Spectra were generated using 4x averages (as ON/OFF scans were interleaved every 2 TRs), where 1 ≤ x ≤ 75. For every spectrum, GABA+/creatine (Cr) was quantified, using a three-Gaussian function to fit the 3.0 ppm GABA+ and 3.75 glutamate + glutamine (Glx) signals in the DIFF spectrum. A two-Lorentzian function was fitted to the choline and Cr signals in the OFF spectrum. GAB A SNR was measured as the ratio between the amplitude of the modeled GABA+ signal and twice the standard deviation of noise signal based on the algorithm described by Mikkelsen et al. (2017). Model fit error was measured as with the simulated data (refer to Section 2.1).
2.4. Statistical Analysis
To examine the impact of the number of signal averages in an acquisition on the group-level variance of the in vivo data, and thus the number of averages necessary for an empirical study, the variances of the in vivo GABA+/Cr measurements in each of the five voxels binned into 16, 40, 64, 96, 140 and 200 averages were compared against the variance of the bin containing 300 averages using Levene tests for equality of variances. Pearson correlation coefficients were also calculated to test the linear relationship between the bins containing 16, 40, 64, 96, 140 and 200 averages and the bin containing 300 averages. A p-value of less than 0.05 was considered significant. Corrections for multiple comparisons were not applied as the five voxel measurements are from the same subjects and therefore not completely independent.
2.4.1 Sample Size Calculations
Assuming equal variances and equal sample sizes per group, for a statistical comparison of two groups, the required sample size (s) per group can be calculated as:
| [4] |
where Zα/2 is a constant that sets the alpha level (here, Zα/2 = 1.96 for an alpha = 0.05 in a two-tailed test), Z1–β is a constant that sets the statistical power (here, Z1–β = 0.842 for 80% power), σ is the group standard deviation and Δ is the predicted difference in group means (i.e., the effect size). Using the in vivo data, we ran sample size calculations for predicted differences in GABA+/Cr of 10–30% in steps of 5%. The value σ was estimated from the modeled group-level CV of GABA+/Cr measurements at each level of signal averaging for each of the five voxels. More specifically, we modeled the relationship between number of signal averages and CV using Eq. [3]. To avoid the scenario where outliers greatly inflated the CV and thus caused the fitting routine to fail, a median absolute deviation algorithm (Leys et al., 2013) was used to exclude outliers at each level of signal averaging, where the recommended deviation threshold of 2.5 was applied. After deriving these models from the data, s was calculated for the five effect sizes for each voxel as a function of number of signal averages.
3. Results
3.1. Simulations
The simulations showed that model fitting of the GABA signal at the dataset-level resulted in decreasing measurement error with increasing number of averages, as expected. Additionally, GABA SNR showed increasing gains with the number of averages according to Eq. [2]. Conversely, model fit error decreased with the number of averages according to Eq. [3]. In Figure 2, example calculated integrals (Figure 2a), SNR values (Figure 2b) and model fit errors (Figure 2c) for a single dataset plotted as a function of number of binned signal averages for each of the 200 simulations are shown illustrating these observed relationships.
Figure 2.
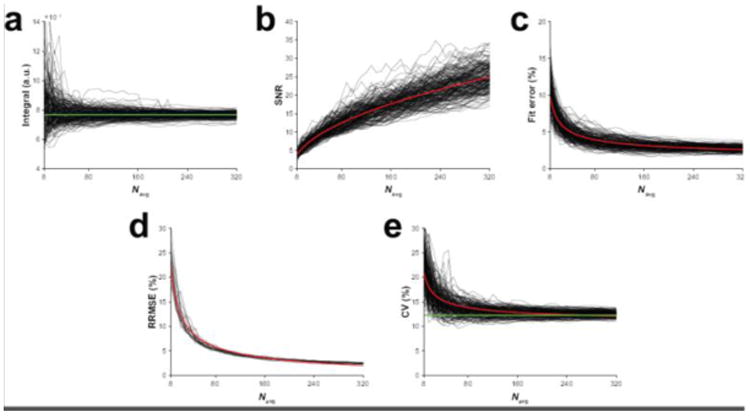
Results from the simulations. (a) The modeled GABA signal integral, (b) GABA SNR and (c) GABA model fit error as a function of the number of cumulatively binned signal averages for one example simulated GABA-edited MEGA-PRESS dataset. The output from each of the 200 repeated simulations is displayed. (d) RRMSEs as a function of the number of cumulatively binned signal averages for the 20 simulated datasets. (e) The group-level CV of the dataset cohort as a function of the number of cumulatively binned signal averages in each of the 200 repeated simulations. The red lines in (b–e) are the modeled relationships of SNR, model fit error, RRMSE and CV as a function of the number of signal averages according to square-root and inverse-square-root functions. The green lines in (a) and (e) indicate the true integral of the example dataset and the CV of the 20 datasets, respectively.
Figure 2d shows the RRMSEs of the estimated integrals for each dataset as a function of number of signal averages. These also follow an inverse-square-root function, indicating that measurement error continues to decrease as the number of signal averages, and SNR, increase. This suggests that uncertainty in the model estimate of signal area is inversely related to SNR. Estimation of the CV at the group-level showed a similar inverse-square-root relationship (Figure 2e), with the estimates approaching the underlying true CV of 12.3%. More importantly, however, after only half the full acquisition, the observed mean CV was already very close to the underlying true CV (12.8% at halfway vs. 12.5% at full acquisition vs. 12.3% at ground truth), emphasizing that although there are unlimited (if diminishing) SNR gains through signal averaging, the degree of group-level variance is acceptable in statistical terms at a relatively early time point.
3.2. In Vivo Experiments
Figure 3 shows example in vivo GABA-edited DIFF spectra and the corresponding GABA+/Cr values from one participant's dataset acquired in an OCC voxel binned into 16, 40, 64, 96, 140, 200 and 300 averages. The 3.0 ppm GABA+ signal lineshape is qualitatively similar between 140 and 300 averages. Beyond 96 averages, the fit residuals (for this particular dataset) are dominated by subtraction artifacts and imperfect modeling of the GABA signal with a single Gaussian. Figure 4a shows that the group-level variance (CV) of GABA+/Cr measurements stabilizes at approximately 200 averages. The results of the variance tests (Table 1) confirmed that there were no statistically significant differences between 200 and 300 averages. For the OCC and SM voxels, no statistically significant differences in variance were observed between 300 and even lower numbers of averages (64 and 16, respectively). The results from the correlational tests (Figure 4b) further exemplify the voxel-dependent differences in signal averaging effects on the measurement error. That is, for a given voxel location, different numbers of averages are required to achieve data quality comparable with a full acquisition (300 averages).
Figure 3.
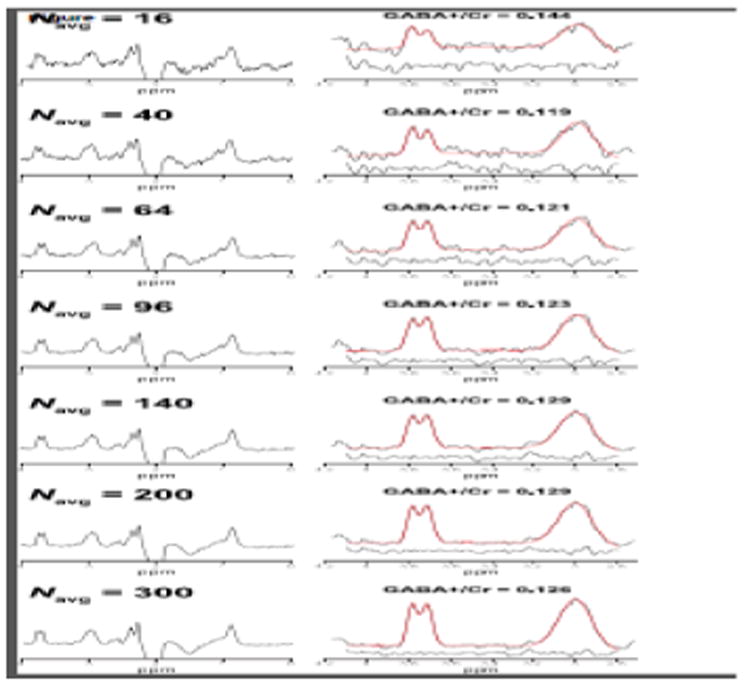
Example GABA-edited DIFF spectra from one in vivo dataset acquired from an OCC voxel. Each spectrum represents the data binned into 16, 40, 64, 96, 140, 200 and 300 signal averages. The right column shows the edited GABA+ and Glx signals with the corresponding three-Gaussian model fits overlaid in red. Fit residuals are shown below the fitted data.
Figure 4.
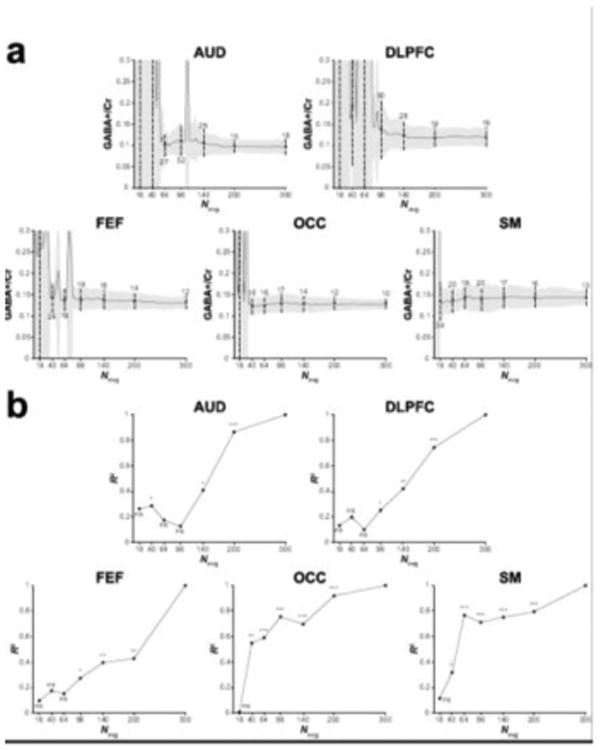
(a) Group GABA+/Cr measurements for the five voxels displayed as a function of the number of cumulatively binned signal averages. The solid black lines show the mean across the group. The grey shaded area is the corresponding standard deviation. The dots and black lines show the mean and standard deviation for the data containing 16, 40, 64, 96, 140, 200 and 300 signal averages. The associated CV is shown as a percentage above or below the dashed lines. (b) R2 values from the correlational analyses of the GABA+/Cr data for the five voxels. Participants' GABA+/Cr data containing 16, 40, 64, 96, 140 and 200 signal averages were correlated against the data containing 300 signal averages. *** p < 0.001, ** p < 0.01, * p < 0.05, ns = non-significant.
Table 1.
Levene test statistics and degrees of freedom (W(df1, df2)) displaying the significant and nonsignificant differences in group-level variance in the in vivo GABA+/Cr measurements derived from 16, 40, 64, 96, 140 or 200 signal averages compared to the full dataset (the data containing 300 averages) for each of the five voxels. Note that df2 differs across the voxels as some datasets were removed from further analysis following data quality control.
| Navg (vs. 300) | Voxel | ||||
|---|---|---|---|---|---|
|
| |||||
| AUD | DLPFC | FEF | OCC | SM | |
| 16 | 4.63(1, 28)* | 4.54(1, 32)* | 4.48(1, 32)* | 4.44(1, 30)* | 1.54(1, 32) |
| 40 | 4.50(1, 28)* | 18.00(1, 32)*** | 9.56(1, 32)** | 6.80(1, 30)* | 2.82(1, 32) |
| 64 | 4.65(1, 28)* | 4.15(1, 32)* | 5.47(1, 32)* | 3.52(1, 30) | 1.30(1, 32) |
| 96 | 6.52(1, 28)* | 5.25(1, 32)* | 5.61(1, 32)* | 1.48(1, 30) | 0.49(1, 32) |
| 140 | 6.27(1, 28)* | 2.01(1, 32) | 2.88(1, 32) | 0.68(1, 30) | 0.20(1, 32) |
| 200 | 0.15(1, 28) | 0.25(1, 32) | 1.03(1, 32) | 0.44(1, 30) | 0.37(1, 32) |
p < 0.001,
p < 0.01,
p < 0.05.
The relationship between number of signal averages and SNR (Figure 5a) and between number of signal averages and model fit error (Figure 5b) of the in vivo data matched the findings from the simulations, there are increasing gains in SNR and reductions in measurement error observed with increasing number of averages.
Figure 5.
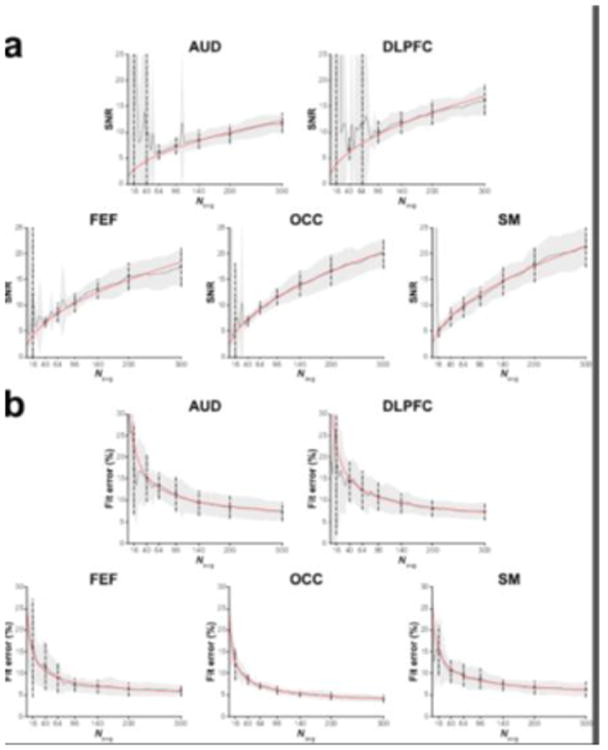
(a) Group GABA SNR values and (b) GABA model fit errors for the five voxels displayed as a function of the number of cumulatively binned signal averages. The solid black lines show the mean across the group. The grey shaded area is the corresponding standard deviation. The dots and dashed lines show the mean and standard deviation for the data containing 16, 40, 64, 96, 140, 200 and 300 signal averages. The red lines represent either the corresponding square-root (in a) or inverse-square-root (in b) model of the data.
3.3. Sample Size Calculations
Figure 6a displays the relationship between signal averages and group-level CV. This was well-approximated by the inverse-square-root function. The sample size calculations (Figure 6b) showed that the required number of participants per group varies across voxels. More importantly, these calculations demonstrate, firstly, that given a large enough effect size, scan duration can be reduced by a significant margin (from a practical perspective) while still achieving a given degree of statistical power and, secondly, that acquisitions from certain voxels require much larger cohorts for a given predicted effect size.
Figure 6.
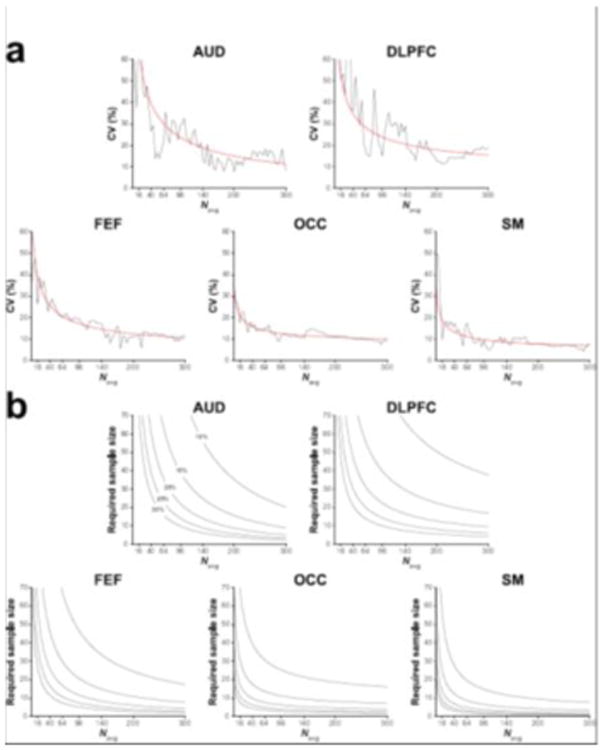
(a) Group-level CV of GABA+/Cr for the five voxels displayed as a function of the number of cumulatively binned signal averages. The red lines represent the corresponding inverse-square-root model of the data. (b) Estimated sample sizes (per group) required for a statistical comparison of two groups given various predicted effect sizes (differences of 10–30% in GABA+/Cr) displayed as a function of the number of signal averages. Statistical power = 80%; alpha level = 0.05.
4. Discussion
We have shown that signal averaging does indeed lead to unlimited gains in SNR in edited-MRS data. This follows a square-root function as predicted by the law of signal averaging. In addition, measurement error decreases with the number of signal averages according to an inverse-square-root function. We demonstrate that there are minimal gains in the decrease in group-level variance in edited measurements after a certain number of signal averages, but there is variation in this resulting from the location of MRS voxels in in vivo data. Finally, based on these findings, we determined the sample sizes needed to detect various effect sizes, providing a framework for the design of GABA-edited MRS studies.
Our findings indicate that metabolite quantification in GABA-edited MRS is typically not SNR-limited in the sense that estimated GABA+/Cr values, and the group-level variance of these, reach statistical equivalence (i.e., measured GABA+/Cr levels are not statistically different) as early as 7 min into a 10-min scan. Therefore, it appears possible to reduce the number of averages while maintaining an empirically acceptable amount of group variance. Our results show that group-level variance in GABA+/Cr measurements gradually decreases with increasing number of signal averages (Figures 2e and 6a). Table 1 shows there are only minimal gains of no statistical benefit after a certain number of averages. However, it should be reiterated that the observed measurement error and group-level variance varied across voxel locations. This can be seen by the differences in the CV and R2 of GABA+/Cr values in Figure 4. Such variability is likely driven by inherent differences in signal quality from data acquired in voxels prescribed in regions of poorer B0 and B1 homogeneity (in addition to the presence of signal artifacts). It can be further concluded, then, that the required number of signal averages may not be equivalent for two voxels of different locations. Nonetheless, in the best-case scenario where measurement error is dominated by signal noise, we have shown that group-level variance stabilizes earlier than would be expected if considering previous assumptions about gains from SNR improvements.
In addition to the effects of signal averaging on measurement error, spectral artifacts also have an important impact. The most significant artifact in spectral editing is subtraction artifacts (Evans et al., 2013; Harris et al., 2014), which result from frequency and phase misalignment of subspectra. This misalignment occurs from B0 field offsets resulting from participant head motion and/or the heating/cooling of magnet elements, as often seen following heavy gradient duty cycles (Harris et al., 2014). However, in practical circumstances, it is challenging to resolve the exact source of artifacts in in vivo data. If they are a result of motion, shorter duration scans may reduce some of these artifacts. The exact effects of spectral artifacts on reliable metabolite quantification in edited data in the context of signal averaging is beyond the scope of the present study.
Aside from evidence of a decoupling between a priori assumptions of the unlimited benefits of SNR improvement and reliable metabolite quantification in edited measurements, it is worth highlighting that sample size needs to also be considered when designing an MRS study. Increasing the number of participants will lead to a nonlinear increase in statistical power. In the context of edited MRS experiments, signal averaging has a characteristic impact on the number of participants needed to reliably observe a given effect size, which we have shown is both predictable based on the expected group-level variance and dependent on voxel location. Relatedly, MRS researchers should also consider the expected magnitude of the effect under investigation as this will necessarily have an influence on the required sample size. Brix et al. (2017) recently illustrated that for a given number of signal averages in a GABA-edited MEGA-PRESS acquisition the detectable effect size decreases as the number of participants increases (assuming 80% statistical power) according to an inverse-square-root function. Our results extend their findings by fully illustrating the systematic effect of number of signal averages on sample size requirements and providing evidence that this effect is voxel-dependent.
In conclusion, previous assumptions of the necessity for long scan durations for GABA-edited MRS acquisitions may not hold when considering the minimal gains achieved from reductions in group-level variance after a certain number of signal averages. Put differently, the 10-min/27-mL voxel rule-of-thumb need not be a hard-and-fast rule; it is possible to achieve reliable results with fewer averages using the same voxel volume. Thus, the number of averages required for edited MRS studies is not necessarily contingent on obtaining a specific SNR per se but rather on obtaining an empirically acceptable amount of measurement error and group-level variance that provides sufficient statistical power to a study. For certain cohorts or study designs, the option to shorten measurements in a principled manner would be highly beneficial.
Highlights.
Measurement error and group-level variance can be used to optimize scan duration in GABA-edited MRS studies.
Observed measurement variability depends on voxel location.
Scan times may be reduced to ∼7 min or less in contrast to current recommendations (∼10 min).
Sample sizes required to detect various effect sizes as a function of scan duration were calculated.
Acknowledgments
This work was supported by NIH grants R21 NS077300, R01 EB016089 and P41 EB015909 and the Natural Sciences and Engineering Research Council of Canada (NSERC, RGPIN-2017-03875). RSL received funding from NSERC CREATE i3T and NAJP receives salary support from NIH grant K99 MH107719.
Footnotes
Publisher's Disclaimer: This is a PDF file of an unedited manuscript that has been accepted for publication. As a service to our customers we are providing this early version of the manuscript. The manuscript will undergo copyediting, typesetting, and review of the resulting proof before it is published in its final citable form. Please note that during the production process errors may be discovered which could affect the content, and all legal disclaimers that apply to the journal pertain.
References
- Bartha R. Effect of signal-to-noise ratio and spectral linewidth on metabolite quantification at 4 T. NMR Biomed. 2007;20:512–521. doi: 10.1002/nbm.1122. [DOI] [PubMed] [Google Scholar]
- Bartha R, Drost DJ, Williamson PC. Factors affecting the quantification of short echo in-vivo 1H MR spectra: prior knowledge, peak elimination, and filtering. NMR Biomed. 1999;12:205–216. doi: 10.1002/(SICI)1099-1492(199906)12:4<205∷AID-NBM558>3.0.CO;2-1. [DOI] [PubMed] [Google Scholar]
- Boy F, Evans CJ, Edden RAE, Lawrence AD, Singh KD, Husain M, Sumner P. Dorsolateral prefrontal γ-aminobutyric acid in men predicts individual differences in rash impulsivity. Biol Psychiatry. 2011;70:866–872. doi: 10.1016/j.biopsych.2011.05.030. [DOI] [PMC free article] [PubMed] [Google Scholar]
- Brix MK, Ersland L, Hugdahl K, Dwyer GE, Grüner R, Noeske R, Beyer MK, Craven AR. Within- and between-session reproducibility of GABA measurements with MR spectroscopy. J Magn Reson Imaging. 2017;46:421–430. doi: 10.1002/jmri.25588. [DOI] [PubMed] [Google Scholar]
- Edden RAE, Puts NAJ, Harris AD, Barker PB, Evans CJ. Gannet: A batch-processing tool for the quantitative analysis of gamma-aminobutyric acid-edited MR spectroscopy spectra. J Magn Reson Imaging. 2014;40:1445–1452. doi: 10.1002/jmri.24478. [DOI] [PMC free article] [PubMed] [Google Scholar]
- Edelstein WA, Glover GH, Hardy CJ, Redington RW. The intrinsic signal-to-noise ratio in NMR imaging. Magn Reson Med. 1986;3:604–618. doi: 10.1002/mrm.1910030413. [DOI] [PubMed] [Google Scholar]
- Ende G. Proton Magnetic Resonance Spectroscopy: Relevance of Glutamate and GABA to Neuropsychology. Neuropsychol Rev. 2015;25:315–325. doi: 10.1007/s11065-015-9295-8. [DOI] [PubMed] [Google Scholar]
- Ernst RR. Sensitivity Enhancement in Magnetic Resonance. I. Analysis of the Method of Time Averaging. Rev Sci Instrum. 1965;36:1689–1695. doi: 10.1063/1.1719443. [DOI] [Google Scholar]
- Evans CJ, Puts NAJ, Robson SE, Boy F, McGonigle DJ, Sumner P, Singh KD, Edden RAE. Subtraction artifacts and frequency (mis-)alignment in J-difference GABA editing. J Magn Reson Imaging. 2013;38:970–975. doi: 10.1002/jmri.23923. [DOI] [PubMed] [Google Scholar]
- Gaetz W, Bloy L, Wang DJ, Port RG, Blaskey L, Levy SE, Roberts TPL. GABA estimation in the brains of children on the autism spectrum: Measurement precision and regional cortical variation. Neuroimage. 2014;86:1–9. doi: 10.1016/j.neuroimage.2013.05.068. [DOI] [PMC free article] [PubMed] [Google Scholar]
- Harris AD, Glaubitz B, Near J, John Evans C, Puts NAJ, Schmidt-Wilcke T, Tegenthoff M, Barker PB, Edden RAE. Impact of frequency drift on gamma-aminobutyric acid-edited MR spectroscopy. Magn Reson Med. 2014;72:941–8. doi: 10.1002/mrm.25009. [DOI] [PMC free article] [PubMed] [Google Scholar]
- Harris AD, Puts NAJ, Anderson BA, Yantis S, Pekar JJ, Barker PB, Edden RAE. Multi-Regional Investigation of the Relationship between Functional MRI Blood Oxygenation Level Dependent (BOLD) Activation and GABA Concentration. PLoS One. 2015;10:e0117531. doi: 10.1371/journal.pone.0117531. [DOI] [PMC free article] [PubMed] [Google Scholar]
- Harris AD, Saleh MG, Edden RAE. Edited 1H magnetic resonance spectroscopy in vivo: Methods and metabolites. Magn Reson Med. 2017;77:1377–1389. doi: 10.1002/mrm.26619. [DOI] [PMC free article] [PubMed] [Google Scholar]
- Hoult D, Richards R. The signal-to-noise ratio of the nuclear magnetic resonance experiment. J Magn Reson. 1976;24:71–85. doi: 10.1016/0022-2364(76)90233-X. [DOI] [PubMed] [Google Scholar]
- Jiru F, Skoch A, Klose U, Grodd W, Hajek M. Error images for spectroscopic imaging by LCModel using Cramer-Rao bounds. Magn Reson Mater Physics, Biol Med. 2006;19:1–14. doi: 10.1007/s10334-005-0018-7. [DOI] [PubMed] [Google Scholar]
- Kanowski M, Kaufmann J, Braun J, Bernarding J, Tempelmann C. Quantitation of simulated short echo time 1H human brain spectra by LCModel and AMARES. Magn Reson Med. 2004;51:904–912. doi: 10.1002/mrm.20063. [DOI] [PubMed] [Google Scholar]
- Krüger G, Glover GH. Physiological noise in oxygenation-sensitive magnetic resonance imaging. Magn Reson Med. 2001;46:631–637. doi: 10.1002/mrm.1240. [DOI] [PubMed] [Google Scholar]
- Leys C, Ley C, Klein O, Bernard P, Licata L. Detecting outliers: Do not use standard deviation around the mean, use absolute deviation around the median. J Exp Soc Psychol. 2013;49:764–766. doi: 10.1016/j.jesp.2013.03.013. [DOI] [Google Scholar]
- Macrì MA, Garreffa G, Giove F, Guardati M, Ambrosini A, Colonnese C, Maraviglia B. In vivo quantitative 1H MRS of cerebellum and evaluation of quantitation reproducibility by simulation of different levels of noise and spectral resolution. Magn Reson Imaging. 2004;22:1385–1393. doi: 10.1016/j.mri.2004.10.021. [DOI] [PubMed] [Google Scholar]
- Mescher M, Merkle H, Kirsch J, Garwood M, Gruetter R. Simultaneous in vivo spectral editing and water suppression. NMR Biomed. 1998;11:266–272. doi: 10.1002/(SICI)1099-1492(199810)11:6<266∷AID-NBM530>3.0.CO;2-J. [DOI] [PubMed] [Google Scholar]
- Mikkelsen M, Barker PB, Bhattacharyya PK, Brix MK, Buur PF, Cecil KM, Chan KL, Chen DYT, Craven AR, Cuypers K, Dacko M, Duncan NW, Dydak U, Edmondson DA, Ende G, Ersland L, Gao F, Greenhouse I, Harris AD, He N, Heba S, Hoggard N, Hsu T, Jansen JFA, Kangarlu A, Lange T, Lebel RM, Li Y, Lin CE, Liou J, Lirng JF, Liu F, Ma R, Maes C, Moreno-Ortega M, Murray SO, Noah S, Noeske R, Noseworthy MD, Oeltzschner G, Prisciandaro JJ, Puts NAJ, Roberts TPL, Sack M, Sailasuta N, Saleh MG, Schallmo M, Simard N, Swinnen SP, Tegenthoff M, Truong P, Wang G, Wilkinson ID, Wittsack HJ, Xu H, Yan F, Zhang C, Zipunnikov V, Zöllner HJ, Edden RAE. Big GABA: Edited MR spectroscopy at 24 research sites. Neuroimage. 2017;159:32–45. doi: 10.1016/j.neuroimage.2017.07.021. [DOI] [PMC free article] [PubMed] [Google Scholar]
- Mullins PG, McGonigle DJ, O'Gorman RL, Puts NAJ, Vidyasagar R, Evans CJ, Cardiff Symposium on MRS of GABA. Edden RAE. Current practice in the use of MEGA-PRESS spectroscopy for the detection of GABA. Neuroimage. 2014;86:43–52. doi: 10.1016/j.neuroimage.2012.12.004. [DOI] [PMC free article] [PubMed] [Google Scholar]
- Near J, Andersson J, Maron E, Mekle R, Gruetter R, Cowen P, Jezzard P. Unedited in vivo detection and quantification of γ-aminobutyric acid in the occipital cortex using short-TE MRS at 3 T. NMR Biomed. 2013;26:1353–1362. doi: 10.1002/nbm.2960. [DOI] [PubMed] [Google Scholar]
- Near J, Edden R, Evans CJ, Paquin R, Harris A, Jezzard P. Frequency and phase drift correction of magnetic resonance spectroscopy data by spectral registration in the time domain. Magn Reson Med. 2015;73:44–50. doi: 10.1002/mrm.25094. [DOI] [PMC free article] [PubMed] [Google Scholar]
- Öz G, Alger JR, Barker PB, Bartha R, Bizzi A, Boesch C, Bolan PJ, Brindle KM, Cudalbu C, Dinçer A, Dydak U, Emir UE, Frahm J, González RG, Gruber S, Gruetter R, Gupta RK, Heerschap A, Henning A, Hetherington HP, Howe FA, Hüppi PS, Hurd RE, Kantarci K, Klomp DWJ, Kreis R, Kruiskamp MJ, Leach MO, Lin AP, Luijten PR, Marjańska M, Maudsley AA, Meyerhoff DJ, Mountford CE, Nelson SJ, Pamir MN, Pan JW, Peet AC, Poptani H, Posse S, Pouwels PJW, Ratai EM, Ross BD, Scheenen TWJ, Schuster C, Smith ICP, Soher BJ, Tkáč I, Vigneron DB, Kauppinen RA. Clinical Proton MR Spectroscopy in Central Nervous System Disorders. Radiology. 2014;270:658–679. doi: 10.1148/radiol.13130531. [DOI] [PMC free article] [PubMed] [Google Scholar]
- Puts NAJ, Edden RAE. In vivo magnetic resonance spectroscopy of GABA: A methodological review. Prog Nucl Magn Reson Spectrosc. 2012;60:29–41. doi: 10.1016/j.pnmrs.2011.06.001. [DOI] [PMC free article] [PubMed] [Google Scholar]
- Puts NAJ, Edden RAE, Evans CJ, McGlone F, McGonigle DJ. Regionally Specific Human GABA Concentration Correlates with Tactile Discrimination Thresholds. J Neurosci. 2011;31:16556–16560. doi: 10.1523/JNEUROSCI.4489-11.2011. [DOI] [PMC free article] [PubMed] [Google Scholar]
- Redpath TW. Signal-to-noise ratio in MRI. Br J Radiol. 1998;71:704–707. doi: 10.1259/bjr.71.847.9771379. [DOI] [PubMed] [Google Scholar]
- Simpson R, Devenyi GA, Jezzard P, Hennessy TJ, Near J. Advanced processing and simulation of MRS data using the FID appliance (FID-A)-An open source, MATLAB-based toolkit. Magn Reson Med. 2017;77:23–33. doi: 10.1002/mrm.26091. [DOI] [PubMed] [Google Scholar]
- Sumner P, Edden RAE, Bompas A, Evans CJ, Singh KD. More GABA, less distraction: a neurochemical predictor of motor decision speed. Nat Neurosci. 2010;13:825–827. doi: 10.1038/nn.2559. [DOI] [PubMed] [Google Scholar]
- Sundin T, Vanhamme L, Van Hecke P, Dologlou I, Van Huffel S. Accurate Quantification of 1H Spectra: From Finite Impulse Response Filter Design for Solvent Suppression to Parameter Estimation. J Magn Reson. 1999;139:189–204. doi: 10.1006/jmre.1999.1782. [DOI] [PubMed] [Google Scholar]
- Traficante DD. Time averaging: Does the noise really average toward zero? Concepts Magn Reson. 1991;3:83–87. doi: 10.1002/cmr.1820030203. [DOI] [Google Scholar]


