

Abstract
Escherichia coli is a model organism that has been exploited to reveal key details of hydrogen peroxide stress: the biomolecules that H2O2 most rapidly damages and the defensive tactics that organisms use to fend it off. Much less clear is the amount of exogenous H2O2 that is sufficient to injure the bacterium and/or to trigger its stress response. To fill this gap, we need to study the behavior of cells when they are exposed to defined amounts of H2O2 on an hours-long time scale. Such experiments are difficult because bacteria rapidly consume H2O2 that is added to test cultures. Further, lab media itself can generate H2O2, and media components interfere with the quantification of H2O2 levels. In this study we describe mechanisms by which media components interfere with H2O2 determinations, and we identify simple ways to minimize and correct for this interference. Using these techniques, it was shown that standard media generate so much H2O2 that most intracellular H2O2 derives from the medium rather than from endogenous metabolism. Indeed, bacteria spread on plates must induce their stress response or else perish. Finally, two straightforward methods were used to sustain low-micromolar steady-state concentrations of H2O2. In this way we determined that > 2 μM extracellular H2O2 is sufficient to trigger the intracellular OxyR stress response, and > 5 μM begins to impair cell growth in a minimal medium. These concentrations are orders of magnitude lower than the doses that have typically been used in lab experiments. The new approaches should enable workers to study how various organisms cope with natural levels of H2O2 stress.
Keywords: oxidative stress, hydrogen peroxide, horseradish peroxidase, OxyR, Amplex Red
Graphical abstract

Introduction
In 1900 Oscar Loew reported that tobacco exudates contain a protein that degrades hydrogen peroxide (H2O2) [1]. Since it was among the first proteins shown to catalyze a chemical reaction, he named it catalase. It subsequently became clear that catalases and partner enzymes, peroxidases, are virtually universal among organisms of all types. He inferred that somehow cells must confront hydrogen peroxide, but the circumstances remained mysterious.
Studies of the model bacteria Escherichia coli and Salmonella typhimurium determined that their catalase and primary peroxidase are strongly induced when H2O2 is added to the culture medium [2-4]. Cell membranes are semi-permeable to H2O2, and so it diffuses into the cell, where it oxidizes the sensory cysteine residue of the OxyR transcription factor [5]. The resultant sulfenate residue condenses with a second cysteine, creating a disulfide bond that locks the OxyR into an active conformation. It binds upstream of genes that encode key defensive proteins and activates their transcription. The products include not only the KatG catalase and AhpCF peroxidase but also the miniferritin Dps, the manganese importer MntH, the SufABCDE iron-sulfur assembly machinery, and others [6]. The iron-based PerR transcription factor controls a similar response in Bacillus subtilis, while Yap1 is the key regulator in yeasts [7, 8]. These systems are wide-spread, leading to a view that H2O2 is a common stress in oxic environments.
Although some H2O2 is formed endogenously by the autoxidation of redox enzymes, the amount is not sufficient to activate OxyR [9, 10]. Therefore, the existence of these regulons implies that bacteria occasionally encounter threatening doses of H2O2 in their environment. There are several plausible sources of this H2O2. It is likely formed when oxygen oxidizes reduced sulfur and transition-metal species at oxic/anoxic interfaces [11]. It is also generated at a rapid pace by lactic acid bacteria, which excrete H2O2 as a stoichiometric product of their aerobic carbohydrate catabolism [12, 13]. And both plants and animals wield NADPH oxidase as a weapon that suppresses the growth of invading microbes by dowsing them with H2O2 and [14, 15].
To understand which habitats can poison bacteria, we need to know how much H2O2 is needed to compromise their fitness. Unfortunately, the experiment is not easy: when sub-millimolar H2O2 is added to standard laboratory cultures, the collective scavenging activity of the cells clears it from the medium in minutes—too quickly for its impact upon growth to be discerned [10]. Millimolar concentrations certainly block growth and even kill cells, but it is unlikely that such amounts are found in natural environments. Nevertheless, we and others have frequently resorted to such high doses in order to study aspects of stress. Such experiments can be misleading because excess H2O2 may create crippling injuries that would be scant at natural doses.
One alternative approach has been to use the enzyme glucose oxidase to continuously generate lower levels of H2O2 in culture media [16-18]. Balanced against cellular scavenging activities, glucose oxidase can establish a constant steady-state level of H2O2. That level is likely to decline steadily, however, as increases in cell density tip the balance towards H2O2 decomposition and as excreted proteases inactivate the enzyme. Workers have not usually tracked the H2O2 level in the presence of live cells to evaluate the impact of these issues.
To circumvent such problems, scavenger-deficient mutants have been generated through the disruption of catalase and peroxidase genes. Such mutants are exceptionally sensitive to growth inhibition by H2O2. The E. coli mutants grow at normal rates in anoxic media, but upon aeration the cultures accumulate several micromolar intracellular H2O2—which is enough to block growth. The H2O2 does so by inactivating enzymes that use solvent-exposed iron-sulfur clusters or mononuclear Fe(II) as catalytic cofactors [19-22]. The H2O2 oxidizes the iron, and ferric iron dissociates from the active site, thereby inactivating the enzymes and blocking the processes to which they contribute. The affected pathways include the biosynthesis of branched-chain and aromatic amino acids, the TCA cycle, and the pentose-phosphate pathway. Several of the OxyR-induced proteins help to moderate these effects [23].
How much H2O2 is sufficient to impair the growth of wild-type cells? Because the membrane constitutes a significant permeability barrier, and the intracellular titers of scavenging enzymes are remarkably high, the external and internal concentrations of H2O2 can differ substantially [24]. Calculations suggest that when E. coli is exposed to external H2O2, the intracellular concentration of H2O2 will be at least five-fold lower, and the gradient will become even steeper as scavenging enzymes are induced [10].
To resolve this question, and more generally to study cells in the context of physiological stress, it is necessary to design experiments in which external H2O2 concentrations can be controlled for the hours needed to quantify growth defects. Three technical problems have confounded efforts to do so. First, medium components interfere with the most sensitive assays of H2O2, making it difficult to track the extracellular levels. Second, media also can produce H2O2 through chemical [25-27] and photochemical [28-31] processes. These effects can interfere with efforts to poise extracellular H2O2 at very low levels. Finally, to compensate for the robust scavenging actions of cultures, H2O2 must be continuously regenerated in the medium. In this study we describe simple ways to cope with these problems. We then use these methods to determine that low-micromolar external H2O2 is sufficient to activate the OxyR system, and slightly higher concentrations can substantially inhibit growth. The implication is that these doses occur in natural habitats and comprise the stress against which cells must defend themselves.
Materials and Methods
Reagents
Casamino acids (Hy-Case Amino), type 2 horseradish peroxidase, 30% hydrogen peroxide, diethylenetriaminepentaacetic acid (DTPA), ascorbic acid, dithiothreitol, bovine liver catalase, riboflavin, 5,5′-dithiobis(2-nitrobenzoic acid) (DTNB), and 2-nitrophenyl B-D-galactopyranoside (ONPG) were from Sigma-Aldrich. Tryptone (a pancreatic digest of casein) was purchased from Becton, Dickinson & Co.; Amplex UltraRed, from Invitrogen; and phenol, from Ambion.
Bacterial strains and growth media
LB medium contained (per liter) 10 g bactotryptone, 5 g yeast extract, and 10 g NaCl [32]. Minimal A defined medium contained (per liter) 10.5 g dibasic potassium phosphate, 4.5 g monobasic potassium phosphate, 1 g ammonium sulfate, 0.5 g sodium citrate dihydrate, and 0.8 mM magnesium sulfate heptahydrate, adjusted to pH 7 [32]. Unless otherwise indicated, 0.2% glucose was provided as a carbon source. Cultures were grown with vigorous shaking at 37 °C. Growth was tracked either at the conventional 600 nm or, in very dilute cultures, at 420 nm. At the latter wavelength the absorbance of a culture is twice that at 600 nm.
Phenomena were verified with two wild-type K-12 strains: MG1655 and its ΔoxyR::spec derivative AL342, and GC4468 and its ΔoxyR::spec derivative AS430. Induction of the katG gene was monitored in AL441, which is an MG1655 derivative carrying Δ(lacZ1::cat)1 attλ::[pSJ501::katG’-lacZ+]~cat. The ΔoxyR::spec allele was obtained from a strain provided by Gisela Storz. The katG-lacZ fusions were derived from other strains previously constructed in the lab [33]. These alleles were transferred by standard P1 transduction [32] and confirmed by PCR analysis.
Measurements of H2O2
The H2O2 assays can be adjusted, but the following protocol represents the method that was derived to work with samples that might include inhibitory substances. Notably, the sample was diluted 1:10 into the assay reaction to lessen any interference arising from inhibitors in the sample. Reactions (2 ml) contained 50 mM dibasic potassium phosphate/1 mM DTPA, adjusted to pH 7.8; plus (in order) 0.2 ml sample, 50 μl of 0.25 mM Amplex UltraRed (AR), and 100 μl 0.25 mg/ml horseradish peroxidase (Sigma P8250). Reactions were rapid, and final fluorescence was measured after 20 sec. Lesser amounts of HRP would also be sufficient, although the reaction time may need to be extended. The presence of DTPA prevents iron-dependent H2O2 degradation or thiol oxidation, but in most sample types its inclusion was unnecessary. The fluorometer (Shimadzu model RF-Mini150) used 520 nm excitation and 620 nm emission filters. The peroxidase was prepared for each use as a 0.25 mg/ml stock solution in 50 mM KPi. The AR solution was prepared by dissolving 1 mg in 1 ml DMSO, which was then diluted to a final volume of 16 ml of 50 mM KPi, pH 7.8, to obtain a 0.25 mM solution that was stored at −20 °C. The frozen solution was stable for months. During experiments the thawed stock AR solution was held on ice in a foil-wrapped tube to prevent photochemical oxidation.
When the H2O2 samples involved a simple buffer, this assay could easily detect 0.25 μM H2O2 in the 0.2 ml sample. As discussed in the text, sensitivity was diminished if the samples contained components that suppressed the oxidation of the AR. In general, even if components diminished the signal (see discussion of tyrosine, ascorbate, and DTT), the signal remained proportionate to the concentration of H2O2. Therefore, the response could be corrected by standard additions. Typically, an aliquot of sample was used in the HRP reaction. To a second reaction with sample was added a known amount of H2O2 (e.g., 100 μl 10 μM), prior to the addition of AR and HRP, and the difference in fluorescence was used to calibrate the assay.
Other chemical reactions
The oxidation of phenol by HRP/H2O2 was monitored by the appearance of oxidation product at 398 nm in reactions containing 50 μM phenol and 40 μM H2O2. Ascorbate oxidation was tracked by the disappearance of its 267 nm peak, in HRP/H2O2/phenol reactions to which 100 μM ascorbate was included. The oxidation of cysteine and dithiothreitol was determined by measurements of their thiol group, by mixing 990 μl sample plus 10 μl 25 mM DTNB. Absorbance was determined at 412 nm and correlated with standards analyzed in the same sample liquid. The reactivity of thiols with H2O2 was determined in 50 mM KPi adjusted to various pH values; H2O2 levels were measured at time points using the HRP/AR assay, and the dependence of the reaction upon thiolate content was calculated using pKa of DTT = 9.2.
Quantifying H2O2 in lab media
Media were freshly prepared and autoclaved prior to the initiation of H2O2 measurements. Independent experiments showed that autoclaving destroys contaminating or spiked H2O2 in LB. Levels of H2O2 were subsequently tracked using the HRP/AR method described above. The impact of oxygen upon H2O2 production was determined by placing parallel samples on a benchtop and in a Coy anaerobic chamber under 5% H2/90% N2/5% CO2.
To test the abilities of wild-type cells (MG1655) and ΔoxyR mutants (AL342) to form colonies on plates, bacteria were first cultured into exponential phase in anoxic minimal A glucose medium containing 0.5 mM (each) Pro, His, Leu, Arg, and Thr. Both glucose and LB plates had been poured 18 hours previously and solidified either on the lab bench top or in the anaerobic chamber. Where indicated, oxic plates were also top-spread with 70 μl of a catalase solution (ca. 100 U; Sigma bovine liver catalase, C3155) after filter sterilization through a 0.45 μm syringe filter. Bacteria were then streaked onto plates, which were photographed the next day.
The imposition of constant micromolar H2O2 stress upon bacterial cultures
Two approaches were developed to expose wild-type (scavenger-proficient) cells to a steady concentration of H2O2: constant production by irradiated lumichrome, and repeated additions of H2O2 to dilute bacterial cultures.
Lumichrome can be purchased (Sigma-Aldrich), but for these experiments it was prepared by irradiation of riboflavin [34]. Riboflavin (0.9 mg/ml) was dissolved in 10 ml H2O with 1 drop of 3 M KOH. The solution was then irradiated for 3 hrs by a standard visible light bulb (Sylvania Ultra LED, 1600 lumens) from 5 in, until the 446 nm riboflavin peak [35] had been reduced by 95%. For growth studies, bacteria were grown at least 5 generations in log phase (< 0.2 OD600) and then diluted to 0.020 OD600 in 15 ml glucose medium containing 0.5 mM Trp. The medium was freshly prepared, to avoid pre-existing H2O2 that might otherwise be formed by glucose oxidation. Various concentrations of lumichrome were added. The cultures were irradiated by the same bulb, which was suspended in a reflective painter’s lamp housing 8 inches above the platform of a 37 °C shaking water bath. Cell growth was tracked by absorbance at 600 nm. In this arrangement, the role of Trp is to serve as an electron donor to photoexcited lumichrome, which then transfers the electrons to oxygen. To some samples sterile catalase was added to a final activity of 15 U/ml. At intervals, aliquots were filtered to remove bacteria, and the filtrate was frozen on dry ice and stored at −80 °C. Later, these aliquots were thawed, and their H2O2 content was measured. Control experiments confirmed that H2O2 levels did not change during freeze/thaw and storage. Note that the steady-state concentration of H2O2 in the medium represents the balance between its production by lumichrome and its degradation by cells; therefore, at higher cell densities more lumichrome or fluence is needed to establish a given H2O2 concentration.
In an alternative protocol, H2O2 concentrations in very dilute cultures could be established and maintained by periodic sampling and resupplying. Exponentially growing bacteria in fresh minimal A glucose medium were diluted to a density of 0.0025-0.005 OD600 (0.005-0.010 OD420), and H2O2 was added to a target concentration. Every 5-10 min samples were withdrawn, the H2O2 level was measured, and the drop in H2O2 from the target level was compensated by addition of more H2O2. At the same time, growth was tracked by absorbance at 420 nm. The frequency of H2O2 measurement and adjustment was enough to constrain the H2O2 range within 10-15% of a mean value. Because a minimal glucose medium was used, H2O2 was able to impair growth by impeding amino acid synthesis.
The preceding arrangement was also employed to identify the extracellular H2O2 doses that induce the OxyR regulon. Strain AL441 was derived from wild-type strain MG1655, but it additionally has a chromosomal lacZ deletion and a katG-lacZ transcriptional fusion inserted at the lambda attachment site. Thus the native katG locus remains intact and functional. Log-phase cultures in minimal glucose medium were diluted to 0.0025 OD600, and 60 ml cultures were rigorously shaken in 250 ml flasks. Selected amounts of H2O2 were added, and the H2O2 was frequently measured and supplemented as described above. Cell growth was simultaneously monitored at 420 nm. After 2 hours, 300 U catalase were added to each culture. Forty ml of culture was removed, and SJ130 (as MG1655 plus ΔlacZ) was added to 0.1 OD600 as carrier bacteria to enable effective centrifugation of the low-density AL441 cells. Cells were washed, suspended in 1 ml cold 50 mM Tris, pH 8, and lysed by French press. Debris was removed by 20 min centrifugation at 20,000 × g, and the extracts were assayed for β-galactosidase activity and total protein. The β-galactosidase activity was normalized to OD420 of the AL441 samples, after minor correction for slight variations in the efficiency of cell lysis (as represented by total protein recovered, primarily representing the added SJ130 cells). Catalase (15 U/ml) was added to a control culture at time zero to ensure the absence of H2O2 in the medium. The β-galactosidase activity (U/OD420) of the catalase-treated culture was set to a normative value of 1, and the rate of β-galactosidase synthesis during the two-hour H2O2 exposure was specifically determined by subtracting out the starting β-galactosidase activity and OD420 of the cultures.
Results
Tyrosine interferes with H2O2 detection in laboratory media
Horseradish peroxidase (HRP) is widely used in conjunction with chromatic and fluorescent substrates to detect low concentrations of H2O2. An especially popular substrate is Amplex UltraRed (AR), which is oxidized to its fluorescent form by the compound I and compound II redox states of the enzyme (Fig. 1). However, the utility of this system is diminished in complex media, in which the signal can be erratic and much diminished. As a first step to address this problem, we noted that tryptone, a common component of complex media, suppresses the signal when HRP/AR are used to quantify H2O2 (Fig. 2A). Tryptone is prepared through tryptic digestion of casein protein, and the suppressive effect was reproduced by casamino acids, an acid hydrolysate of casein (Fig. 2B). A mixture of purified amino acids also replicated the effect, indicating that the active factor(s) were amino acids per se, rather than the peptides and contaminants that are also present in tryptone and casamino acids.
Figure 1. The catalytic cycle of horseradish peroxidase, showing points of interference by medium components.
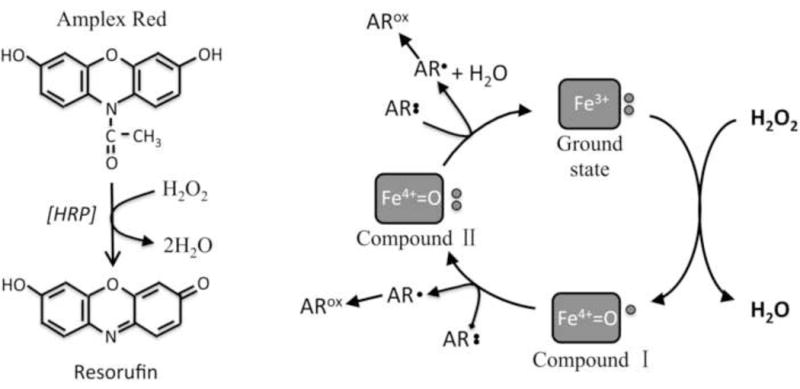
(A) The oxidation of Amplex UltraRed (AR) by horseradish peroxidase provides an assay of H2O2. Amplex UltraRed, used in this study, is a derivative whose proprietary formula has not been released by the manufacturer. (B) The oxidation of HRP by H2O2 [68] converts its heme cofactor to compound I, containing both a ferryl species and a porphyrin radical. Compound I can be univalently reduced by dyes such as AR to a ferryl species with a reduced porphyrin (compound II). An AR radical is formed. A second reduction event returns the porphyrin to its fully reduced form. Either a second oxidation event or disproportionation of AR radicals (not shown) produces a fully oxidized fluorescent product. This study shows that tyrosine and phenol can compete with AR for compounds I and II, while ascorbate and unidentified components in rich media can reduce the AR radicals back to their reduced forms.
Figure 2. Tyrosine interferes with H2O2 detection.

(A) HRP/AR reactions contained 0.5 μM H2O2 plus the indicated concentrations of tryptone. Standard LB medium contains 1% tryptone. Circle: Signal with 1% casamino acids. HRP was the final addition to the assay reaction. FU: arbitrary fluorescence units. (B) Signal with various media components in the HRP reaction. AR was added last to the reaction. Tryptone and casamino acids were each 0.05%. (C) Interference by tyrosine was greatest when AR was added last. The notations below each bar represent the order of addition to the HRP reaction. Solid bars: no tyrosine; hatched bars: 0.16 mM tyrosine. (D) H2O2, HRP, and tyrosine were coincubated for the indicated times, and AR was then added to quantify the residual H2O2. In these and subsequent experiments, error bars represent SEM from triplicate reactions. Bars are often obscured by the markers.
Subsequent add-in and drop-out experiments showed that tyrosine was necessary and sufficient to cause the effect (Fig. 2B). We found that signal suppression depended upon the order in which HRP and AR were added to the H2O2-detection reaction (Fig. 2C), with greatest suppression occurring if the addition of AR occurred last. This observation implied that tyrosine might act as an electron donor for HRP, thereby driving the degradation of substantial H2O2 before the fluorescent substrate was added. Fig. 2D verifies that H2O2 disappears when HRP and tyrosine are co-incubated with it.
Tyrosine and AR are both phenolic compounds, and compounds I and II are able to oxidize a variety of phenols [36, 37]. Phenol itself is an excellent substrate for HRP (Fig. 3A). The data indicate that tyrosine is a competitive inhibitor of AR oxidation, and indeed the extent of AR oxidation depended on the relative concentrations of AR and tyrosine in the HRP reaction (Fig. 3B). Therefore, the sensitivity of the HRP/AR detection system is maximized if the tyrosine concentration in the reaction is minimized, if HRP is added last, and if AR levels are high. Importantly, the data also demonstrate that H2O2 measurements should be accompanied by standard curves that are executed in the same mixture as the actual samples.
Figure 3. Phenolic compounds compete with AR for HRP.

(A) Time course of H2O2 scavenging by HRP/phenol (0.4 μM). Reactions contained 0.5 μM H2O2 (B) Suppression of AR signal by tyrosine depends on the relative concentrations of tyrosine and AR. H2O2 was 50 nM.
Other compounds interfere by reducing the AR radical
Further work revealed examples of other sources of inhibition. Ascorbic acid inhibited the fluorescent signal to a limit of approximately 75% (Fig. 4A). This effect was unaffected by the AR concentration (Fig. 4B), indicating that ascorbate does not compete with AR for the compound I and II forms of HRP. Ascorbate similarly inhibits the oxidation of phenol (Fig. 4C). A by-product of this inhibition is the oxidation of ascorbate (an effect that is obscured by the spectrum of AR) (Fig. 4C). These data indicate that ascorbate reduces the phenolic radicals that are the initial products of phenols with oxidized HRP. The inability of ascorbate to completely eliminate AR oxidation suggests that some AR molecules are divalently oxidized before they escape the HRP active site into the bulk solution. In any case, the residual ascorbate-resistant AR oxidation still presents a linear response to H2O2, indicating that H2O2 can be accurately quantified as long as standard-addition protocols are performed to correct for the suppressive effect.
Figure 4. Ascorbate blocks AR oxidation by reducing the AR radical.
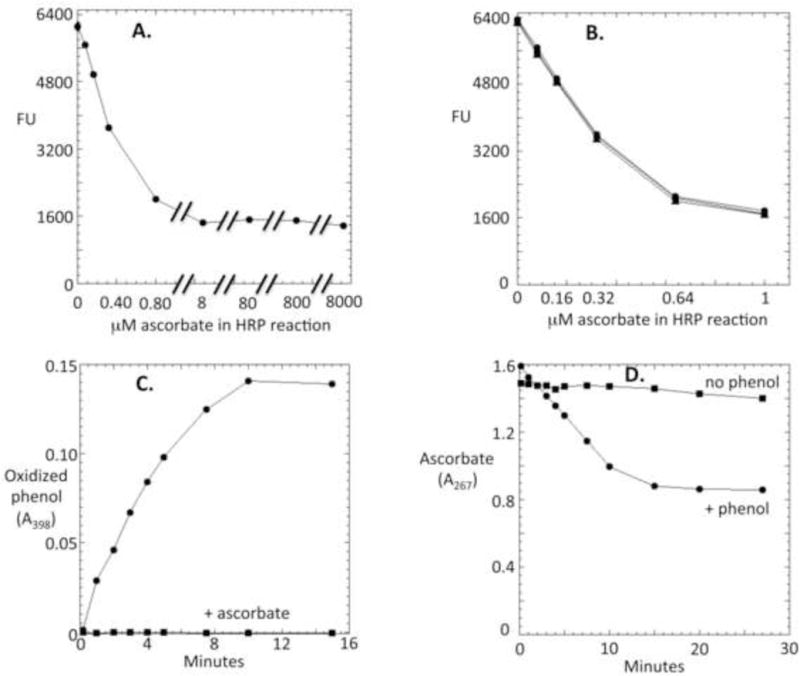
(A) HRP/AR reactions contained 0.5 μM H2O2 plus the indicated concentrations of ascorbate. (B) Ascorbate was equally effective at blocking the oxidation of 3.13 (triangles), 6.25 (squares), and 12.5 μM AR (circles), indicating that ascorbate does not act by competing with AR as an HRP substate. (C) Ascorbate blocked the accumulation of phenol oxidation product. The phenol oxidation product was monitored at 398 nm. Reactions were run to completion and contained HRP, 50 μM phenol, 40 μM H2O2, and (where indicated) 100 μM ascorbate. (D) The HRP/H2O2 reaction oxidized ascorbate only when phenol was provided as an HRP substrate, indicating that ascorbate reduces the phenol radical. Ascorbate disappearance was monitored at 267 nm. Reactions (run to completion) contained HRP, 40 μM H2O2, 100 μM ascorbate and (where indicated) 50 μM phenol.
This action of ascorbate mimics its reduction of radicals of acetaminophen, another phenolic substrate of HRP [38]. In contrast, although NADH reduced HRP-oxidized guaiacol and scopoletin radicals, thereby disrupting H2O2 detection and initiating free-radical chains [39], NAD(P)H did not interfere with HRP/H2O2-mediated oxidation of AR (data not shown).
In many media, thiol species such as cysteine or dithiothreitol (DTT) are among the most prevalent redox compounds. In principle they raise the prospect of interference in several ways: by inhibiting the HRP system in the fashion of tyrosine or ascorbate, by directly scavenging H2O2 before the measurement can be performed, or conversely by autoxidizing in aerobic holding conditions and thereby artificially raising the level of H2O2 that is reported. These possibilities were addressed in turn. Moderate amounts of DTT inhibit full AR oxidation in the same fashion as ascorbate (Fig. 5A), but even when the HRP reaction is conducted with substantial DTT in the mix, good standard curves can be obtained (Fig. 5B). DTT was a poor scavenger of H2O2 even at room temperature: at neutral pH the halftime for H2O2 depletion by 100 μM DTT was 3 hours (Fig. 5C). The rate accelerated at higher pH, allowing us to calculate (Materials & Methods) a rate constant per thiolate anion of 15 M−1 s−1. This rate is in excellent agreement with similar calculations for cysteine (20 M−1 s−1; [40]). N-acetylcysteine is commonly added as to biological systems as a presumptive antioxidant, because it has some capacity to directly scavenge H2O2. However, its reaction with H2O2 was even slower than that of DTT (using NAC pKa = 9.52, kthiolate = 6.7 M−1 s−1); thus at 1 mM N-acetylcysteine, the half-time for H2O2 decomposition would be 10 hrs. Note that because Fenton chemistry might degrade H2O2 in iron-rich samples, we stabilized all samples prior to assay by including EDTA or DTPA.
Figure 5. Thiol species interfere with H2O2 detection, but adjustments can correct for the problem.
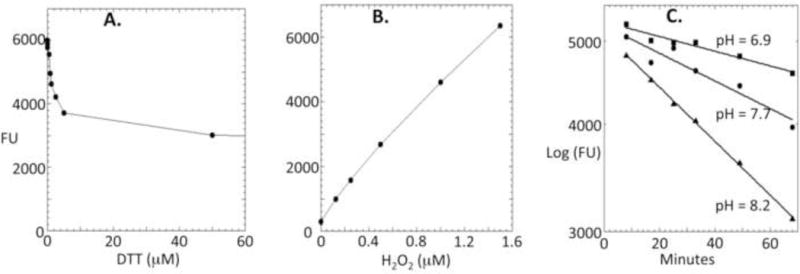
(A) Dithiothreitol suppresses half the fluorescence otherwise produced in an HRP/AR/H2O2 reaction containing 0.5 μM H2O2. (B) Even at high levels of dithiothreitol (here, 100 μM), standard curves permit H2O2 quantification. (C) Thiol species only slowly scavenge H2O2. Dithiothreitol (50 μM) and 50 μM H2O2 were coincubated in RT KPi/DTPA buffer at the indicated pH values, and H2O2 was periodically quantified. Data indicate a rate constant for H2O2 reduction by the DTT thiolate anion of 15 M−1 s−1, which equates to an H2O2 half-life of 3 hours in 100 μM DTT.
The opposing concern—that thiols might artifactually generate H2O2 by autoxidation—proved unfounded. The rate of DTT autoxidation (7 nM/min in a solution of 100 μM DTT) was quite low in the presence of chelators. Cysteine is particularly prone to iron-catalyzed oxidation, but it too is highly stable when chelators are present (0.5% oxidized in 70 min). Thus if samples are stored on ice with chelators prior to assay, thiol redox chemistry has little effect upon H2O2 assays.
In sum, the HRP/AR system can precisely determine micromolar and even sub-micromolar concentrations of H2O2 in complex media mixtures, if the experimenter takes simple steps to detect and correct for the impact of solutes upon the reaction system. Our favored protocol is detailed in the Materials & Methods.
Assays reveal toxic levels of H2O2 in lab media
Bacteria often exhibit reduced fitness when they are plated on oxic rather than anoxic media. This observation pertains to mutant strains that lack oxidative defenses [41-45], and also to natural isolates of select bacteria [46-50]. These growth defects are often ascribed to metabolic processes that generate superoxide and H2O2, and such data are cited as evidence that endogenous oxidants take a toll even on aerobic and facultative microbes. However, an alternative is that chemical processes generate ROS in the media, and the resultant H2O2 penetrates the cell. Calculations show that if the extracellular level of H2O2 were to exceed 0.2 μM, then the rate of H2O2 influx into E. coli would exceed the rate of its intracellular formation [10].
Using the assay refined above, the concentration of H2O2 was tracked in freshly prepared glucose media. Fig. 6A shows that the H2O2 content of media containing the standard level of glucose (0.2%) surpassed 0.2 μM within 90 min of preparation. The recognized ability of metals to catalyze glucose oxidation [51] was apparently responsible for the majority of this H2O2, as the H2O2 was formed in proportion to glucose concentration and was suppressed when chelators were added. Peroxide production was also suppressed when glucose was replaced by gluconate, a hexose that lacks the reducing moiety. When media were stored at RT on a lab bench, levels rose to ~ 5 μM within one week (Fig. 6B). Casamino acid media (lacking carbohydrate) exhibited similar behavior, although we did not solve the underlying mechanism. MOPS, Tris, and M9 glucose media are alternative formulations that are commonly used by microbiologists; their rates of H2O2 accumulation varied modestly, perhaps reflecting differences in metal content or speciation.
Figure 6. H2O2 accumulates rapidly in sterile media.

(A) Minimal A medium contained the indicated concentrations of glucose or gluconate. Where indicated, 1 mM DTPA or 0.2% casamino acids (CAA) was included in medium containing 0.2% glucose. Dashed line indicates 0.2 μM H2O2, the value at which H2O2 influx into E. coli outstrips endogenous H2O2 formation. When H2O2 concentrations in the medium exceed this value, most of the stress experienced by cells derives from the medium. This experiment is representative. (B) Sterile minimal A media were held at RT (or, where indicated, 37 °C), and H2O2 levels were periodically determined. Where indicated, media contained 0.2% glucose, 0.2% casamino acids, and 1 or 4 mM DTPA. The dashed line represents 0.2 μM H2O2. (C) Photochemical generation of H2O2 in LB medium under standard room lighting. Freshly prepared LB contained ~ 4 μM H2O2 that was destroyed by autoclaving (auto’d). H2O2 levels were then periodically checked. Media sat on lab bench, in an anaerobic chamber, or in the dark. (D) H2O2 content was determined for LB stocks that had sat on the shelves of 10 lab members for varying times (weeks to months).
LB medium, a complex mixture of tryptone and yeast extract, also accumulates high levels of H2O2. Ezraty et al. determined that some commercial LB preparations contain enough H2O2 to inhibit the growth of H2O2-sensitive mutants [52]. We detected micromolar H2O2 as soon as tryptone and yeast extract were dissolved. Interestingly, this H2O2 was eradicated by autoclaving, and subsequent experiments confirmed that spiked H2O2 was almost fully degraded when it was autoclaved in the presence of medium salts. However, H2O2 was quickly regenerated when the medium sat on the lab bench. Photochemistry was responsible, as others have inferred: H2O2 did not accumulate when the media were either shielded from standard lab lighting or stored in an anaerobic chamber (Fig. 6C). The underlying chemistry is likely to involve the photochemical behavior of riboflavin, a component of yeast extract that gives complex media its yellow color:
hν + riboflavin ➔ riboflavin*
riboflavin* + AH2 ➔ riboflavin− + AH· + H+
where AH2 represents any of many possible reductants. The same chemistry was exploited in the development of superoxide dismutase activity gels [53].
During prolonged storage the level of H2O2 stabilized at a limit that represents a balance between its photochemical generation and undefined degrading processes. Sampling of LB stocks from members of the lab determined that H2O2 ranged between 2 and 11 micromolar (Fig. 6D). The two stored samples of Terrific Broth, which contains higher levels of its complex components, contained 27 and 50 μM H2O2. These concentrations greatly exceed the breakthrough point (0.2 μM) at which the rate of H2O2 entry into the cell exceeds endogenous H2O2 production. In such media internal H2O2 generation does not control cell fate.
The impact of the H2O2 that pervades normal laboratory medium was evidenced by the behavior of E. coli mutants that were spread on either glucose or LB plates. Wild-type cells were able to form typical discrete colonies, but oxyR mutants could not (Fig. 7). The oxyR mutant grew only in the regions where it was most densely plated, presumably because in those regions the collective basal scavenging activity of the tightly clustered cells quickly cleared the local H2O2. The oxyR mutant was able to form normal isolated colonies only when it was streaked on plates that were prepared and incubated in the absence of oxygen, or when catalase was top-spread on the plates prior to the bacteria. External catalase has no effect upon endogenous H2O2, as virtually all H2O2 is degraded before it escapes cells [10]; therefore, the profound growth defect of the oxyR mutant is wholly driven by H2O2 created by the media. It is apparent that whenever E. coli is streaked onto fresh medium, the influx of H2O2 is so great that cells survive only if they can induce their stress response. When such media are used for strains that are inherently sensitive to H2O2, there is a substantial threat that the isolated colonies favored by geneticists (Fig. 7B, circled, middle panel) contain suppressor mutations, and further studies of them can be misleading. This observation also has important implications for the use of lab media in isolating bacteria from natural habitats (Discussion).
Figure 7. The H2O2 content of day-old media requires the activation of cellular stress responses.

(A) Sterile minimal A glucose medium was prepared, and plates were poured. Top images: plates were immediately moved to an anaerobic chamber; middle: plates were left overnight on the bench; and bottom: plates were top-spread with catalase and left overnight on the bench. After 18 hours, either wild-type (MG1655, right) or ΔoxyR (AL342, left) strains were spread and incubated overnight. The failure of ΔoxyR cells to form isolated colonies indicates that isolated cells were overwhelmed by the H2O2 in the medium. (B) The experiment of panel A was repeated with LB medium. Circled colony: On such plates rare isolated colonies are suppressor mutants.
Quantifying the sensitivity of bacteria to H2O2
In the field of oxidative stress, a key issue is the level of oxidant that impairs the fitness of cells. To answer this question, it is desirable to test cell growth in the presence of various concentrations of extracellular H2O2. A simple bolus of H2O2 is inadequate, however, because even dilute suspensions of bacteria degrade the H2O2 within minutes, well before a growth outcome can be measured (Fig. 8). Therefore it is desirable to create a situation that mimics the natural one, in which external H2O2 is continuously generated by environmental processes, while it is simultaneously degraded by bacteria, thereby creating a steady-state extracellular concentration. We have attempted two simple approaches to this problem.
Figure 8. E. coli rapidly scavenges H2O2 added to liquid medium.

(A) H2O2 was added to wild-type cells (GC4468) growing exponentially in minimal A glucose medium, and residual H2O2 was measured at intervals. (B) The half-time of H2O2 degradation was inversely proportional to cell density.
First, we exploited the photochemistry of riboflavin derivatives to allow light-modulated H2O2 formation in liquid cultures (Fig. 9A). The illumination of lumichrome steadily generated H2O2 for at least 4 hours. When wild-type cells were present, this H2O2 created a slight lag after which the cells recovered (Fig. 9B). In contrast, oxyR mutants were unable to grow. Extracellular catalase restored their growth. Measurements showed that in the oxyR culture the extracellular H2O2 concentration had immediately risen to between 3 and 5 micromolar (Fig. 9C), where it persisted for almost three hours. Thus this concentration of external H2O2 evidently imposes enough stress upon E. coli to require protection by the OxyR response. This approach may be useful for screening mutants for H2O2 sensitivity, similar to the use of paraquat or menadione [54] in testing superoxide sensitivity.
Figure 9. Illuminated lumichrome allows protracted exposure of bacterial cultures to micromolar H2O2.

(A) Solid lines: H2O2 generation in sterile medium containing 0.2% casamino acids and the indicated concentrations of lumichrome. The lighting conditions are described in Materials & Methods. Dashed line: 3 μg/ml lumichrome without casamino acids. (B) Wild-type (MG1655, open symbols) and ΔoxyR (AL342, closed symbols) strains were grown in illuminated glucose media containing 0.5 mM Trp. Squares: lumichrome (7.2 μg/ml) was included. Filled diamonds: both lumichrome and catalase were added to the ΔoxyR strain. (C) Cultures of the ΔoxyR strain AS430 containing lumichrome were illuminated during the indicated period. Solid lines: OD600. Squares: catalase (15 U/ml) was included in the culture medium; circles: no catalase was added. Open circles/dashed line: H2O2 levels of the catalase-free culture were measured during the period of illumination (right axis).
One difficulty with the lumichrome system is that as cells grow, their collective scavenging activity will increase and the extracellular steady-state H2O2 will fall. To study outgrowth in the face of constant H2O2, we took another approach. Wild-type cells in exponential phase were diluted to low density into medium that had been freshly prepared so that it contained no pre-existing H2O2. Hydrogen peroxide was then added and periodically measured and replenished. Figure 10A shows that even at these low densities—about 100-fold below many studies’ log-phase cultures—the clearance of H2O2 requires frequent correction. Still, the H2O2 levels can be sustained within 15% of a target value for long periods of time. In order to gain a factor of two in sensitivity, biomass was tracked at 420 rather than 600 nm. Fig. 10B shows that 7 micromolar external H2O2 was sufficient to briefly impair growth. Induction of OxyR then allowed the wild-type cells to recover; an oxyR mutant could not (Fig. 10C). Interestingly, induction of OxyR did not quite restore the growth rate to that of unstressed cells, either because of the residual stress or because of the metabolic compromises that the OxyR response involves. Similar trials with wild-type cells at other H2O2 concentrations resulted in a detectable but short lag at 5 micromolar H2O2 and no apparent lag at lower concentrations (Fig. 10D).
Figure 10. The OxyR trigger point can be determined by imposition of micromolar H2O2 stress at low cell densities.

Cells were grown in minimal glucose medium, and H2O2 was added and maintained by repeated measurement and supplementation. (A) Track of H2O2 level in cultures of a wild-type strain (GC4468). Declines represent H2O2 degradation by bacteria; additions were periodically made to restore 8 μM. Dashed line: mean H2O2 level was 7 μM. (B) Growth of the wild-type strain in the same culture. Biomass was tracked at 420 nm to improve sensitivity. Note that the cells initially could not tolerate the H2O2, but they adapted and ultimately were able to grow despite the sustained presence of 7 μM H2O2. The final doubling time (94 min) remained higher than that of unstressed cells (63 min). (C) Growth of wild-type (MG1655) and ΔoxyR (AL342) strains in 8 μM constant H2O2. (D) Growth delays are triggered by constant extracellular H2O2 concentrations in excess of 5 μM. The wild-type strain was GC4468.
These data define 5 micromolar as the threshold at which extracellular H2O2 slows the growth of wild-type E. coli. We also used a katG-lacZ fusion to find the minimal dose that initiates the OxyR response. The katG gene, like most members of the regulon, has a significant basal expression that is elevated when OxyR is activated [3, 4, 55]. Figure 11 shows that extracellular H2O2 concentrations below 2 micromolar failed to induce katG, but higher concentrations caused induction. This trigger point makes sense in the context of growth defects that appear at > 5 micromolar. Together, these data indicate that low-micromolar extracellular H2O2 is enough to be hazardous for E. coli.
Figure 11. Induction of the OxyR stress response requires extracellular H2O2 in excess of 2.
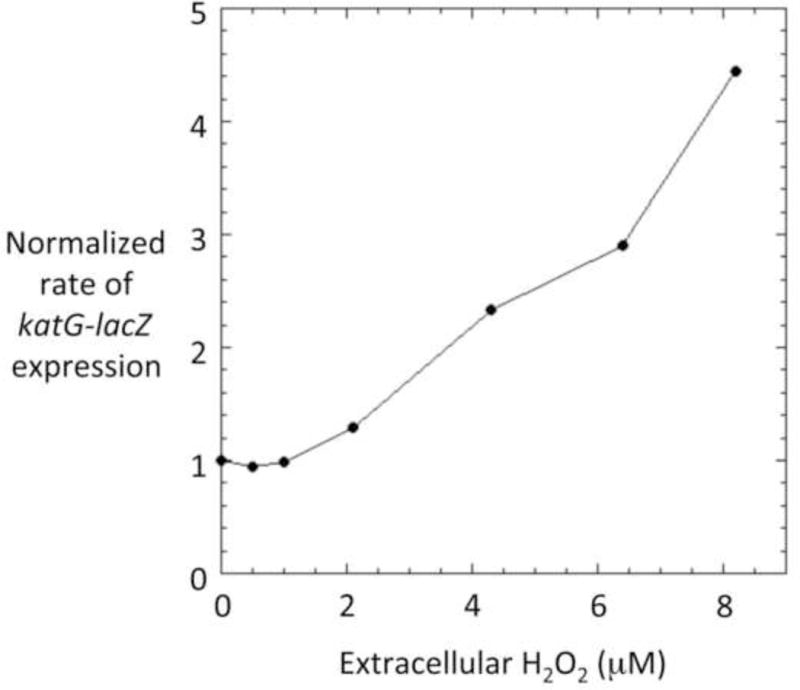
μM. Rate of katG-lacZ expression in cultures containing the indicated levels of H2O2. Scavenger-proficient cells (AL441) containing an additional katG-lacZ fusion were grown for 2 hours in glucose medium containing the constant indicated levels of H2O2. Cultures were harvested as described in Materials & Methods, and rates of B-galactosidase synthesis were determined. Note: the zero-H2O2 culture contained catalase.
Discussion
One goal of this work was to identify, explain, and solve some of the difficulties associated with measuring H2O2 in laboratory media. We found that the tendency of tyrosine to competitively inhibit AR oxidation could be managed by a few simple adjustments: fixing the order in which reactants are added to the HRP reaction, employing sufficient AR, and correcting for any residual effects through the methods of standard additions. Those remedies are enough to enable precise H2O2 measurements in most defined media. Complex media may include additional compounds that, like thiols and ascorbate, can interfere by reducing AR radical intermediates; but these difficulties are minor if the HRP reaction contains moderate amounts of media and, again, if standard additions are used to correct for residual suppressive effects.
Natural H2O2 doses are probably in the low-micromolar range
With a reliable assay in hand, our larger purpose was to appraise the sensitivity of bacterial growth to constant amounts of extracellular H2O2. We find that the model bacterium E. coli begins to suffer when environmental levels rise to ca. 5 μM, and activation of the OxyR response is needed if growth is to continue. Because the semi-permeable membrane poses a diffusion barrier, the intracellular H2O2 concentration has been estimated to be approximately 10-fold lower. This suggests that as little as 0.5 μM H2O2 is sufficient to impair growth—and indeed doses of this magnitude have been shown to poison iron enzymes inside scavenger-deficient cells, a condition under which intracellular and extracellular concentration equilibrate [19-22]. In vitro studies confirm that the innate sensitivity of OxyR is sufficient to respond to sub-micromolar H2O2 [9]. Aussel et al. detected brief induction of ahpCF when low micromolar H2O2 was added to cultures of Salmonella typhimurium [56], and Helmann et al. used a similar dose to derepress the PerR regulon of Bacillus subtilis [57]. Thus the response threshold we have determined for wild-type E. coli falls in line with observations from other bacteria. When one discusses H2O2 stress, low-micromolar concentrations are the ones that should be considered.
This threshold for bacteriostasis lies 1000-fold below the millimolar concentrations that are often used to appraise the H2O2 sensitivity of various microbes and mutants. In typical experiments, cells are exposed relatively briefly to a large bolus of H2O2, and the impact upon viability is assessed after 10-60 minutes by diluting and plating the cells. This protocol can be useful, particularly in evaluating the ability of cells to repair DNA lesions that are potentially lethal [58, 59], but it does not recapitulate the exposures that cells are likely to experience in natural habitats, and it cannot detect outcomes that arise from enzyme damage. A common alternative approach is to track cell outgrowth in either liquid or plate media to which millimolar H2O2 has been added. In this situation growth cannot resume until the level of H2O2 is driven to sub-micromolar levels, and so the outcome is primarily determined by the pace at which the studied cells can degrade millimolar H2O2. Other adaptations to the stress, which are important in improving fitness in the face of constant micromolar doses, do not improve outcome in the face of these high concentrations.
Strikingly, there are several hints that when bacteria encounter H2O2 in natural systems, the H2O2 is at low-micromolar concentrations. Most famously, the cell-based immune system dowses phagocytosed bacteria with and H2O2 that are generated by the NADPH oxidase. Superoxide cannot cross membranes, so H2O2 may constitute the major penetrating oxidant. Although H2O2 is produced at a high pace, its rapid efflux through the phagosome membrane is estimated to keep the steady-state phagosomal H2O2 in the 1-5 μM range [60]. An analogous calculation for neutrophils suggested that no more than 5 μM would accumulate [61]. (We note, however, that the local H2O2 concentration might rise higher if H2O2 cannot clear the macroscopic region of tissue, as in an abcess.)
Most bacteria, including E. coli, have not evolved to survive phagocytosis, and so we must look elsewhere to understand why they elaborate defenses against exogenous H2O2. One clue comes from the fact that E. coli regulates a periplasmic cytochrome c peroxidase in a fashion that ensures that OxyR can induce it only when oxygen is absent [62]. The physiological role of the enzyme may be to exploit H2O2 as an alternative respiratory electron acceptor [11]. The apparent KM of this H2O2-dependent respiration is ~ 5 μM, which gratifyingly is also a dose that effectively activates OxyR. The conundrum is this: the formation of oxygen species like H2O2 seems intuitively more likely when oxygen levels are high, not low. In what hypoxic environment might bacteria encounter H2O2? An attractive notion is that H2O2 might be formed in substantial quantities at interfaces between oxic and anoxic fluids. Reduced sulfur and metal species leaching out of reduced microenvironments are likely to be chemically oxidized when they encounter oxygen. Further, lactic acid bacteria that inhabit such interfaces generate H2O2 as a stoichiometric product of metabolism, and obligate anaerobes do so through adventitious enzyme oxidation [12, 13, 63, 64]. The H2O2 that is generated in these ways would then diffuse into both the oxic and anoxic fluids, stressing any bacteria that reside there. Such interfaces exist at the epithelial margins of the intestine, where E. coli dwells, as well as at the buried anoxic boundaries of soils. The formation of H2O2 in such regions might explain the otherwise peculiar observation that even obligate anaerobes possess potent inducible defenses against H2O2.
The methods outlined in this paper are deliberately simple, within the reach of most microbiology labs. More sophisticated equipment could be designed, including feedback-controlled chemostats that sustain defined levels of H2O2. However, illuminated lumichrome provides an easy way to screen strains of interest without creating scavenger-deficient derivatives, while the H2O2-supplementation method should enable workers to precisely quantify the H2O2 sensitivity of various bacteria.
Misleading outcomes driven by H2O2 in lab media
We found that standard media quickly accumulate enough H2O2 to induce stress response systems in E. coli. The underlying chemistries are familiar; it was our intent to appraise their impact upon common laboratory procedures. Interestingly, the fate of oxidant-sensitive mutants can differ between plate and liquid media. The oxyR mutants failed to form discrete colonies on plates, but they generally grew when inoculated into liquid. The distinction is that when bacteria are spread on a plate, each bacterium finds itself in a veritable ocean of micromolar H2O2, with little chance of protecting itself by clearing the H2O2 from its environment. It must manifest enough internal defenses to tolerate a constant H2O2 influx, or else perish. In contrast, because bacteria are usually inoculated into liquid at a substantial density, their collective scavenging activities can detoxify the medium. Each cell needs persist only until the H2O2 concentration drops, and then growth can resume. Cultures fail only if the initial inoculum is so dilute that scavenging is ineffective.
The problem of H2O2 toxicity in plate media has been inferred before: the plating efficiencies of some DNA repair mutants, for example, have been improved by top-spreading the plates with catalase [41-43, 45]. These outcomes have sometimes been assumed to reflect the effects of intracellular H2O2 formation, but it is now clear that they reflect the impact of exogenous H2O2. The rate at which 5 μM H2O2 flows into E. coli should exceed internal H2O2 production by a factor of 25. Importantly, this analysis suggests that “spontaneous” mutagenesis—which customarily is quantified on plates [65-67]—may predominantly arise from the H2O2 that contaminates the system. A key point is that the mutagenic impact of endogenous ROS, if any, remains to be determined.
Finally, the micromolar H2O2 that pervades plates potentially suppresses the outgrowth of many bacteria that might otherwise be isolated from natural environments. Several groups have observed that bacterial recovery is markedly improved by the addition of H2O2 scavengers [46-50]. Efforts to improve plating efficiency by the addition of thiol compounds and ascorbate were generally ineffective, which fits our observation that none of these species is an especially effective chemical scavenger of H2O2. We are hopeful that simple precautions—such as pouring plates under anoxic conditions or adding catalase when oxygen is unavoidable—will expand the types of bacteria that can be studied in the lab.
Highlights.
H2O2 measurements can be compromised by several types of chemical interference, but these problems can be identified and minimized.
Chemical and photochemical processes generate enough H2O2 in lab media that cells must activate stress responses in order to survive. This oxidative stress has often been misconstrued as arising from endogenous processes.
Approaches have been devised that allow one to impose upon cells chronic micromolar H2O2 stress similar to what they can encounter in natural habitats.
Using this approach, it was determined that environmental H2O2 in excess of 5 μM diminish growth. These concentrations are orders of magnitude lower than the doses that are often used in lab experiments.
Acknowledgments
This work was supported by grants GM49640 and GM101012 from the National Institutes of Health and by support from the China Scholarship Council (to X.L.).
Abbreviations
- AR
Amplex UltraRed
- HRP
horseradish peroxidase
- DTT
dithiothreitol
- DTPA
diethylenetetraaminepentaacetic acid
- ROS
reactive oxygen species
Footnotes
Publisher's Disclaimer: This is a PDF file of an unedited manuscript that has been accepted for publication. As a service to our customers we are providing this early version of the manuscript. The manuscript will undergo copyediting, typesetting, and review of the resulting proof before it is published in its final citable form. Please note that during the production process errors may be discovered which could affect the content, and all legal disclaimers that apply to the journal pertain.
References
- 1.Loew O. A new enzyme of general occurrence in organismis. Science. 1900;11:701–702. doi: 10.1126/science.11.279.701. [DOI] [PubMed] [Google Scholar]
- 2.Christman MF, Storz G, Ames BN. OxyR, a positive regulator of hydrogen peroxide-inducible genes in Escherichia coli and Salmonella typhimurium, is homologous to a family of bacterial regulatory proteins. Proc Natl Acad Sci USA. 1989;86:3484–3488. doi: 10.1073/pnas.86.10.3484. [DOI] [PMC free article] [PubMed] [Google Scholar]
- 3.Demple B, Halbrook J. Inducible repair of oxidative DNA damage in Escherichia coli. Nature. 1983;304:466. doi: 10.1038/304466a0. [DOI] [PubMed] [Google Scholar]
- 4.Imlay JA, Linn S. Mutagenesis and stress responses induced in Escherichia coli by hydrogen peroxide. J Bacteriol. 1987;169:2967–2976. doi: 10.1128/jb.169.7.2967-2976.1987. [DOI] [PMC free article] [PubMed] [Google Scholar]
- 5.Lee C, Lee SM, Mukhopadhyay P, Kim SJ, Lee SC, Ahn WS, Yu MH, Storz G, Ryu SE. Redox regulation of OxyR requires specific disulfide bond formation involving a rapid kinetic reaction path. Nat Struct Mol Biol. 2004;11:1179–1185. doi: 10.1038/nsmb856. [DOI] [PubMed] [Google Scholar]
- 6.Imlay JA. Transcription factors that defend bacteria against reactive oxygen species. Ann Rev Microbiol. 2015;69:93–108. doi: 10.1146/annurev-micro-091014-104322. [DOI] [PMC free article] [PubMed] [Google Scholar]
- 7.Lee JW, Helmann JD. The PerR transcription factor senses H2O2 by metal-catalyzed histidine oxidation. Nature. 2006;440:363–367. doi: 10.1038/nature04537. [DOI] [PubMed] [Google Scholar]
- 8.Boronat S, Domenech A, Paulo E, Calvo IA, Garcia-Santamarina S, Garcia P, Dedo JED, Barcons A, Serrano E, Carmona M, Hidalgo E. Thiol-based H2O2 signalling in microbial systems. Redox Biol. 2014;2:395–399. doi: 10.1016/j.redox.2014.01.015. [DOI] [PMC free article] [PubMed] [Google Scholar]
- 9.Aslund F, Zheng M, Beckwith J, Storz G. Regulation of the OxyR transcription factor by hydrogen peroxide and the cellular thiol-disulfide status. Proc Natl Acad Sci USA. 1999;96:6161–6165. doi: 10.1073/pnas.96.11.6161. [DOI] [PMC free article] [PubMed] [Google Scholar]
- 10.Seaver LC, Imlay JA. Hydrogen peroxide fluxes and compartmentalization inside growing Escherichia coli. J Bacteriol. 2001;183:7182–7189. doi: 10.1128/JB.183.24.7182-7189.2001. [DOI] [PMC free article] [PubMed] [Google Scholar]
- 11.Khademian M, Imlay JA. Escherichia coli cytochrome c peroxidase is a respiratory oxidase that enables the use of hydrogen peroxide as a terminal electron acceptor. Proc Natl Acad Sci USA. 2017;114:E6922–E6931. doi: 10.1073/pnas.1701587114. [DOI] [PMC free article] [PubMed] [Google Scholar]
- 12.Pericone CD, Park S, Imlay JA, Weiser JN. Factors contributing to hydrogen peroxide resistance in Streptococcus pneumoniae include pyruvate oxidase (SpxB) and avoidance of the toxic effects of the Fenton reaction. J Bacteriol. 2003;185:6815–6825. doi: 10.1128/JB.185.23.6815-6825.2003. [DOI] [PMC free article] [PubMed] [Google Scholar]
- 13.Seki M, Iida K, Saito M, Nakayama H, Yoshida S. Hydrogen peroxide production in Streptococcus pyogenes: involvement of lactase oxidase and coupling with aerobic utilization of lactate. J Bacteriol. 2004;186:2046–2051. doi: 10.1128/JB.186.7.2046-2051.2004. [DOI] [PMC free article] [PubMed] [Google Scholar]
- 14.Glass GA, DeLisle DM, DeTogni P, Gabig TG, Magee BH, Markert M, Babior BM. The respiratory burst oxidase of human neutrophils. Further studies of the purified enzyme. J Biol Chem. 1986;261:13247–13251. [PubMed] [Google Scholar]
- 15.Bedard K, Lardy B, Krause KH. NOX family NADPH oxidases: Not just in mammals. Biochemie. 2007;89:1107–1112. doi: 10.1016/j.biochi.2007.01.012. [DOI] [PubMed] [Google Scholar]
- 16.Kohen R, Shalhoub R. Prevention and induction of oxidative damage in E coli cells by cationized proteins. Free Rad Biol Med. 1994;16:571–580. doi: 10.1016/0891-5849(94)90057-4. [DOI] [PubMed] [Google Scholar]
- 17.Troxell B, Zhang JJ, Bourret TJ, Zeng MY, Blum J, Gherardini F, Hassan HM, Yang XF. Pyruvate protects pathogenic spirochetes from H2O2 killing. PLoS One. 2014;9:e84625. doi: 10.1371/journal.pone.0084625. [DOI] [PMC free article] [PubMed] [Google Scholar]
- 18.Kunrath-Lima M, Repoles BM, Alves CL, Furtado C, Rajao MA, Macedo AM, Franco GR, Pena SDJ, Valenquela L, Wisnovsky S, Kelley SO, Galanti N, Cabrera G, Machado CR. Characterization of Trypanosoma cruzi MutY DNA glycosylase ortholog and its role in oxidative stress response. Infect Genet Evol. 2017;55:332–342. doi: 10.1016/j.meegid.2017.09.030. [DOI] [PubMed] [Google Scholar]
- 19.Jang S, Imlay JA. Micromolar intracellular hydrogen peroxide disrupts metabolism by damaging iron-sulfur enzymes. J Biol Chem. 2007;282:929–937. doi: 10.1074/jbc.M607646200. [DOI] [PMC free article] [PubMed] [Google Scholar]
- 20.Sobota JM, Imlay JA. Iron enzyme ribulose-5-phosphate 3-epimerase in Escherichia coli is rapidly damaged by hydrogen peroxide but can be protected by manganese. Proc Natl Acad Sci USA. 2011;108:5402–5407. doi: 10.1073/pnas.1100410108. [DOI] [PMC free article] [PubMed] [Google Scholar]
- 21.Anjem A, Imlay JA. Mononuclear iron enzymes are primary targets of hydrogen peroxide stress. J Biol Chem. 2012;287:15544–15556. doi: 10.1074/jbc.M111.330365. [DOI] [PMC free article] [PubMed] [Google Scholar]
- 22.Sobota JM, Gu M, Imlay JA. Intracellular hydrogen peroxide and superoxide poison 3-deoxy-D-arabinoheptulosonate 7-phosphate synthase, the first committed enzyme in the aromatic biosynthetic pathway of Escherichia coli. J Bacteriol. 2014;196:1980–1991. doi: 10.1128/JB.01573-14. [DOI] [PMC free article] [PubMed] [Google Scholar]
- 23.Imlay JA. Transcription factors that defend bacteria against reactive oxygen species. Annu Rev Microbiol. 2015;69:93–108. doi: 10.1146/annurev-micro-091014-104322. [DOI] [PMC free article] [PubMed] [Google Scholar]
- 24.Antunes F, Cadenas E. Estimation of H2O2 gradients across biomembranes. FEBS Letts. 2000;475:121–126. doi: 10.1016/s0014-5793(00)01638-0. [DOI] [PubMed] [Google Scholar]
- 25.Carlsson J, Nyberg G, Wrethen J. Hydrogen peroxide and superoxide radical formation in anaerobic broth media exposed to atmospheric oxygen. Appl Environ Micro. 1978;36:223–229. doi: 10.1128/aem.36.2.223-229.1978. [DOI] [PMC free article] [PubMed] [Google Scholar]
- 26.Nakashima T, Seki T, Matsumoto A, Miura H, Sato E, Niwano Y, Kohno M, Omura S, Takahashi Y. Generation of reactive oxygen species from conventional laboratory media. J Biosci Bioeng. 2010;110:304–307. doi: 10.1016/j.jbiosc.2010.03.003. [DOI] [PubMed] [Google Scholar]
- 27.Tanaka T, Kawasaki K, Daimon S, Kitagawa W, Yamamoto K, Tamaki H, Tanaka M, Nakatsu CH, Kamagata Y. A hidden pitfall in the preparation of agar media undermines microorganism cultivability. Appl Environ Micro. 2014;80:7659–7666. doi: 10.1128/AEM.02741-14. [DOI] [PMC free article] [PubMed] [Google Scholar]
- 28.Parshad R, Sanford KK, Jones GM, Tarone RE. Fluorescent light-induced chromosome damage and its prevention in mouse cells in culture. Proc Natl Acad Sci USA. 1978;75:1830–1833. doi: 10.1073/pnas.75.4.1830. [DOI] [PMC free article] [PubMed] [Google Scholar]
- 29.Wang RJ, Nixon BT. Identification of hydrogen peroxide as a photoproduct toxic to human cells in tissue-culture medium irradiated with “daylight” fluorescent light. In Vitro Cell Dev Biol Anim. 1978;14:715–722. doi: 10.1007/BF02616168. [DOI] [PubMed] [Google Scholar]
- 30.Hoffman PS, Pine L, Bell S. Production of superoxide and hydrogen peroxide in medium used to culture Legionella pneumophila: catalytic decomposition by charcoal. Appl Environ Microbiol. 1983;45:784–791. doi: 10.1128/aem.45.3.784-791.1983. [DOI] [PMC free article] [PubMed] [Google Scholar]
- 31.Grzelak A, Rychlik B, Bartosz G. Light-dependent generation of reactive oxygen species in cell culture media. Free Rad Biol Med. 2001;30:1418–1425. doi: 10.1016/s0891-5849(01)00545-7. [DOI] [PubMed] [Google Scholar]
- 32.Miller JH. Experiments in Molecular Genetics. Cold Spring Harbor, N.Y.: Cold Spring Harbor Laboratory; 1972. [Google Scholar]
- 33.Liu Y, Imlay JA. Cell death from antibiotics without the involvement of reactive oxygen species. Science. 2013;339:1210–1213. doi: 10.1126/science.1232751. [DOI] [PMC free article] [PubMed] [Google Scholar]
- 34.Ramu A, Mehta MM, Liu J, Turyan I, Aleksic A. The riboflavin-mediated photooxidation of doxorubicin. Cancer Chemother Pharmacol. 2000;46:449–458. doi: 10.1007/s002800000174. [DOI] [PubMed] [Google Scholar]
- 35.Remucal CK, McNeill K. Photosensitized amino acid degradation in the presence of riboflavin and its derivatives. Environ Sci Technol. 2011;45:5230–5237. doi: 10.1021/es200411a. [DOI] [PubMed] [Google Scholar]
- 36.Job D, Dunford HB. Substituent effect on the oxidation of phenols and aromatic amines by horseradish peroxidase compound I. Eur J Biochem. 1976;66:607–614. doi: 10.1111/j.1432-1033.1976.tb10588.x. [DOI] [PubMed] [Google Scholar]
- 37.Sakurada J, Sekiguchi R, Sato K, Hosoya T. Kinetic and moleular orbital studies on the rate of oxidation of monosubstituted phenols and anilines by horseradish peroxidase compound II. Biochemistry. 1990;29:4093–4098. doi: 10.1021/bi00469a011. [DOI] [PubMed] [Google Scholar]
- 38.Rao DNK, Fischer V, Mason RP. Glutathione and ascorbate reduction of the acetaminophen radical formed by peroxidase. Detection of the glutathione disulfide radical anion and the ascorbyl radical. J Biol Chem. 1990;265:844–847. [PubMed] [Google Scholar]
- 39.Michot JL, Virion A, Deme D, Prailaune SD, Pommier J. NADPH oxidation catalyzed by the peroxidase/H2O2 system. Guaiacol-mediated and scopoletin-mediated oxidation of NADPH to NADP+ Eur J Biochem. 1985;148:441–445. doi: 10.1111/j.1432-1033.1985.tb08859.x. [DOI] [PubMed] [Google Scholar]
- 40.Winterbourn CC, Metodiewa D. Reactivity of biologically important thiol compounds with superoxide and hydrogen peroxide. Free Rad Biol Med. 1999;27:322–328. doi: 10.1016/s0891-5849(99)00051-9. [DOI] [PubMed] [Google Scholar]
- 41.Morimyo M. Anaerobic incubation enhances the colony formation of a polA recB strain of Escherichia coli K-12. J Bacteriol. 1982;152:208–214. doi: 10.1128/jb.152.1.208-214.1982. [DOI] [PMC free article] [PubMed] [Google Scholar]
- 42.Boling M, Adler H, Masker W. Restoration of viability to an Escherichia coli mutant deficient in the 5′ to 3′ exonuclease of DNA polymerase I. J Bacteriol. 1984;160:706–710. doi: 10.1128/jb.160.2.706-710.1984. [DOI] [PMC free article] [PubMed] [Google Scholar]
- 43.Imlay JA, Linn S. Bimodal pattern of killing of DNA-repair-defective or anoxically grown Escherichia coli by hydrogen peroxide. J Bacteriol. 1986;166:519–527. doi: 10.1128/jb.166.2.519-527.1986. [DOI] [PMC free article] [PubMed] [Google Scholar]
- 44.Shi M, Wan F, Mao Y, Gao H. Unraveling the mechanism for the viability deficiency of Shewanella oneidensis oxyR null mutant. J Bacteriol. 2015;197:2179–2189. doi: 10.1128/JB.00154-15. [DOI] [PMC free article] [PubMed] [Google Scholar]
- 45.Mackey BM, Seymour DA. The effect of catalase on recovery of heat-injured DNA-repair mutants of Escherichia coli. J Gen Microbiol. 1987;133:1601–1610. doi: 10.1099/00221287-133-6-1601. [DOI] [PubMed] [Google Scholar]
- 46.Hoffman PS, George HA, Krieg NR, Smibert RM. Studies of the microaerophilic nature of Campylobacter fetus subsp. jejuni. II. Role of exogenous superoxide anions and hydrogen peroxide. Can J Microbiol. 1979;25:8–16. doi: 10.1139/m79-002. [DOI] [PubMed] [Google Scholar]
- 47.Hood AM, Tuck A, Dane CR. A medium for the isolation, enumeration and rapid presumptive identificaiton of injured Clostridium perfringens and Bacillus cereus. J Appl Bacteriol. 1990;69:359–372. doi: 10.1111/j.1365-2672.1990.tb01526.x. [DOI] [PubMed] [Google Scholar]
- 48.Mizunoe Y, Wai SN, Takade A, Yoshida S. Restoration of culturability of starvation-stressed and low-temperature-stressed Escherichia coli O157 cells by using H2O2-degrading compounds. Arch Microbiol. 1999;172:63–67. doi: 10.1007/s002030050741. [DOI] [PubMed] [Google Scholar]
- 49.Bobosian G, Aardema ND, Bourneuf EV, Morris PJL, O’Neil JP. Recovery of hydrogen peroxide-sensitive culturable cells of Vibrio vulnificus gives the appearance of resuscitation from a viable but nonculturable state. J Bacteriol. 2000;182:5070–5075. doi: 10.1128/jb.182.18.5070-5075.2000. [DOI] [PMC free article] [PubMed] [Google Scholar]
- 50.Dione N, Khelaifia S, Scola BL, Lagier JC, Raoult D. A quasi-universal medium to break the aerobic/anaerrobic bacterial culture dichotomy in clinical microbiology. Clin Microbiol Infect. 2016;22:53–58. doi: 10.1016/j.cmi.2015.10.032. [DOI] [PubMed] [Google Scholar]
- 51.Wolff SP, Bascal ZA, Hunt JV. “Autoxidative glycosylation”: free radicals and glycation theory. Prog Clin Biol Res. 1989;304:259–275. [PubMed] [Google Scholar]
- 52.Ezraty B, Henry C, Herisse M, Denamur E, Barras F. Commercial lysogeny broth culture media and oxidative stress: A cautious tale. Free Rad Biol Med. 2014;74:245–251. doi: 10.1016/j.freeradbiomed.2014.07.010. [DOI] [PubMed] [Google Scholar]
- 53.Beauchamp C, Fridovich I. Superoxide dismutase: improved assays and an assay applicable to acrylamide gels. Anal Biochem. 1971;44:276–287. doi: 10.1016/0003-2697(71)90370-8. [DOI] [PubMed] [Google Scholar]
- 54.Hassan HM, Fridovich I. Intracellular production of superoxide radical and of hydrogen peroxide by redox active compounds. Arch Biochem Biophys. 1979;196:385–395. doi: 10.1016/0003-9861(79)90289-3. [DOI] [PubMed] [Google Scholar]
- 55.Zheng M, Wang X, Templeton LJ, Smulski DR, LaRossa RA, Storz G. DNA microarray-mediated transcriptional profiling of the Escherichia coli response to hydrogen peroxide. J Bacteriol. 2001;183:4562–4570. doi: 10.1128/JB.183.15.4562-4570.2001. [DOI] [PMC free article] [PubMed] [Google Scholar]
- 56.Aussel L, Zhao W, Hebrard M, Guilhon AA, Viala JP, Henri S, Chasson L, Gorvel JP, Barras F, Meresse S. Salmonella detoxifying enzymes are sufficient to cope with the host oxidative burst. Mol Microbiol. 2011;80:628–640. doi: 10.1111/j.1365-2958.2011.07611.x. [DOI] [PubMed] [Google Scholar]
- 57.Helmann JD, Wu MFW, Gaballa A, Kobel PA, Morshedi MM, Fawcett P, Paddon C. The global transcriptional response of Bacillus subtilis to peroxide stress is coordinated by three transcription factors. J Bacteriol. 2003;185:243–253. doi: 10.1128/JB.185.1.243-253.2003. [DOI] [PMC free article] [PubMed] [Google Scholar]
- 58.Carlsson J, Carpenter VS. The recA+ gene product is more important that catalase and superoxide dismutase in protecting Escherichia coli against hydrogen peroxide toxicity. J Bacteriol. 1980;142:319–321. doi: 10.1128/jb.142.1.319-321.1980. [DOI] [PMC free article] [PubMed] [Google Scholar]
- 59.Demple B, Halbrook J, Linn S. Escherichia coli xth mutants are hypersensitive to hydrogen peroxide. J Bacteriol. 1983;153:1079–1082. doi: 10.1128/jb.153.2.1079-1082.1983. [DOI] [PMC free article] [PubMed] [Google Scholar]
- 60.Imlay JA. Oxidative Stress. In: Bock A, Curtiss R III, Kaper JB, Karp PD, Neidhardt FC, Nystrom T, Slauch JM, Squires CL, Ussery D, editors. EcoSal–Escherichia coli and Salmonella: Cellular and Molecular Biology. Washington, D.C.: ASM Press; 2009. http://www.ecosal.org. [Google Scholar]
- 61.Winterbourn CC, Hampton MB, Livesey JH, Kettle AJ. Modeling the reactions of superoxide and myeloperoxidase in the neutrophil phagosome. Implications for microbial killing. J Biol Chem. 2006;281:39860–39869. doi: 10.1074/jbc.M605898200. [DOI] [PubMed] [Google Scholar]
- 62.Partridge JD, Poole RK, Green J. The Escherichia coli yhjA gene, encoding a predicted cytochrome c peroxidase, is regulated by FNR and OxyR. Microbiology. 2007;153:1499–1507. doi: 10.1099/mic.0.2006/004838-0. [DOI] [PubMed] [Google Scholar]
- 63.Mishra S, Imlay JA. An anaerobic bacterium, Bacteroides thetaiotaomicron, uses a consortium of enzymes to scavenge hydrogen peroxide. Mol Microbiol. 2013;90:1356–1371. doi: 10.1111/mmi.12438. [DOI] [PMC free article] [PubMed] [Google Scholar]
- 64.Lu Z, Imlay JA. The fumarate reductase of Bacteroides thetaiotaomicron, unlike that of Escherichia coli, is configured so that it does not generate reactive oxygen species. mBio. 2017;8:e01873–16. doi: 10.1128/mBio.01873-16. [DOI] [PMC free article] [PubMed] [Google Scholar]
- 65.Sakai A, Nakanishi M, Yoshiyama K, Maki H. Impact of reactive oxygen species on spontaneous mutagenesis in Escherichi coli. Genes to Cells. 2006;11:767–778. doi: 10.1111/j.1365-2443.2006.00982.x. [DOI] [PubMed] [Google Scholar]
- 66.Setoyama D, Ito R, Takagi Y, Sekiguchi M. Molecular actions of Escherichia coli MutT for control of spontaneous mutagenesis. Mut Res. 2011;707:9–14. doi: 10.1016/j.mrfmmm.2010.12.001. [DOI] [PubMed] [Google Scholar]
- 67.Charbon G, Bjorn L, Mendoza-Chamizo B, Frimodt-Moller J, Lobner-Olesen A. Oxidative DNA damage is instrumental in hyperreplication stress-induced inviability of Escherichia coli. Nucl Acid Res. 2014;42:13228–13241. doi: 10.1093/nar/gku1149. [DOI] [PMC free article] [PubMed] [Google Scholar]
- 68.Kohler H, Taurog A, Dunford HB. Spectral studies with lactoperoxidase and thyroid peroxidase: interconversions between native enzyme, compound II, and compound III. Arch Biochem Biophys. 1988;264:438–449. doi: 10.1016/0003-9861(88)90309-8. [DOI] [PubMed] [Google Scholar]