Abstract
Objective
Calcific aortic valve disease (CAVD) is a major cause of aortic stenosis (AS) and cardiac insufficiency. Patients with type II diabetes mellitus (T2DM) are at heightened risk for CAVD, and their valves have greater calcification than nondiabetic valves. No drugs to prevent or treat CAVD exist, and animal models that might help identify therapeutic targets are sorely lacking. To develop an animal model mimicking the structural and functional features of CAVD in people with T2DM, we tested a diabetogenic, procalcific diet and its effect on the incidence and severity of CAVD and AS in the, LDLr−/−ApoB100/100 mouse model.
Results
LDLr−/−ApoB100/100 mice fed a customized diabetogenic, procalcific diet (DB diet) developed hyperglycemia, hyperlipidemia, increased atherosclerosis, and obesity when compared with normal chow fed LDLr−/−ApoB100/100 mice, indicating the development of T2DM and metabolic syndrome. Transthoracic echocardiography revealed that LDLr−/−ApoB100/100 mice fed the DB diet had 77% incidence of hemodynamically significant AS, and developed thickened aortic valve leaflets and calcification in both valve leaflets and hinge regions. In comparison, normal chow (NC) fed LDLr−/−ApoB100/100 mice had 38% incidence of AS, thinner valve leaflets and very little valve and hinge calcification. Further, the DB diet fed mice with AS showed significantly impaired cardiac function as determined by reduced ejection fraction and fractional shortening. In vitro mineralization experiments demonstrated that elevated glucose in culture medium enhanced valve interstitial cell (VIC) matrix calcium deposition.
Conclusions
By manipulating the diet we developed a new model of CAVD in T2DM, hyperlipidemic LDLr−/−ApoB100/100 that shows several important functional, and structural features similar to CAVD found in people with T2DM and atherosclerosis including AS, cardiac dysfunction, and inflamed and calcified thickened valve cusps. Importantly, the high AS incidence of this diabetic model may be useful for mechanistic and translational studies aimed at development of novel treatments for CAVD.
Keywords: Calcific aortic valve disease; type II diabetes mellitus, aortic stenosis; valve interstitial cells
1. Introduction
Calcific aortic valve disease (CAVD) is the underlining pathology leading to the clinical manifestation of aortic stenosis (AS), which can lead to heart failure and death if untreated [1]. CAVD is characterized by the accumulation, over time, of calcium-phosphate nodules within the fibrous matrix of the aortic valve leaflets resulting in a dysfunctional and narrowed valve opening. As CAVD is a progressive disease, patients are frequently free of symptoms for several decades, however ~30% of the aging population is affected with aortic sclerosis that is the early asymptomatic manifestation of the disease. A smaller group of this population will progress to the symptomatic AS, ~2% by age 65 and ~4% by age 85. CAVD accounts for 50% of cardiac valve disease and is the third most common cardiovascular disease following coronary disease and hypertension [2, 3]. In symptomatic CAVD patients, the narrowed valve opening results in obstruction of left ventricular outflow, reduced cardiac output, and increased blood velocity through the valve opening eventually leading to left ventricular dysfunction and heart failure [4, 5].
CAVD risk factors include congenital malformation, age, male sex, smoking, hypercholesterolemia, hypertension, and diabetes mellitus [6]. Patients with type II diabetic mellitus (T2DM) not only have a heightened risk for CAVD but also a significantly increased “new” incidence compared to those without [7, 8]. In addition, Nishimura et al. have recently reported that diabetes and moderate/severe calcification score at diagnosis predicted first year rapid progression [9]. Metabolic syndrome was also associated with faster disease progression and worse outcome in patients with AS [10]. At the tissue level, histopathological assessment showed greater calcification in diseased aortic valves from T2DM patients compared to nondiabetic patients [11].
To date, there are no pharmacological treatments available to reverse or retard the progression of CAVD. Traditional cardiovascular drugs like cholesterol-lowering therapies (statins) and renin–angiotensin system blocking drugs have been the major pharmacological agents under active investigation in clinical trials, but have proven to be unsuccessful in slowing the progression of CAVD [12–15]. These findings imply that despite the similarity in risk factors between vascular and valvular disease and the coexistence of CAVD and cardiovascular disease in patients, different mechanisms underlie their development and progression [16–18]. Thus, as there is no effective drug therapy for CAVD, AS is the second most common indication for cardiac surgery. Surgical methods to repair or replace the aortic valve include open-heart or transcatheter aortic valve replacement [19]. Both are associated with risk of adverse events and substantial healthcare costs [4]. Given that the burden of diabetes and CAVD will continue to increase worldwide in the coming decade, a pharmacological method to reverse or slow the progression of CAVD is greatly needed.
Part of the reason for the lack of therapies to treat CAVD in diabetes is the paucity of animal models mimicking the structural and functional features of human diabetic CAVD. Structurally human diseased valve leaflets show severe fibrosis, calcific nodules, neoangiogenesis, inflammation, bone metaplasia with or without hematopoiesis, adipose metaplasia, and cartilaginous metaplasia [20]. Further, valve leaflets derived from diabetic patients have statistically more calcium nodules and overall calcification [11]. In the present study, we report the development of a new mouse model of lipid-driven, diabetic CAVD that recapitulates the functional features of CAVD found in patients as well several of the structural features of human diseased valve leaflets including fibrosis, calcification deposits, inflammation and cartilaginous metaplasia. To achieve this we used the atherosclerosis prone LDLr−/−:ApoB100/100 mice that when fed a custom diabetogenic procalcific (DB) diet developed T2DM and metabolic syndrome, high incidence of CAVD characterized by more calcium deposits on the valve leaflets than control diet mice, and had a higher incidence of hemodynamically significant AS than any diet induced animal models to date. Finally, left ventricular function of these mice was also diminished [21]. This new diet and genetic model combination should aid in testing new mechanistic hypotheses regulating CAVD in diabetes and therapies in general.
2. Material and Methods
2.1 Animals
Male LDLr−/−:ApoB100/100 male mice, 10-12 weeks old (≥20g), were randomly assigned to two groups fed either a diabetogenic, procalcific diet (DB; Bio-Serv., 1.25% cholesterol, 57.5% kcal fat, 27.4% kcal carbohydrate) [21] to induce CAVD or normal chow (NC) as dietary control. Body weight and fasted blood glucose levels were recorded before challenging with the diets and every five weeks until 20 weeks of diet. A total of 13 mice per group were used for echocardiography and histological analysis of aortic valves. Mice were euthanized via intraperitoneal injection of pentobarbital (150 mg/kg) followed by exsanguination through cardiac puncture to collect sera. All animals were maintained in a specific pathogen-free environment and genotypes were determined as described [21, 22]. All protocols are in compliance with the NIH Guideline for the Care and Use of Laboratory Animals and have been approved by the Institutional Animal Care and Use Committee, University of Washington.
2.2 Echocardiography
Transthoracic echocardiography was performed in isoflurane anesthetized mice with a heart rate of ~450-500 beats/min using high-resolution in vivo ultrasound imaging system for small animals equipped with a 40-MHz transducer (Vevo 2100™, VisualSonics Inc.). Aortic valve function was assessed using Pulse Wave Doppler-mode that measures aortic valve peak velocity and gradient. In brief, Doppler flow velocity spectrum of the ascending aorta of each mouse was recorded at three locations, the anterior, middle, and posterior parts of the aortic lumen. A minimum of three cardiac cycles at each location were traced to obtain an average for aortic peak velocity and gradient using Vevo 2100™ software. Images were taken from the upper right parasternal long axis view and the angle of the transducer was maintained at 55 degree. B-mode and M-mode images of the parasternal long axis and short axis views were used to measure left ventricular dimensions and volumes, fractional shortening, and ejection fraction. The cardiac package provided by VisualSonic was used to measure and calculate several parameters including the aortic jet velocity and the mean gradient. The aortic valve area (AVA) was calculated with the continuity equation [23, 24].
2.3 Serum Analyses
Sera were collected with serum separator tubes and analyzed for cholesterol, triglyceride and phosphate levels via bioanalyzer. Calcium levels were determined colorimetrically using the o-Cresolphthalein complexone kit (Teco Diagnostics, C503-480) as previously described.36 Blood urea nitrogen (BUN) was measured using QuantiChrom Urea Assay Kit (BioAssay System, DIUR-500) [25].
2.4 Histochemical and Immunohistochemical Staining
LDLr−/−:ApoB100/100 mice were perfused fix and hearts were post-fixed with modified 10% formalin prior to processing and embedding in paraffin. Serial sections were made in 5 μm thickness and subject to various histochemical and immunohistochemical staining. Alizarin red S and Osteosense were used to visualize calcium deposition. Movat pentachrome staining was used to visualize atherosclerotic lesion and cartilaginous metaplasia and Picrosirus Red was used to visualize collagen [26].
2.5 Morphometric Analysis of Aortic Roots
To measure aortic valve leaflet size and sinus lesion size, four cross sections, 80 μm apart over 320 μm in depth, starting at the appearance of three valve leaflets, were collected from each aortic root. Sections were stained using the Movat pentachrome method, and aortic sinus lesion area and valve leaflet area were measured blindly and normalized to the cross sectional area of aortic root using NIS elements software (Nikon) [26–28]. To assess calcium deposition Osteosense positive areas were visualized fluorescently using the same sampling scheme, and determined morphometrically as percentage of the total areas measured [26].
2.6 Baboon VIC Calcium Assay
Non-human primate baboon VICs (BVICs) were generated and characterized as previously described [29] Approximately 40,000 cells were seeded in each well of 12-well plates and cultured in DMEM culture medium containing 5% (v/v) fetal bovine serum (FBS) and 100 U/mL penicillin/streptomycin (normal medium) or calcification medium (normal medium supplemented with inorganic phosphate to a final concentration of 2.6 mM) to induce calcification. After five days, cells were rinsed with PBS and decalcified with 0.6 mmol/L HCl at 4°C for 24 hours. Levels of calcium released from cell cultures were determined colorimetrically by the o-cresolphthalein complexone method as previously described (Teco Diagnostics, C503-480) [30]. Calcium amount was normalized to cellular protein of the culture and expressed as μg/mg cellular protein.
2.7 Statistics
Normality of distribution was assessed with Shapiro-Wilk normality test. Normally distributed data are shown as means ± S.E.M., and were analyzed with Student’s t-test for comparison of 2 groups, and one-way ANOVA with Dunnett’s test and two-way ANOVA with Bonferroni’s test for comparison of multiple groups. Data that were not normally distributed were analyzed with Mann-Whitney U test. Data are considered statistically significant at a p value < 0.05.
3. Results
3.1 Diabetogenic diet-feeding induces symptoms of T2DM in LDLr−/−ApoB100/100 mice
To induce T2DM, LDLr−/−ApoB100/100 mice were fed a well characterized diabetogenic, procalcific (DB) diet [21]. As shown in figure 1A, blood glucose levels increased steadily and significantly in mice fed the DB diet when compared to normal chow (NC) fed LDLr−/−ApoB100/100 mice. Likewise, mice fed the DB diet showed a significant and steady increase in body weight (figure 1B). At 7 months of age DB fed mice were significantly heavier than NC fed, however, at 14 months there was no significant difference in weight between the two groups. As expected, blood cholesterol and triglycerides levels were elevated in DB fed mice compared to NC fed at 14 months of age. Phosphate and calcium serum levels were slightly but significantly elevated in the DB fed group, however, there was no significant difference in urea nitrogen levels, indicating normal renal function (Table 1).
Figure 1. Characterization of LDLr−/−ApoB100/100 mice fed a customized type 2 diabetes mellitus inducing procalcific diet.

LDLr−/−ApoB100/100 mice were challenged with a customized type 2 diabetes mellitus inducing procalcific (DB) and a control normal chow (NC) diet. T2DM development was monitored by blood glucose level (A) and body weight (B). Data are normally distributed. Data were analyzed by two-way ANOVA with repeated measure and Bonferroni’s test, Mean ± S.E.M., n=8–13. *p<0.001 DB vs. NC for both glucose and body weight.
Table 1.
Serum biochemistry at 14 months for NC and DB diet fed LDLr−/−ApoB100/100 mice. Data are normally distributed.
| NC diet | DB diet | |
|---|---|---|
| Triglyceride (mmol/L) | 2.26 ± 0.10 | 3.51 ± 0.27* |
| Cholesterol (mmol/L) | 10.71 ± 0.49 | 33.00 ± 3.65* |
| Phosphate (mmol/L) | 2.49 ± 0.14 | 2.87 ± 0.10* |
| Calcium (mmol/L) | 2.11 ± 0.16 | 2.83 ± 0.06* |
| Urea Nitrogen (mmol/L) | 7.28 ± 0.45 | 8.57 ± 0.68 |
Data analyzed with Unpaired t-test
p<0.001 DB vs. NC. Mean ± S.E.M., n=13.
3.2 DB fed mice have impaired Aortic Valve Function
To assess whether the DB diet affected aortic valve function and the development of AS, we performed hemodynamic echocardiography. At 14 months of age, LDLr−/−ApoB100/100 mice DB fed showed a significantly greater proportion of AS than NC fed mice, as indicated by aortic jet velocities greater than 1600 mm/s (10/13=77% versus 5/13=38%, respectively, p=.048) (Figure 2A and 2B). The 1600 mm/s cut-off value was chosen as it represents a doubling of the aortic jet velocity in WT mice fed normal chow (~ 8000 mm/s) [31]; this is consistent with clinically established parameters for human severe AS [23]. Further and importantly, the mean gradient was significantly greater and the stenotic orifice area or aortic valve area (AVA) was significantly smaller in DB vs NC fed mice (figure 2C and 2D). Finally, cardiac muscle function parameters were also affected by the DB diet. Both the ejection fraction and the fractional shorting trended lower in DB fed compared to NC fed mice (figure 3A and 3B and B mode and M mode example tracing in figure 4). Further, when only mice with AS (aortic jet velocity> 1600 mm/s) were analyzed as a subgroup, both ejection fraction and fractional shortening were significantly impaired in DB fed compared to the NC fed animals (figure 3C and 3D).
Figure 2.
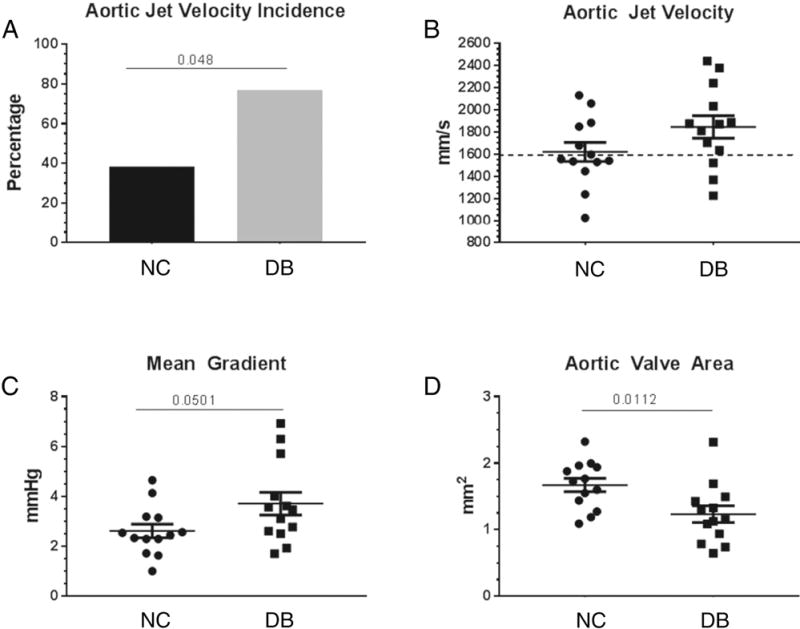
Hemodynamic echocardiography analysis. Aortic jet velocity was measured in 14 month old DB and NC fed LDLr−/−ApoB100/100 mice. The mean gradient was calculated by the VisualSonic software and the aortic valve area (AVA) was calculated with the continuity equation. (A) incidence of aortic jet velocity above 1600 mm/s; (B) scatter plot of single aortic jet velocity values, 1600 mm/s cut –off shown by dotted line; (C) scatter plot of single mean gradient values; (D) scatter plot of single AVA values. Data are normally distributed. Data analyzed with Unpaired t-test, p values are shown within the graphs. Mean ± S.E.M., n=13.
Figure 3.
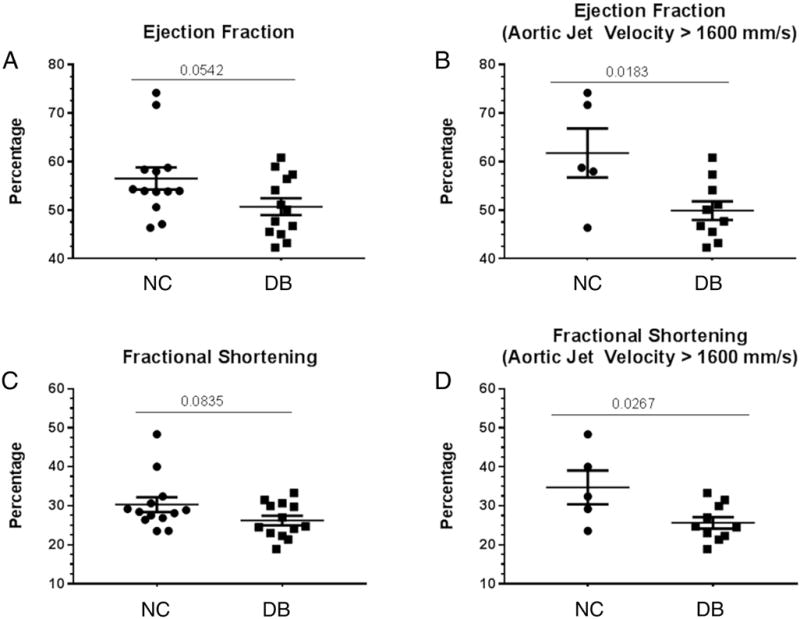
Hemodynamic echocardiography analysis. The ejection fraction and fractional shortening were calculated by the VisualSonic software following echocardiography of 14 month old LDLr−/−ApoB100/100 fed DB and NC diets. (A) Scatter plot of mean Ejection fraction of all 13 mice in the study; (B) scatter plot of mean ejection fraction of only mice with aortic jet velocity > 1600 mm/s; (C) scatter plot of mean fractional shortening of all 13 mice in the study; (D) scatter plot of mean fractional shortening of only mice with aortic jet velocity > 1600 mm/s. Data are normally distributed. Data analyzed with Unpaired t-test, p values are shown within the graphs. Mean ± S.E.M. For A and C, n=13 for both NC and DB. For B and D, n=5 for NC and n=10 for DB.
Figure 4.
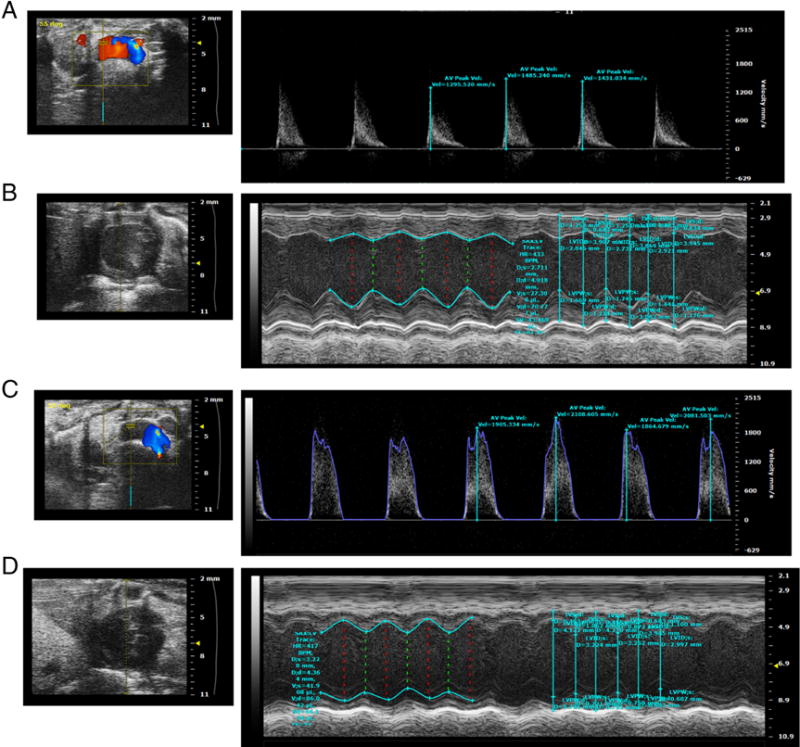
Aortic Valve Echo Doppler (A), and B mode and M mode left ventricle views (B) of a representative NC fed LDLr−/−ApoB100/100 mouse. Aortic Valve Echo Doppler (C), and B mode and M mode left ventricle views (D) of a representative DB fed LDLr−/−ApoB100/100 mouse.
3.3 DB fed mice have thicker and more calcified aortic valve leaflets and sinus lesions than NC mice
We next performed histological analyses to determine aortic valve leaflet morphology and calcification. Movat Pentacrome staining of the aortic sinus region revealed that 14 month-old LDLr−/−ApoB100/100 mice fed the DB diet had significantly thicker valve leaflets than NC fed mice (figure 5A–C). As expected, DB feeding also induced larger atherosclerotic lesions than NC feeding (figure 5D). Osteosense stained aortic sinus sections revealed that DB diet fed mice had significantly more calcium deposits associated with the valve leaflets and the atherosclerotic lesions (figure 6A and 6B, asterisks). Further analyses revealed extensive collagen deposition in the leaflets of mice fed either diet (figure 7A and B). Further, staining for macrophages showed widespread macrophage accumulation in the thickened, calcified leaflets of DB fed mice (Figure 7C and D). Detailed histological analysis of DB fed mice showed the presence of chondrocyte-like cells in the collagen-rich hinge areas as well as in the collagen- and proteoglycan-rich areas of the valve leaflets (figure 8A, B, D and E). Calcium deposits were found in the collagen-rich hinge areas and in the proteoglycan- and collagen-rich areas of the valve leaflets (figure 8 C and F). As shown in figure 7, calcium deposits were also found in the atherosclerotic lesion (figure 8C and F). These results suggest that the elevated incidence of AS in DB fed mice are likely to result from the structural changes observed at the tissue level.
Figure 5.
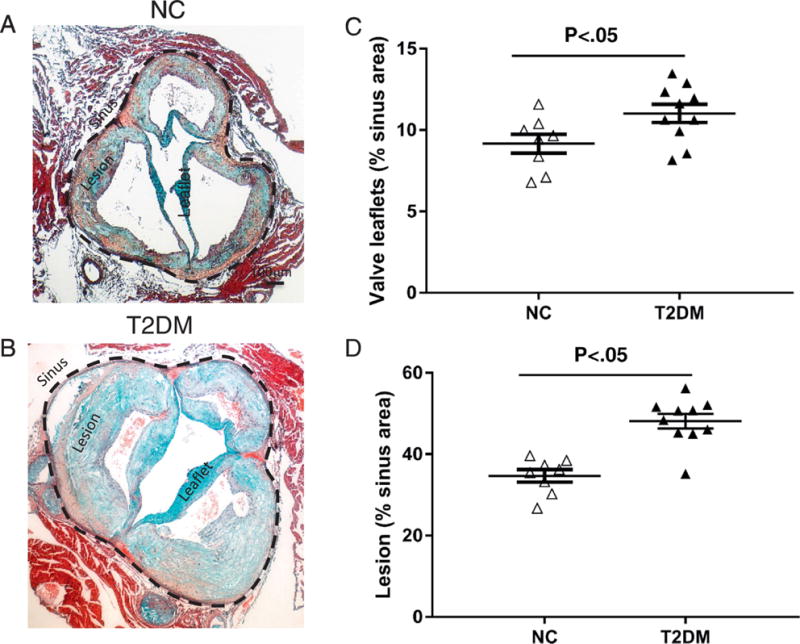
Quantification of aortic valve leaflet thickness and lesion size. Movat Pentachrome staining of representative sinus sections from 14 month old LDLr−/−ApoB100/100 fed NC (A) or DB (B) diet. Morphometric analysis of leaflet thickness (C) and atherosclerotic lesion size (D) of 14 month old LDLr−/−ApoB100/100 mice fed the DB or NC diet; Data are normally distributed. Data analyzed with Unpaired t-test, p values are shown within the graphs. Mean ± S.E.M., n=7 - 10.
Figure 6.
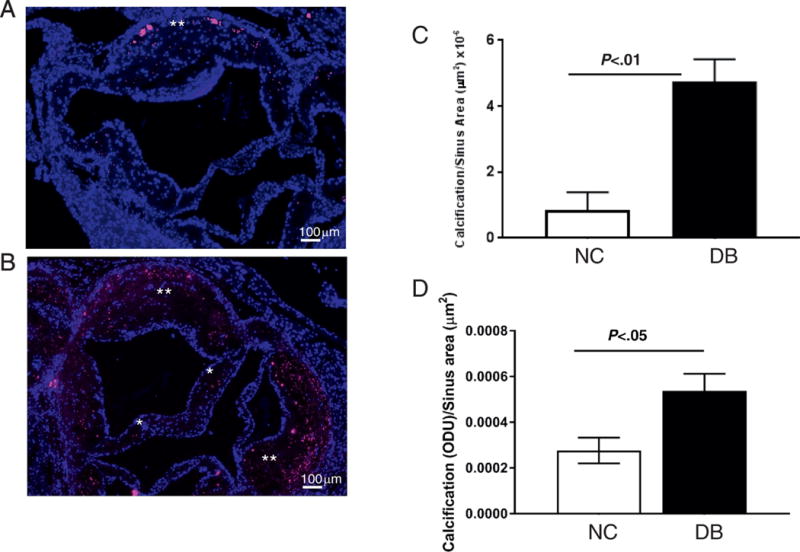
Quantification of calcium deposits in aortic valve leaflets and atherosclerotic lesions. Osteosense staining of representative sinus sections from 14 month old LDLr−/−ApoB100/100 fed NC (A) or DB (B) diet. Calcium deposition in the leaflet (*) and the atherosclerotic lesion (**). Morphometric analysis of calcium staining in valve leaflets (C) and the atherosclerotic lesion (D) of 14 month old LDLr−/−ApoB100/100 mice fed the DB or NC diet; Data are not normally distributed. Data analyzed with Mann-Whitney U test, p values are shown within the graphs. Mean ± S.E.M., n=7-10.
Figure 7.
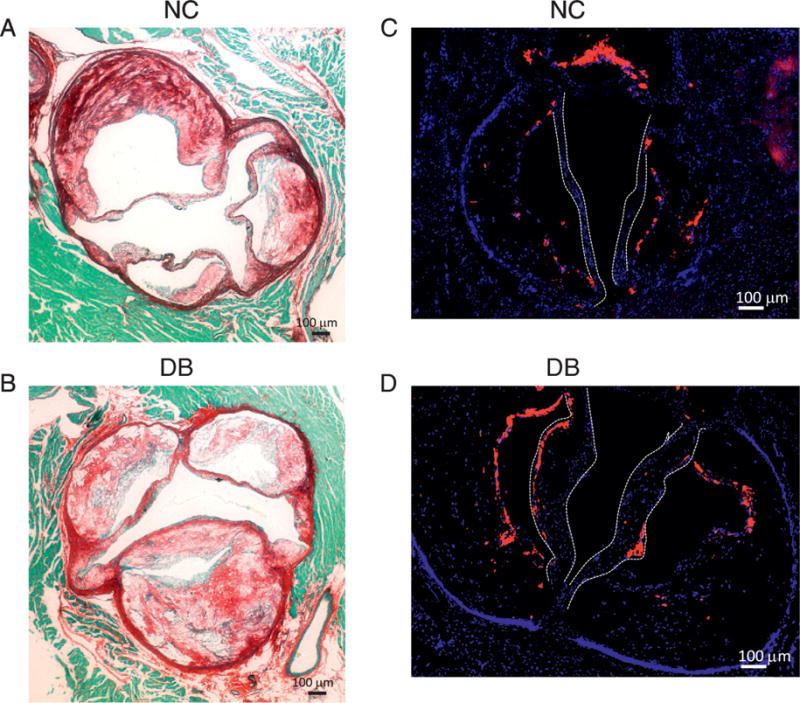
(A and B) histological staining for Picrosirus Red (A and B) showing extensive collagen fibers throughout the aortic sinus and in the thickened valve leaflets in DB fed mice (B). (C and D) immunofluorescence staining for the Mac2 antigen labeling macrophages showing extensive macrophage accumulation in the leaflets of DB fed mice. Leaflets shown by white dotted lines.
Figure 8.
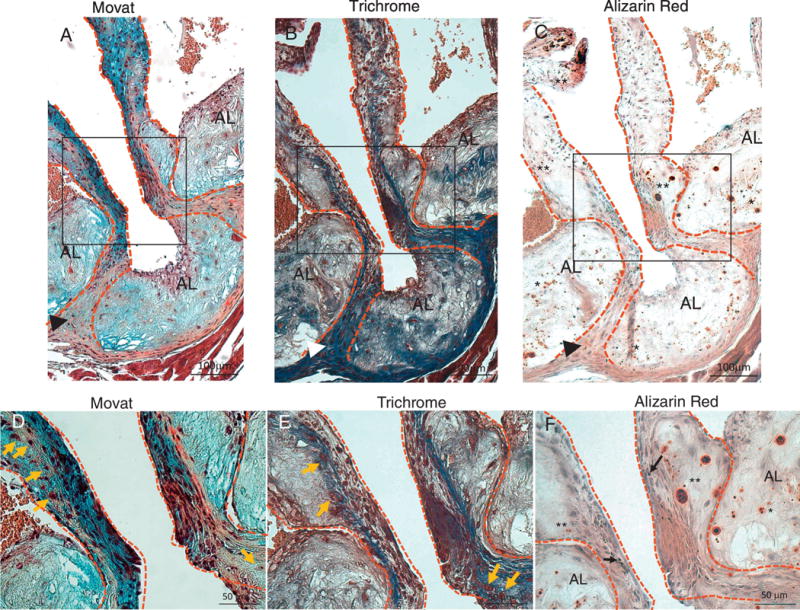
Movat (A and D), Trichrome (B and E), and Alizarin Red (C and F) staining of aortic sinus adjacent sections from DB fed mice. D, E and F are higher magnification of insets in A, B and C respectively. Dotted lines contour the valve leaflets and hinge areas. (A–C) Chondrocyte-like cells in hinge area co-localize with dense collagen and calcium deposits (arrow-heads). Extensive calcification in the leaflets (**, C and F) is associated with collagen and proteoglycan rich areas. Extensive calcification is also present in the atherosclerotic lesion (AL) (*, C and F) associated with collagen and proteoglycan rich areas. Chondrocyte-like cells are also present in the leaflets and hinge areas (orange arrows, D and E). Melanocytes (black arrows, F) are present in the leaflets. AL=atherosclerotic lesion areas, **=leaflet calcification, *=atherosclerotic lesion calcification, arrow-head=calcification and chondrocyte cells in the hinge areas, orange arrows=chondrocyte-like cells.
3.4 Higher Glucose levels enhance Valve Interstitial Cell mineralization
We next examined whether elevated glucose levels, similar to those observed in T2DM, could directly regulate valve interstitial cell (VIC) calcification in vitro. We used a well-characterized in vitro calcification assay whereby cells are cultured in calcification medium containing elevated inorganic phosphate to induce matrix mineralization. Baboon VICs were cultured in normal medium containing 1.0 mM inorganic phosphate and in calcification medium containing 2.6 mM inorganic phosphate in the presence of 5% fetal bovine serum. As shown in figure 9, the calcification medium induced VICs mineralization after 5 and 7 days of culture. Addition of 25 mM glucose (hyperglycemic level) to the calcification medium enhanced VIC mineralization by ~2 folds compared to 5.6 mM glucose cultures. No effect of glucose was found in VIC grown in normal media.
Figure 9.
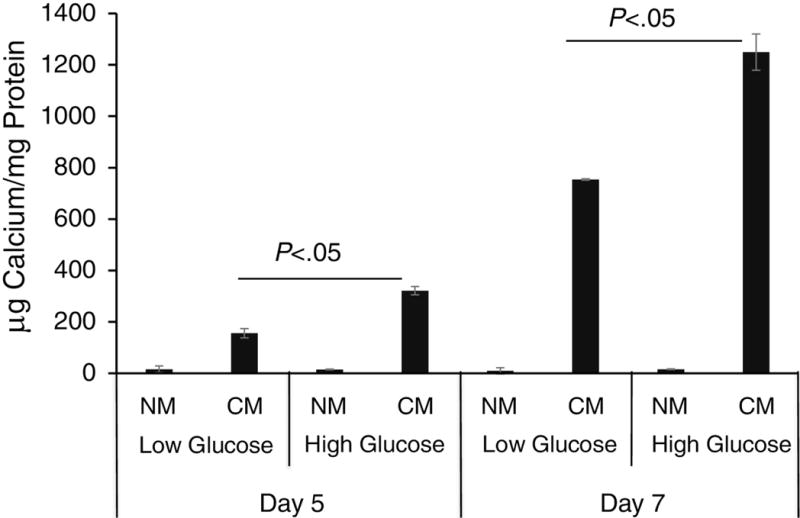
VIC calcification in response to elevated glucose. Baboon VICs were cultured normal media (NM) and in calcification media (CM) for 5 and 7 days. Cultures were also challenged with low, 5.6 mM, glucose (Low Glucose) or high, 25 mM, glucose (High Glucose). Calcium deposition was measured with a colorimetric method. Data are normally distributed. Data were analyzed by two-way ANOVA with Bonferroni’s test, Mean ± S.E.M. of triplicate experiments.
Discussion
T2DM has been associated with faster progression to symptomatic AS in patients with CAVD [1–3, 32–35]. Here we have developed a diabetic mouse model of CAVD with increased severity of valve calcification and accelerated progression to AS. This model provides researchers with a new tool to address the mechanisms of CAVD and AS, particularly in the setting of T2DM.
Our new model builds on the LDLr−/−ApoB100/100 CAVD mouse model, originally described by the Heistad group [33–35]. As reported by those investigators, about 50% of 20 month old LDLr−/−ApoB100/100 mice fed a western diet developed measurable AS evidenced by reduced cusp separation, reduced systolic valve orifice and increased aortic peak gradient. In these studies, Hiestad and colleagues examined the role of hyperlipidemia in the development of CAVD and AS. They indeed showed that the western diet induced mineralization of the valve cusps as well as acquisition of osteochondrogenic and oxidative signaling. When hyperlipidemia was reduced in the LDLr−/−ApoB100/100 “Reversa” mouse the osteochondrogenic signaling was dampened, however the valve function was not rescued [33]. These results are well aligned with the clinical finding that lipid lowering drugs (statins) do not ameliorate the severity of AS in humans [14, 15]. However, how T2DM and metabolic syndrome further contribute to worsen CAVD and AS and by which mechanisms remain unexplored and in need of new models and tools.
To determine whether T2DM exacerbated the severity of CAVD and progression to AS in LDLr−/−ApoB100/100, we used a previously characterized diabetogenic and procalcific diet (DB diet). This diet has been shown to induce T2DM with features of metabolic syndrome, as shown by hyperglycemia, hyperinsulinemia, hypercholesterolemia and obesity. Further, this diet induced extensive cartilaginous metaplasia and mineralization of the atherosclerotic arteries and it was found that insulin resistance positively correlated with the extent of calcification [21]. Using clinically recommended hemodynamic parameters for the assessment of AS [23, 24], we found that 77% of the LDLr−/−ApoB100/100 mice fed the DB diet for 12 months developed severe AS, compared to 38% of the mice fed the NC diet. Le Quang et al. have reported similar results using a genetic model in which plasma glucose elevation was obtained by overexpression of the insulin-like grow factor II in the LDLr−/−ApoB100/100 background, thus confirming that superimposition of hyperlipidemia and diabetes accelerate AS progression [36]. However, the LDLr−/−ApoB100/100 IGFII model entails an additional genetic manipulation which is not necessary with our DB diet induced T2DM model. We further observed that when only animals on either the DB or NC diet with aortic jet velocity above 1600 mm/s were analyzed for heart functional parameters, the DB fed mice showed decreased ejection fraction and fractional shortening indicating acceleration of myocardium deterioration and suggesting an earlier onset of AS and CAVD in the DB diet fed mice.
Clinically, the failure of the aortic valve function in severe AS correlates with thickened, fibrotic, calcified and inflamed aortic valve leaflets [2]. We thus assessed and quantified these parameters in our model by histology. As this is a hyperlipidemic model, we also determined the extent of the atherosclerotic lesion in the aortic sinus. Thus, we measured the atherosclerotic lesion and the aortic valve leaflets areas and morphometrically quantified the leaflet thickness and the atherosclerotic lesion size separately. To our knowledge this is the first quantification of leaflet thickness in the LDLr−/−ApoB100/100 model of AS in response to a diabetogenic diet. As predicted the DB diet induced thickening of the leaflets in DB LDLr−/−ApoB100/100 fed mice when compared to NC fed. These results confirm and expand observations by Drolet et al. that showed that a high fat diet induced leaflet thickening in wild type mice [31]. We also performed a similar quantification on sections stained for mineral by using Osteosense 680 EX, a fluorescent in vivo bisphosphonate imaging agent that binds calcium. This staining modality was chosen for its the low background and the fluorescent properties as Alizarin Red and Von Kossa stains often results in high background or a black color that can be confused with the population of melanocytes found in rodent heart valves [37]. Osteosense quantifications confirmed the hypothesis that the DB diet promoted mineralization of the leaflets thus correlating with the severity of AS. Further, as we have previously shown in the LDLr−/− model of atherosclerosis, the DB diet also induced larger and more mineralized atherosclerotic lesions. These results differ slightly from the LDLr−/−ApoB100/100 IGF II model where the atherosclerotic lesions were found to mineralize more than controls but there was no significant increase in lesion size [36, 38].
Hyperlipedimia in familial hypercholesterolemia patients has been shown to correlate with premature valvulopathy of the aortic valve and atherosclerosis of the aorta [39]. Further, other studies show that AS patients have significantly higher rates of aortic atherosclerosis [16, 18]. These data indicate that the coexistence of CAVD and atherosclerosis in the lipid-driven inflammatory LDLr−/−ApoB100/100 diabetic model mimics the pathological presentation of the disease in at least a subset of AS patients and may aid researchers in determining the mechanisms differentially regulating the two diseases. However, this model may not simulate the human CAVD that develops in the absence of diabetes and hyperlipidemia, for example, in valvulopathy associated with rheumatic fever or bicuspid aortic valve. While sharing some common pathological features like inflammation, fibrosis and calcification, these diseases may have very different etiology and pathobiology, thus necessitating new experimental model development.
We also performed detailed histological studies to address collagen, proteoglycan, calcium deposition and inflammation in DB fed mice. The leaflets were rich in collagen and proteoglycan while the hinge areas were mostly composed of dense collagen as shown by trichrome staining (figure 8B). The presence of chondrocyte cells and calcium deposits in the hinge areas and valve leaflets support the notion of VICs undergoing osteochondrogenic differentiation and active mineral deposition processes rather than passive mineralization. These features mimic some of the histological characteristic of diseased human cusps, however we did not observe neoangiogenesis, very large calcified nodules, and bone metaplasia. This is probably due to the differences in the tissue between the two species. Indeed, human valve like human arteries are much larger than rodent’s and necessitate tissue vascularization as diffusion from the surrounding blood is not sufficient for tissue survival. Further, the lack of large nodules and bone metaplasia may mimic an earlier stage of human CAVD. Nonetheless, as discussed above the function of the aortic valve in these mice is compromised despite the lack of large calcifying nodules protruding the lumen of the aorta. We also found abundant macrophages present in the leaflets that mostly accumulate on the aortic side of the valve of the DB fed mice. These finding suggest that inflammation may be one of the drivers of the fibrocalcific process in valve leaflets in LDLr−/−ApoB100/100 fed the DB diet. Indeed, it has been proposed that inflammation and activated macrophages may be releasing pro-calcification factors promoting the valve interstitial cell to become osteogenic, to deposit calcium and eventually to mineralize [40]. Further, inflammation and macrophage accumulation are well known components of diabetic atherosclerosis and vascular calcification [41]. The contribution of inflammatory macrophages to the induction of leaflet thickening and increased mineralization in this diabetic model warrants further studies.
As new drug targets are needed, the precise mechanisms of diabetes as an accelerator of valvular and vascular calcification are currently under intense investigation. In diabetic accelerated atherosclerosis the interaction of advanced glycation end-products (AGEs), a non-enzymatic glycosylation of proteins and lipids under hyperglycemia, with RAGE, a multiligand receptor that interacts with AGEs and other ligands has been shown to contribute to the exacerbation of the disease. Further, AGEs have been found to induce osteogenic differentiation in vascular smooth muscle cells [42]. Additional studies also indicate that high level of glucose stimulate the mineralization capacity of vascular smooth muscle cells and their expression of osteogenic genes [43–45]. Here for the first time, we show that VICs in vitro respond directly to elevated glucose with enhanced mineralization. These results may suggest a new mechanism behind the diabetes-dependent acceleration of valve mineralization.
In summary, with these studies we have established a new diet-induced model of diabetic CAVD and AS with functional and several structural features mimicking the human disease. Patients with T2DM not only have a heightened risk for CAVD but also a significantly increased “new” incidence compared to those without and the level of aortic valve calcification at diagnosis is highly associated with rate of AS progression [7–9]. Thus, as LDLr−/−ApoB100/100 DB fed mice show acceleration of the CAVD and AS compared to NC fed mice the model developed here provides a new tool to address the molecular mechanisms of diabetic CAVD.
A customized diabetogenic, procalcific diet induced hyperglycemia, hyperlipidemia
Mice on the diabetogenic, procalcific diet had 77% incidence of Aortic Stenosis
Mice on the diabetogenic, procalcific diet had thick and calcified aortic valves
Mice on the diabetogenic, procalcific diet had impaired cardiac function
Elevated glucose enhanced valve interstitial cell matrix calcium deposition
Acknowledgments
This study was supported by a National Institute of Health HL114611, HL081785 and HL62329 R01 grants to Drs. Giachelli, Scatena and Speer. Melissa Jackson was supported by the Dick and Julia McAbee Fellowship, Diabetes Research Center, University of Washington, Seattle, WA.
Footnotes
Publisher's Disclaimer: This is a PDF file of an unedited manuscript that has been accepted for publication. As a service to our customers we are providing this early version of the manuscript. The manuscript will undergo copyediting, typesetting, and review of the resulting proof before it is published in its final citable form. Please note that during the production process errors may be discovered which could affect the content, and all legal disclaimers that apply to the journal pertain.
Author Contributions
Conceived and designed the experiments: MS, MFJ, MYS, CMG. Performed the experiments: MS, MFJ and ES. Analyzed the data: MFJ, MS, MYS, MCW and CMG. Contributed reagents/materials/analysis tools: MS, CMG. Wrote the paper: MS, MYS and CMG.
Conflict of Interest: None
References
- 1.Otto CM, Lind BK, Kitzman DW, Gersh BJ, Siscovick DS. Association of aortic-valve sclerosis with cardiovascular mortality and morbidity in the elderly. N Engl J Med. 1999;341:142–147. doi: 10.1056/NEJM199907153410302. [DOI] [PubMed] [Google Scholar]
- 2.Lindman BR, Clavel MA, Mathieu P, Iung B, Lancellotti P, Otto CM, Pibarot P. Calcific aortic stenosis. Nat Rev Dis Primers. 2016;2:16006. doi: 10.1038/nrdp.2016.6. [DOI] [PMC free article] [PubMed] [Google Scholar]
- 3.Iung B, Baron G, Butchart EG, Delahaye F, Gohlke-Bärwolf C, Levang OW, Tornos P, Vanoverschelde JL, Vermeer F, Boersma E, Ravaud P, Vahanian A. A prospective survey of patients with valvular heart disease in Europe: The Euro Heart Survey on Valvular Heart Disease. Eur Heart J. 2003;24:1231–1243. doi: 10.1016/s0195-668x(03)00201-x. [DOI] [PubMed] [Google Scholar]
- 4.Mozaffarian D, Benjamin EJ, Go AS, Arnett DK, Blaha MJ, Cushman M, de Ferranti S, Després JP, Fullerton HJ, Howard VJ, Huffman MD, Judd SE, Kissela BM, Lackland DT, Lichtman JH, Lisabeth LD, Liu S, Mackey RH, Matchar DB, McGuire DK, Mohler ER, Moy CS, Muntner P, Mussolino ME, Nasir K, Neumar RW, Nichol G, Palaniappan L, Pandey DK, Reeves MJ, Rodriguez CJ, Sorlie PD, Stein J, Towfighi A, Turan TN, Virani SS, Willey JZ, Woo D, Yeh RW, Turner MB, A.H.A.S.C.a.S.S. Subcommittee Heart disease and stroke statistics–2015 update: a report from the American Heart Association. Circulation. 2015;131:e29–322. doi: 10.1161/CIR.0000000000000152. [DOI] [PubMed] [Google Scholar]
- 5.Mozaffarian D, Benjamin EJ, Go AS, Arnett DK, Blaha MJ, Cushman M, Das SR, de Ferranti S, Després JP, Fullerton HJ, Howard VJ, Huffman MD, Isasi CR, Jiménez MC, Judd SE, Kissela BM, Lichtman JH, Lisabeth LD, Liu S, Mackey RH, Magid DJ, McGuire DK, Mohler ER, Moy CS, Muntner P, Mussolino ME, Nasir K, Neumar RW, Nichol G, Palaniappan L, Pandey DK, Reeves MJ, Rodriguez CJ, Rosamond W, Sorlie PD, Stein J, Towfighi A, Turan TN, Virani SS, Woo D, Yeh RW, Turner MB, Members WG, Committee AHAS, Subcommittee SS. Heart Disease and Stroke Statistics-2016 Update: A Report From the American Heart Association. Circulation. 2016;133:e38–360. doi: 10.1161/CIR.0000000000000350. [DOI] [PubMed] [Google Scholar]
- 6.Carabello BA. Introduction to aortic stenosis. Circ Res. 2013;113:179–185. doi: 10.1161/CIRCRESAHA.113.300156. [DOI] [PubMed] [Google Scholar]
- 7.Mazzone T, Chait A, Plutzky J. Cardiovascular disease risk in type 2 diabetes mellitus: insights from mechanistic studies. Lancet. 2008;371:1800–1809. doi: 10.1016/S0140-6736(08)60768-0. [DOI] [PMC free article] [PubMed] [Google Scholar]
- 8.Katz R, Budoff MJ, Takasu J, Shavelle DM, Bertoni A, Blumenthal RS, Ouyang P, Wong ND, O’Brien KD. Relationship of metabolic syndrome with incident aortic valve calcium and aortic valve calcium progression: the Multi-Ethnic Study of Atherosclerosis (MESA) Diabetes. 2009;58:813–819. doi: 10.2337/db08-1515. [DOI] [PMC free article] [PubMed] [Google Scholar]
- 9.Nishimura S, Izumi C, Nishiga M, Amano M, Imamura S, Onishi N, Tamaki Y, Enomoto S, Miyake M, Tamura T, Kondo H, Kaitani K, Nakagawa Y. Predictors of Rapid Progression and Clinical Outcome of Asymptomatic Severe Aortic Stenosis. Circ J. 2016;80:1863–1869. doi: 10.1253/circj.CJ-16-0333. [DOI] [PubMed] [Google Scholar]
- 10.Briand M, Lemieux I, Dumesnil JG, Mathieu P, Cartier A, Després JP, Arsenault M, Couet J, Pibarot P. Metabolic syndrome negatively influences disease progression and prognosis in aortic stenosis. J Am Coll Cardiol. 2006;47:2229–2236. doi: 10.1016/j.jacc.2005.12.073. [DOI] [PubMed] [Google Scholar]
- 11.Mosch J, Gleissner CA, Body S, Aikawa E. Histopathological assessment of calcification and inflammation of calcific aortic valves from patients with and without diabetes mellitus. Histol Histopathol. 2017;32:293–306. doi: 10.14670/HH-11-797. [DOI] [PMC free article] [PubMed] [Google Scholar]
- 12.Rossebø AB, Pedersen TR. Hyperlipidaemia and aortic valve disease. Curr Opin Lipidol. 2004;15:447–451. doi: 10.1097/01.mol.0000137229.00020.fe. [DOI] [PubMed] [Google Scholar]
- 13.Rossebø AB, Pedersen TR, Allen C, Boman K, Chambers J, Egstrup K, Gerdts E, Gohlke-Bärwolf C, Holme I, Kesäniemi VA, Malbecq W, Nienaber C, Ray S, Skjaerpe T, Wachtell K, Willenheimer R. Design and baseline characteristics of the simvastatin and ezetimibe in aortic stenosis (SEAS) study. Am J Cardiol. 2007;99:970–973. doi: 10.1016/j.amjcard.2006.10.064. [DOI] [PubMed] [Google Scholar]
- 14.Rossebø AB, Pedersen TR, Boman K, Brudi P, Chambers JB, Egstrup K, Gerdts E, Gohlke-Bärwolf C, Holme I, Kesäniemi YA, Malbecq W, Nienaber CA, Ray S, Skjaerpe T, Wachtell K, Willenheimer R, S. Investigators Intensive lipid lowering with simvastatin and ezetimibe in aortic stenosis. N Engl J Med. 2008;359:1343–1356. doi: 10.1056/NEJMoa0804602. [DOI] [PubMed] [Google Scholar]
- 15.Teo KK, Corsi DJ, Tam JW, Dumesnil JG, Chan KL. Lipid lowering on progression of mild to moderate aortic stenosis: meta-analysis of the randomized placebo-controlled clinical trials on 2344 patients. Can J Cardiol. 2011;27:800–808. doi: 10.1016/j.cjca.2011.03.012. [DOI] [PubMed] [Google Scholar]
- 16.Agmon Y, Khandheria BK, Meissner I, Sicks JR, O’Fallon WM, Wiebers DO, Whisnant JP, Seward JB, Tajik AJ. Aortic valve sclerosis and aortic atherosclerosis: different manifestations of the same disease? Insights from a population-based study. J Am Coll Cardiol. 2001;38:827–834. doi: 10.1016/s0735-1097(01)01422-x. [DOI] [PubMed] [Google Scholar]
- 17.van Rosendael PJ, Kamperidis V, Kong WK, van Rosendael AR, Marsan NA, Bax JJ, Delgado V. Comparison of Quantity of Calcific Deposits by Multidetector Computed Tomography in the Aortic Valve and Coronary Arteries. Am J Cardiol. 2016;118:1533–1538. doi: 10.1016/j.amjcard.2016.08.021. [DOI] [PubMed] [Google Scholar]
- 18.Weisenberg D, Sahar Y, Sahar G, Shapira Y, Iakobishvili Z, Vidne BA, Sagie A. Atherosclerosis of the aorta is common in patients with severe aortic stenosis: an intraoperative transesophageal echocardiographic study. J Thorac Cardiovasc Surg. 2005;130:29–32. doi: 10.1016/j.jtcvs.2004.11.040. [DOI] [PubMed] [Google Scholar]
- 19.Freeman RV, Otto CM. Spectrum of calcific aortic valve disease: pathogenesis, disease progression, and treatment strategies. Circulation. 2005;111:3316–3326. doi: 10.1161/CIRCULATIONAHA.104.486738. [DOI] [PubMed] [Google Scholar]
- 20.Galli D, Manuguerra R, Monaco R, Manotti L, Goldoni M, Becchi G, Carubbi C, Vignali G, Cucurachi N, Gherli T, Nicolini F, Lorusso R, Vitale M, Corradi D. Understanding the structural features of symptomatic calcific aortic valve stenosis: A broad-spectrum clinico-pathologic study in 236 consecutive surgical cases. Int J Cardiol. 2017;228:364–374. doi: 10.1016/j.ijcard.2016.11.180. [DOI] [PubMed] [Google Scholar]
- 21.Nguyen N, Naik V, Speer MY. Diabetes mellitus accelerates cartilaginous metaplasia and calcification in atherosclerotic vessels of LDLr mutant mice. Cardiovasc Pathol. 2012 doi: 10.1016/j.carpath.2012.06.007. [DOI] [PMC free article] [PubMed] [Google Scholar]
- 22.Naik V, Leaf EM, Hu JH, Yang HY, Nguyen NB, Giachelli CM, Speer MY. Sources of Cells that Contribute to Atherosclerotic Intimal Calcification: an In Vivo Genetic Fate Mapping Study. Cardiovasc Res. 2012 doi: 10.1093/cvr/cvs126. [DOI] [PMC free article] [PubMed] [Google Scholar]
- 23.Baumgartner H, Hung J, Bermejo J, Chambers JB, Evangelista A, Griffin BP, Iung B, Otto CM, Pellikka PA, Quiñones M, A.S.o. Echocardiography, E.A.o. Echocardiography Echocardiographic assessment of valve stenosis: EAE/ASE recommendations for clinical practice. J Am Soc Echocardiogr. 2009;22:1–23. doi: 10.1016/j.echo.2008.11.029. quiz 101–102. [DOI] [PubMed] [Google Scholar]
- 24.Baumgartner H, Hung J, Bermejo J, Chambers JB, Edvardsen T, Goldstein S, Lancellotti P, LeFevre M, Miller F, Otto CM. Recommendations on the Echocardiographic Assessment of Aortic Valve Stenosis: A Focused Update from the European Association of Cardiovascular Imaging and the American Society of Echocardiography. J Am Soc Echocardiogr. 2017;30:372–392. doi: 10.1016/j.echo.2017.02.009. [DOI] [PubMed] [Google Scholar]
- 25.Pai A, Leaf EM, El-Abbadi M, Giachelli CM. Elastin degradation and vascular smooth muscle cell phenotype change precede cell loss and arterial medial calcification in a uremic mouse model of chronic kidney disease. Am J Pathol. 2011;178:764–773. doi: 10.1016/j.ajpath.2010.10.006. [DOI] [PMC free article] [PubMed] [Google Scholar]
- 26.Callegari A, Coons M, Ricks JL, Yang HL, Gross TS, Huber P, Rosenfeld ME, Scatena M. Bone Marrow- or Vessel Wall-Derived Osteoprotegerin Is Sufficient to Reduce Atherosclerotic Lesion Size and Vascular Calcification. Arterioscler Thromb Vasc Biol. 2013 doi: 10.1161/ATVBAHA.113.301755. [DOI] [PubMed] [Google Scholar]
- 27.Speer MY, Yang HY, Brabb T, Leaf E, Look A, Lin WL, Frutkin A, Dichek D, Giachelli CM. Smooth muscle cells give rise to osteochondrogenic precursors and chondrocytes in calcifying arteries. Circ Res. 2009;104:733–741. doi: 10.1161/CIRCRESAHA.108.183053. [DOI] [PMC free article] [PubMed] [Google Scholar]
- 28.Steitz SA, Speer MY, Curinga G, Yang HY, Haynes P, Aebersold R, Schinke T, Karsenty G, Giachelli CM. Smooth muscle cell phenotypic transition associated with calcification: upregulation of Cbfa1 and downregulation of smooth muscle lineage markers. Circ Res. 2001;89:1147–1154. doi: 10.1161/hh2401.101070. [DOI] [PubMed] [Google Scholar]
- 29.Wiester LM, Giachelli CM. Expression and function of the integrin alpha9beta1 in bovine aortic valve interstitial cells. J Heart Valve Dis. 2003;12:605–616. [PubMed] [Google Scholar]
- 30.Speer MY, Chien YC, Quan M, Yang HY, Vali H, McKee MD, Giachelli CM. Smooth muscle cells deficient in osteopontin have enhanced susceptibility to calcification in vitro. Cardiovasc Res. 2005;66:324–333. doi: 10.1016/j.cardiores.2005.01.023. [DOI] [PubMed] [Google Scholar]
- 31.Drolet MC, Roussel E, Deshaies Y, Couet J, Arsenault M. A high fat/high carbohydrate diet induces aortic valve disease in C57BL/6J mice. J Am Coll Cardiol. 2006;47:850–855. doi: 10.1016/j.jacc.2005.09.049. [DOI] [PubMed] [Google Scholar]
- 32.Otto CM, Prendergast B. Aortic-valve stenosis–from patients at risk to severe valve obstruction. N Engl J Med. 2014;371:744–756. doi: 10.1056/NEJMra1313875. [DOI] [PubMed] [Google Scholar]
- 33.Miller JD, Weiss RM, Serrano KM, Brooks RM, Berry CJ, Zimmerman K, Young SG, Heistad DD. Lowering plasma cholesterol levels halts progression of aortic valve disease in mice. Circulation. 2009;119:2693–2701. doi: 10.1161/CIRCULATIONAHA.108.834614. [DOI] [PMC free article] [PubMed] [Google Scholar]
- 34.Miller JD, Weiss RM, Serrano KM, Castaneda LE, Brooks RM, Zimmerman K, Heistad DD. Evidence for active regulation of pro-osteogenic signaling in advanced aortic valve disease. Arterioscler Thromb Vasc Biol. 2010;30:2482–2486. doi: 10.1161/ATVBAHA.110.211029. [DOI] [PMC free article] [PubMed] [Google Scholar]
- 35.Weiss RM, Ohashi M, Miller JD, Young SG, Heistad DD. Calcific aortic valve stenosis in old hypercholesterolemic mice. Circulation. 2006;114:2065–2069. doi: 10.1161/CIRCULATIONAHA.106.634139. [DOI] [PubMed] [Google Scholar]
- 36.Le Quang K, Bouchareb R, Lachance D, Laplante MA, El Husseini D, Boulanger MC, Fournier D, Fang XP, Avramoglu RK, Pibarot P, Deshaies Y, Sweeney G, Mathieu P, Marette A. Early development of calcific aortic valve disease and left ventricular hypertrophy in a mouse model of combined dyslipidemia and type 2 diabetes mellitus. Arterioscler Thromb Vasc Biol. 2014;34:2283–2291. doi: 10.1161/ATVBAHA.114.304205. [DOI] [PubMed] [Google Scholar]
- 37.Mjaatvedt CH, Kern CB, Norris RA, Fairey S, Cave CL. Normal distribution of melanocytes in the mouse heart. Anat Rec A Discov Mol Cell Evol Biol. 2005;285:748–757. doi: 10.1002/ar.a.20210. [DOI] [PubMed] [Google Scholar]
- 38.Heinonen SE, Merentie M, Hedman M, Mäkinen PI, Loponen E, Kholová I, Bosch F, Laakso M, Ylä-Herttuala S. Left ventricular dysfunction with reduced functional cardiac reserve in diabetic and non-diabetic LDL-receptor deficient apolipoprotein B100-only mice. Cardiovasc Diabetol. 2011;10:59. doi: 10.1186/1475-2840-10-59. [DOI] [PMC free article] [PubMed] [Google Scholar]
- 39.Fahed AC, Shibbani K, Andary RR, Arabi MT, Habib RH, Nguyen DD, Haddad FF, Moubarak E, Nemer G, Azar ST, Bitar FF. Premature Valvular Heart Disease in Homozygous Familial Hypercholesterolemia. Cholesterol. 2017;2017:3685265. doi: 10.1155/2017/3685265. [DOI] [PMC free article] [PubMed] [Google Scholar]
- 40.Hjortnaes J, Butcher J, Figueiredo JL, Riccio M, Kohler RH, Kozloff KM, Weissleder R, Aikawa E. Arterial and aortic valve calcification inversely correlates with osteoporotic bone remodelling: a role for inflammation. Eur Heart J. 2010;31:1975–1984. doi: 10.1093/eurheartj/ehq237. [DOI] [PMC free article] [PubMed] [Google Scholar]
- 41.Yahagi K, Kolodgie FD, Lutter C, Mori H, Romero ME, Finn AV, Virmani R. Pathology of Human Coronary and Carotid Artery Atherosclerosis and Vascular Calcification in Diabetes Mellitus. Arterioscler Thromb Vasc Biol. 2017;37:191–204. doi: 10.1161/ATVBAHA.116.306256. [DOI] [PMC free article] [PubMed] [Google Scholar]
- 42.Suga T, Iso T, Shimizu T, Tanaka T, Yamagishi S, Takeuchi M, Imaizumi T, Kurabayashi M. Activation of receptor for advanced glycation end products induces osteogenic differentiation of vascular smooth muscle cells. J Atheroscler Thromb. 2011;18:670–683. doi: 10.5551/jat.7120. [DOI] [PubMed] [Google Scholar]
- 43.Chen NX, Duan D, O’Neill KD, Moe SM. High glucose increases the expression of Cbfa1 and BMP-2 and enhances the calcification of vascular smooth muscle cells. Nephrol Dial Transplant. 2006;21:3435–3442. doi: 10.1093/ndt/gfl429. [DOI] [PubMed] [Google Scholar]
- 44.Liu Y, Shanahan CM. Signalling pathways and vascular calcification. Front Biosci. 2011;16:1302–1314. doi: 10.2741/3790. [DOI] [PubMed] [Google Scholar]
- 45.Zhou Z, Subramanian P, Sevilmis G, Globke B, Soehnlein O, Karshovska E, Megens R, Heyll K, Chun J, Saulnier-Blache JS, Reinholz M, van Zandvoort M, Weber C, Schober A. Lipoprotein-derived lysophosphatidic acid promotes atherosclerosis by releasing CXCL1 from the endothelium. Cell Metab. 2011;13:592–600. doi: 10.1016/j.cmet.2011.02.016. [DOI] [PubMed] [Google Scholar]


