Abstract
In cultured Bright Yellow-2 (BY-2) tobacco (Nicotiana tabacum) cells, the depletion of auxin (2,4-dichlorophenoxyacetic acid) in the culture medium induces the accumulation of starch. This is accelerated by the addition of cytokinin (benzyladenine). Light and electron microscopic observations revealed that this amyloplast formation involves drastic changes in plastid morphology. The effects of auxin and cytokinin on amyloplast development were investigated by adding auxin or cytokinin to cells grown in a hormone-free culture. Auxin repressed amyloplast development, whereas cytokinin accelerated starch accumulation regardless of the timing of hormone addition. RNA gel-blot analysis revealed that the accumulation of the ADP-glucose pyrophosphorylase small subunit gene (AgpS), granule-bound starch synthase, and starch branching enzyme transcripts were also affected by hormonal conditions. High levels of AgpS, granule-bound starch synthase, and starch branching enzyme transcripts accumulated in amyloplast-developing cells grown in auxin-depleted conditions. Furthermore, the addition of auxin to the cells cultured in hormone-free medium reduced the level of AgpS transcripts, whereas the addition of cytokinin increased it, irrespective of the timing of hormone addition. These results suggest that auxin and cytokinin exert opposite effects on amyloplast development by regulating the expression of the genes required for starch biosynthesis.
Amyloplasts are starch-containing, non-green plastids found in differentiated plant cells, including root caps and storage tissues such as cotyledons, endosperm, and tubers. They play an important role in plant carbon metabolism (Kirk, 1978). Amyloplasts are also important for animals, since the starch they contain is a major source of carbohydrates. Studies have led to many discoveries about the enzymes involved in starch synthesis, such as ADP-Glc pyrophosphorylase, granule-bound starch synthase (GBSS), and starch branching enzyme (SBE), as well as the molecular architecture of the starch granule (for review, see Martin and Smith, 1995; Ball et al., 1996; Smith et al., 1997). However, the mechanisms that regulate amyloplast development remain unknown.
Since the discovery that auxin and cytokinin are required to induce cell division and growth (Miller et al., 1955), many studies have demonstrated that the two phytohormones can interact synergistically or antagonistically. They interact synergistically to stimulate callus cell division and antagonistically to control lateral bud formation (for review, see Coenen and Lomax, 1997). Auxin and cytokinin also act antagonistically during tuber formation in some plant species (e.g. potato; Matthysse and Scott, 1984). However, the complexity of these highly organized tissues makes it difficult to examine the molecular mechanisms of the hormonal action controlling amyloplast development.
To investigate the relationships between amyloplast differentiation and phytohormones, we used a system for inducing amyloplast formation in cultured Bright Yellow-2 (BY-2) tobacco (Nicotiana tabacum) cells (Sakai et al., 1992). Conventionally, the BY-2 tobacco cell line is grown in a liquid culture medium containing auxin (2,4-D), and is characterized by its homogeneity and high growth rate (Nagata et al., 1992). When BY-2 cells in the stationary phase are transferred to an auxin-depleted culture medium and then supplied with cytokinin (BA), amyloplast formation is synchronously induced within 2 d (Sakai et al., 1992). In this system, amyloplast formation is primarily triggered by the depletion of auxin and is further facilitated by the addition of cytokinin (Sakai et al., 1996). Although amyloplast formation in BY-2 cells is always accompanied by reduced cell proliferation, BY-2 cells never differentiate amyloplasts in the presence of auxin, even if cell proliferation is arrested (Sakai et al., 1996). This means that the accumulation of starch is not the result of the cessation of cell division, but appears to be more directly controlled by hormonal conditions (Sakai et al., 1996). Experiments with transcription/translation inhibitors have revealed that amyloplast formation in BY-2 cells requires nuclear gene expression (Sakai et al., 1997).
The main aim of this study was to elucidate in more detail the relationships between phytohormones, amyloplast formation, and gene expression. We examined the effects of auxin (2,4-D) and cytokinin (BA) on amyloplast formation, and the accumulation of the ADP-Glc pyrophosphorylase small subunit mRNA (AgpS), GBSS, and SBE, which encode proteins indispensable for starch synthesis, by adding either of the two phytohormones to hormone-free cultures.
The results showed that auxin represses and cytokinin enhances the accumulation of starch and AgpS, GBSS, and SBE transcripts. Moreover, irrespective of the timing of hormone addition, auxin decreases and cytokinin increases the accumulation of starch and the AgpS transcript. This suggests that the opposing effects of the two phytohormones on amyloplast formation may result from regulating the amount of transcripts encoding the enzymes necessary for starch biosynthesis in opposite ways.
MATERIALS AND METHODS
Cell Culture
Bright Yellow-2 (BY-2) tobacco (Nicotiana tabacum) cell-suspension cultures were grown in modified Murashige and Skoog medium enriched with 0.2 mg/L 2,4-D (referred to as D medium hereafter), and were maintained as described by Nagata et al. (1992). To assess the hormonal effects on BY-2 cells, 5 mL of a suspension of stationary-phase cells grown for 8 d in D medium were transferred to 95 mL of fresh medium containing one of three hormone treatments: D medium (0.2 mg/L 2,4-D), F medium (modified, hormone-free Murashige and Skoog medium), or B medium (F medium supplemented with 1 mg/L BA). Cultures were kept on a rotary shaker at 26°C. To determine the effects of auxin or cytokinin, concentrated 2,4-D solution (100 mg/L, pH 5.8) or BA solution (1 g/L, pH 5.8) was added to F medium cultures to give final concentrations of 0.2 and 1 mg/L, respectively.
Cell Counts and Measurement of Starch Content
The number of cells per milliliter of culture was counted under a microscope. Cells derived from 5 mL of culture were collected and treated with a solution of 0.4 m mannitol, 1% (w/v) cellulase YC, and 0.1% (w/v) pectolyase Y23, pH 5.5, for 90 min at 30°C to make protoplasts. The protoplasts were lysed by the addition of SDS to a final concentration of 1% (w/v), and the starch granules were precipitated by centrifugation at 18,500g for 15 min at room temperature, washed with 80% (v/v) ethanol at 50°C, suspended in 0.15 mL of water, and boiled for 15 min. After the addition of 0.25 mL of 60% perchloric acid (Wako Pure Chemical Industries, Osaka), the solution was shaken for 15 min, diluted by adding 0.6 mL of water, and centrifuged at 18,500g for 15 min at room temperature. The supernatant was quantified by the phenol-sulfuric acid method (Dubois et al., 1956).
Microscopic Observations and Quantification of DNA in Cell Nuclei
BY-2 cells grown under various hormonal conditions were fixed by adding 37% (w/v) formaldehyde to the culture medium to give a final concentration of 2% (w/v). The fixed cell suspension was placed on a glass slide and mixed with an equal volume of a solution of 1 μg/mL 4′,6-diamidino-2-phenylindole (DAPI) in a buffer of 20 mm Tris-HCl (pH 7.6), 0.5 mm EDTA, 1.2 mm spermidine, 7 mm 2-mercaptoethanol, and 1.4 mm PMSF. The intensities of the fluorescence of cell nuclei stained with DAPI were quantified directly using a video-intensified photon-counting microscope system (Hamamatsu Photonics, Hamamatsu, Japan) connected to a fluorescence microscope (model BHS-RFK, Olympus, Tokyo) as described in Kuroiwa et al. (1986).
KI-I solution (1.5 g of KI, and 0.5 g of I2 dissolved in 30 mL of distilled water) was used to stain the starch granules in the BY-2 cells. The cell suspension was mixed with KI-I solution and observed under a microscope immediately after staining. For electron microscopic observations, BY-2 cells were collected by centrifugation and pre-fixed in 1% (w/v) glutaraldehyde for 2 h on ice. The pre-fixed cells were then transferred to 1% (w/v) OsO4 dissolved in 20 mm sodium cacodylate (pH 7.2) and fixed for 12 h at 4°C. Fixed cells were dehydrated by a series of 30%, 50%, 70%, 90%, 99%, and 100% ethanol incubations at room temperature for 20 min each. The cells were then infiltrated using an ethanol:propyleneoxide infiltration series (75%:25%, 50%:50%, 25%:75%, and twice in 0%:100%, for 20 min each). Then the cells were gradually infiltrated with Spurr's resin and a propyleneoxide infiltration series, placed in new Spurr's resin, and then polymerized for 72 h at 70°C. The sections were cut with a diamond knife, stained with uranyl acetate and lead acetate, and examined with an electron microscope (JEM-1200EX, JEOL, Tokyo).
RNA Isolation
Cells were collected by centrifugation, frozen in liquid nitrogen, and stored at −80°C. Roughly 1 mL of frozen, pelleted cells was ground to powder in liquid nitrogen and homogenized in 5 mL of prewarmed extraction buffer (300 mm NaCl, 50 mm Tris-HCl, pH 7.6, 100 mm EDTA, 2% [w/v] Sarkosyl, and 4% [w/v] SDS) at 65°C. Following extraction with phenol:chloroform:isoamyl alcohol (25:24:1 v/v) and chloroform:isoamyl alcohol (24:1 v/v), the nucleic acids were precipitated by the addition of an equal volume of 2-propanol and dissolved in 0.9 mL of sterile water. Finally, 0.3 mL of 10 m LiCl was added to precipitate the RNA. After incubation at 4°C for 2 h, the RNA was collected by centrifugation at 18,500g for 15 min.
Cloning of the cDNAs for AgpS, GBSS, and SBE
Tobacco cDNAs for AgpS, GBSS, and SBE were amplified by PCR in the following way. The respective sequences of the upstream and downstream degenerate oligonucleotide primers, 5′-TGCC(A/T)T(A/T)(C/T)AT(A/C/T)GC(A/C/T)AGCATGGG-3′ and 5′-GC(A/C/T)GC(C/T)TCTTG(A/C/G/T)AC(A/G)TTGTC-3′ for AgpS, 5′-GC(C/T)AA(C/T)GA(C/T)TGGCAC(A/T)C(A/T)GCT-3′ and5′-CAGT(A/G)TC(A/G)AC(A/G)AG(C/G)CC(A/G)CCAG-3′for GBSS, and 5′-GA(C/T)GG(A/G)TT(C/T)(A/C)GATT(C/T)GA(C/T)GG-3′ and 5′-GGG(A/G)AA(A/G)TC(A/G)ATCCA(C/T)C(A/C/T)GG-3′ for SBE, were based on conserved amino acid regions of AgpS, GBSS, and SBE proteins of various plants, respectively. First-strand cDNA and PCR amplification was accomplished using an RNA PCR kit version 2.1 (Takara Shuzo, Ohtsu, Japan) and a DNA thermal cycler (Takara Shuzo) using 1 μg of total RNA isolated from 36-h-old cells cultured in F medium as the template.
For PCR amplification, the DNA was denatured at 94°C for 2 min in the first cycle, and then for 1 min in subsequent cycles. Primer annealing and extension reactions were carried out at 48°C (AgpS), 55°C (GBSS and SBE), or 72°C for 1 min each, respectively. After 35 to 40 cycles, PCR products for AgpS (about 600 bp), GBSS (about 850 bp), and SBE (about 600 bp) were subcloned into pCR-Script Amp SK+ (Stratagene, La Jolla, CA) or pT7-Blue (Novagen, Madison, WI) according to the manufacturer's instructions. The PCR fragment was then sequenced as described in Matsunaga et al. (1996). The database was searched for similar nucleotide sequences using the BLAST algorithm. The amino acid sequence of the 601-bp cDNA fragment for AgpS had significant identity with known AgpS, including potato (97%) and tomato (96%) amino acid sequences. The deduced amino acid sequence of the 844-bp cDNA fragment for GBSS had significant identity with known GBSSs, including those from potato (93%) and snapdragon (84%). Finally, the deduced amino acid sequence of the 603-bp cDNA fragment for SBE had significant identity with known SBE, including those of potato (96%) and cassava (84%). Therefore, we called these fragments tobacco AgpS cDNA (accession no. AB018190), GBSS cDNA (accession no. AB028026), and SBE cDNA (accession no. AB028067), respectively, and used them as probes in further analyses.
RNA Gel-Blot Analysis
RNA was denatured with glyoxal and subjected to RNA gel electrophoresis (Sambrook et al., 1989). Afterward, the RNA was transferred to a nylon membrane (Biodyne B, Pall Biosupport Division, Port Washington, NY). The cloned DNA fragments containing portions of AgpS from tobacco, cytoplasmic rRNA genes from rice (Suzuki et al., 1992), and elongation factor 1α from tobacco (which was kindly provided by Dr. Takahashi, University of Tokyo) were used as probes to detect their transcripts. The blots were washed twice in 2× SSC (20× SSC = 3 m NaCl and 300 mm trisodium citrate), 0.1% (w/v) SDS for 15 min at room temperature, once in 1× SSC, 0.1% (w/v) SDS for 15 min at 65°C, and once in 0.1× SSC, 0.1% SDS (w/v) for 15 min at 65°C. Autoradiography was performed at −80°C using X-Omat film (Kodak, Rochester, NY) with an intensifying filter. The density of the hybridization signals on x-ray film was quantified using the Lane analyzer program (Atto, Tokyo).
RESULTS
Effects of Hormonal Conditions on Amyloplast Formation in BY-2 Cells
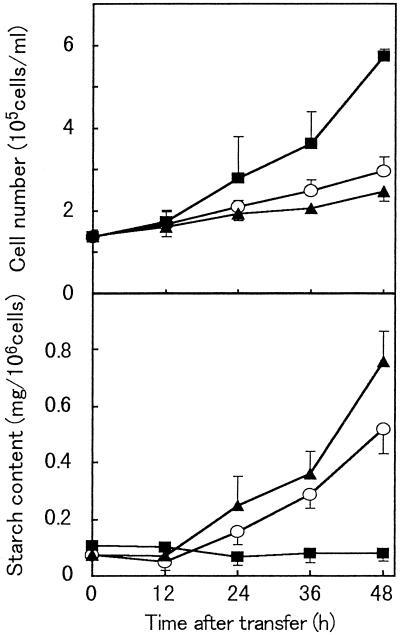
BY-2 cells were cultured in D medium, in which they started to proliferate actively within 24 h, but their starch content remained low (Fig. 1). In contrast, when BY-2 cells in the stationary phase were transferred into hormone-free medium (F medium), they began to accumulate starch within 24 h of the transfer, but the cell proliferation rate was reduced. When BY-2 cells were grown in B medium, an accumulation of starch and a reduction in the cell proliferation rate were also observed. Although the time course for starch accumulation was similar in F and B media, starch accumulation was further accelerated and cell proliferation was slightly lowered in B medium compared with F medium. To determine at what phase of the cell cycle amyloplast differentiation occurs in F and B media, we measured the DNA content of a DAPI-stained BY-2 cell nucleus using a video-intensified photon-counting microscope system.
Figure 1.
Effect of hormonal conditions on BY-2 cells. Changes in cell number (top), and starch content per cell (bottom) during culture in D medium (▪), F medium (○), and B medium (▴) are shown. Data are the means of three independent experiments. Vertical bars represent the se.
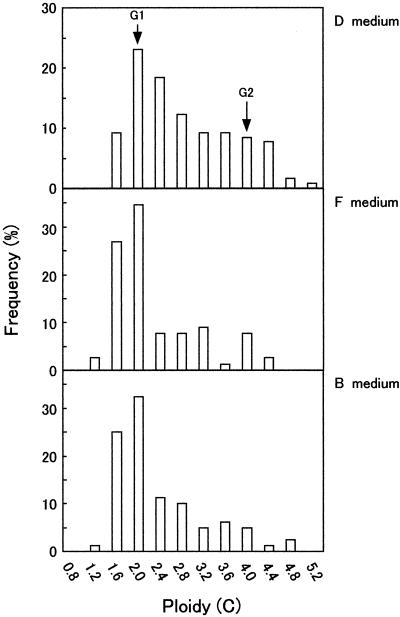
Figure 2 shows the distribution of the fluorescence intensity in each cell nucleus in the DAPI-stained BY-2 cells cultured for 48 h. The cells were exposed to various hormonal conditions and the values are expressed as C values, where the intensity of florescence emitted from the prophase cell nucleus was defined as 4C. When BY-2 cells were grown in D medium, cells in the S phase (C-value between 2C and 4C) or the G2 phase (C-value of 4C) were more frequently observed, as compared with cells grown in the absence of auxin, whether cytokinin was added or not. Also, a lower mitotic index was observed among cells cultured in both F and B media than in cells cultured in D medium (2.1% in F medium or 1.5% in B medium versus 9.4% in D medium). These data are consistent with the fact that the absence of auxin strongly reduces cell proliferation, as shown in Figure 1. Moreover, striking peaks of frequency around the 2C-ploidy state observed in both auxin-depleted cultures revealed that cells in the G1 phase were accumulated under these conditions.
Figure 2.
Frequency histogram of the fluorescence intensities of cell nuclei measured using a video-intensified photon-counting microscope system and expressed in C values, where the fluorescence intensity emitted from prophase cell nuclei was defined as 4C. BY-2 cells were cultured in D, F, or B medium for 48 h and harvested. After fixation, cell nuclei were stained with DAPI and their fluorescence intensities were quantified. Arrows indicate peaks corresponding to C values of the G1 and G2 phase. Note that these histograms do not contain data for M-phase nuclei. Mitotic indices of 9.4%, 2.1%, and 1.5% were observed in nuclei cultured in D, F, and B medium, respectively.
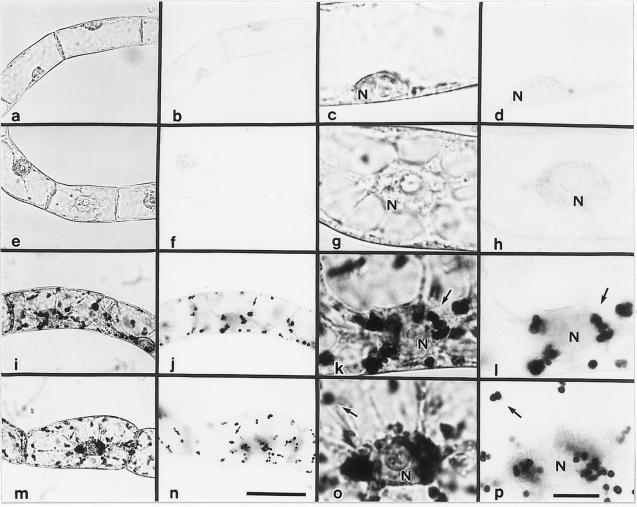
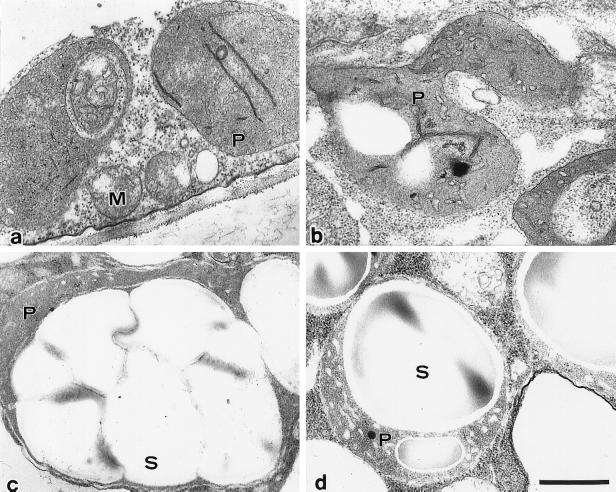
Light and electron microscopic observations (Figs. 3 and 4) revealed that the accumulation of starch in auxin-depleted medium (F and B media) was accompanied by a drastic change in plastid morphology, including enlargement of starch granules. Stationary-phase cells contained undifferentiated, leucoplast-like plastids that rarely contained starch grains. When the cells were grown for 48 h in D medium, the leucoplast-like plastids were converted into actively proliferating proplastids that contained few starch granules. In cells grown in the absence of auxin (F and B media), within 48 h the leucoplast-like plastids changed into amyloplasts, each of which contained several large starch granules.
Figure 3.
Photomicrographs of amyloplasts in BY-2 cultured cells stained with iodine. Stationary-phase (a–d), 2-d-old cells cultured in D medium (e–h), F medium (i–l), or B medium (m–p) are shown. a, c, e, g, i, k, m, and o, Cells observed with the condenser diaphragm closed; b, d, f, h, j, l, and p, cells observed with the condenser diaphragm open. a and b, c and d, e and f, g and h, i and j, k and l, m and n, and o and p show the same fields. a, b, e, f, i, j, m, and n and c, d, g, h, k, l, o, and p are at the same magnification. Arrows indicate starch granules. N, Cell nucleus. The bars in n and p represent 50 and 10 μm, respectively.
Figure 4.
Electron micrographs of leucoplast-like plastids in stationary-phase cells (a), proplastids observed in cells cultured in D medium for 48 h (b), and differentiated amyloplasts in 2-d-old cells cultured in F medium (c) and B medium (d), which are filled with starch grains. M, Mitochondrion; P, plastid; S, starch granule. Scale bar represents 500 nm.
The Effects of the Addition of Auxin and Cytokinin to BY-2 Cells Grown in Hormone-Free Medium at Different Times during Amyloplast Formation on Cell Multiplication and Starch Accumulation
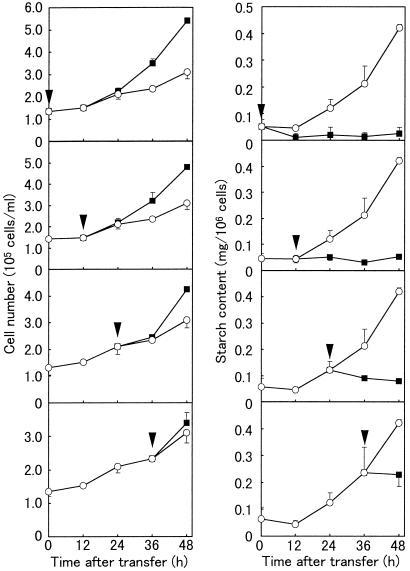
To examine the effects of auxin on amyloplast differentiation in more detail, auxin (2,4-D) was added at a final concentration of 0.2 mg/L at 12-h intervals during amyloplast formation in F medium (Fig. 5). BY-2 cells stopped accumulating starch within 12 h of the addition of auxin, irrespective of the timing of the addition. When auxin was added before the cells started to accumulate starch (within 12 h of their transfer to F medium), starch accumulation was never observed. The addition of auxin also resulted in the resumption of cell proliferation, but starch accumulation ceased before the cells began to proliferate actively, indicating that the reduction in starch accumulation was not the result of cell division. The starch content further decreased as cell proliferation proceeded. These results indicate that amyloplast formation in BY-2 cells is a reversible process that requires the continuous absence of auxin.
Figure 5.
Effects of auxin application on growth and starch accumulation of BY-2 cells grown in hormone-free medium. The left panels show the change in cell number, while the right panels show the change in starch content during culture. Arrowheads indicate the time of auxin addition (final concentrations of 0.2 mg/L). Data are the means from three independent experiments. Vertical bars represent the se. ○, Control cells (without auxin addition); ▪, sample cells (auxin added during culture). BY-2 cells ceased to accumulate starch and started cell division whenever auxin was added to the culture.
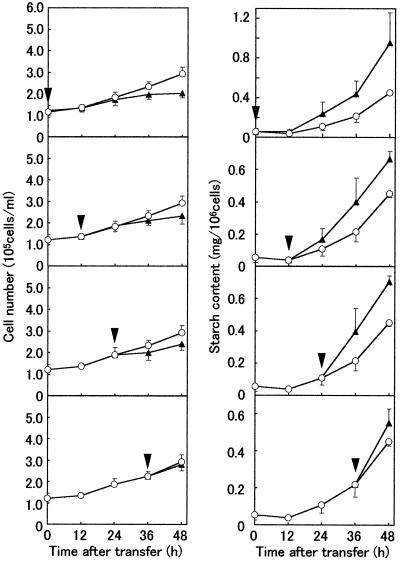
The effects of cytokinin on cell multiplication and starch content were determined by adding BA at a final concentration of 1 mg/L at 12-h intervals during amyloplast formation in F medium (Fig. 6). The addition of cytokinin enhanced starch accumulation and slightly decreased the cell multiplication rate. These effects were apparent within 12 h of the addition of cytokinin.
Figure 6.
Effects of cytokinin application on growth and starch accumulation of BY-2 cells grown in hormone-free medium. The left panels show the change in cell number, while the right panels show the change in starch content during culture. Arrowheads indicate the time of cytokinin addition (final concentration of 1 mg/L). The values are the means from three independent experiments. The vertical bars represent the se. ○, Control cells (without cytokinin addition); ▪, sample cells (cytokinin added during amyloplast development). Starch accumulation was accelerated and cell proliferation was repressed in response to cytokinin addition.
Effects of Auxin and Cytokinin on the Expression of the Starch Synthetic Genes
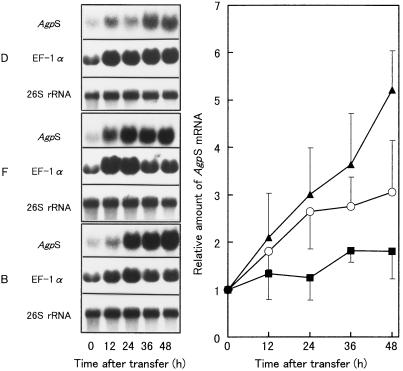
To examine the molecular basis for the hormonal control of amyloplast formation in BY-2 cells, we determined whether the expression of AgpS was also controlled by auxin and cytokinin, since the AgpS protein is believed to be the first rate-limiting enzyme in plant starch biosynthesis. Figure 7, left panel, shows the changes in AgpS mRNA levels during the culture of BY-2 cells in D, F, and B media, as determined by RNA gel-blot analyses. Hybridization signals for elongation factor 1α and 26S rRNA are also shown as controls. The AgpS transcript levels were quantified by densitometric scanning of the x-ray films, normalized by the amount of rRNA in the samples loaded in the respective lanes, and expressed as a relative value where the amount of AgpS mRNA present in stationary-phase cells was set at 1 (Fig. 7, right panel). In every experiment, linearity between loaded RNA and hybridization signal was checked.
Figure 7.
Comparison of AgpS transcript levels under various hormonal conditions. Left, Total RNA was extracted from BY-2 cells cultured for 0, 12, 24, 36, and 48 h in D, F, or B medium and subjected to quantitative RNA gel-blot analyses. Each lane was loaded with 10 μg of total RNA for detection of AgpS and EF-1α, 0.1 μg of total RNA for rRNA. Hybridization signals for transcripts of AgpS (top), elongation factor 1α (middle), and 26S rRNA (bottom) are shown. Right, Changes in the steady-state level of AgpS transcripts under various hormonal conditions. The hybridization signal densities were quantified using the Lane analyzer program. Minor loading differences were accounted for by quantifying the rRNA signals of the 1/100-fold diluted RNA used for the detection of AgpS. The relative accumulation of AgpS mRNA is expressed as a relative value, where the accumulation of stationary-phase cell transcripts is defined as 1. Data are the means from three independent experiments. Vertical bars represent the se. ▪, D medium; ○, F medium; and ▴, B medium.
A slight increase in the AgpS mRNA level was observed during the culture in D medium, although the maximum level was significantly lower than that observed with amyloplast-inducing conditions (F and B media). This slight accumulation of AgpS mRNA in D medium was consistent with the presence of a small number of starch grains in the proplastids of the cells grown in this medium. When BY-2 cells were cultured in amyloplast-inducing media (F and B media), the AgpS transcripts increased to much higher levels than in those observed in cells cultured in D medium. Moreover, the relative levels of AgpS transcripts in the three culture media coincided with the relative starch accumulation (B > F > D). Next, we investigated whether the expression of other genes involved in starch synthesis follows a similar pattern. We chose the GBSS and SBE genes for further analysis because these proteins catalyze the biosynthesis of amylose and amylopectin, the major components of starch.
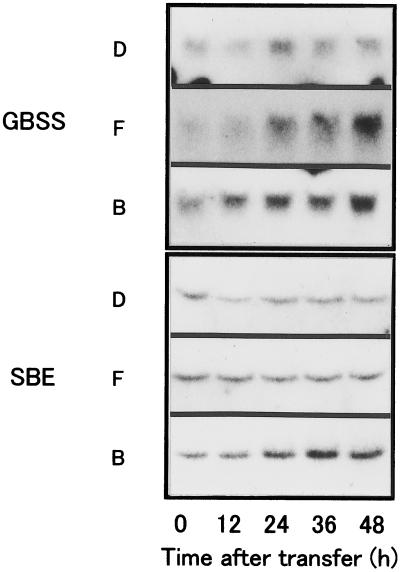
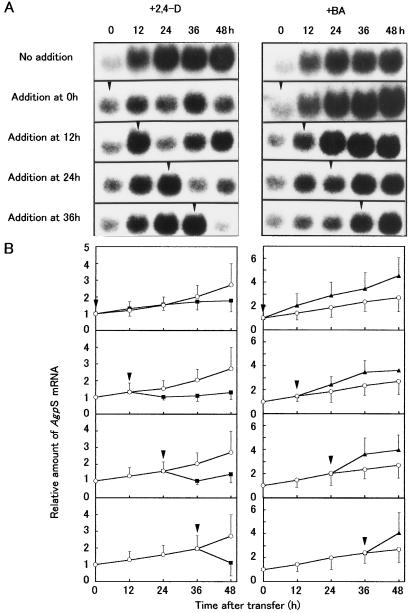
Figure 8 shows the changes in GBSS and SBE mRNA levels during culture of BY-2 cells in D, F, and B media. In D medium, a slight accumulation of GBSS mRNA was observed. When BY-2 cells were cultured in amyloplast-inducing medium, GBSS transcripts accumulated to much higher levels than in D medium. In addition, SBE mRNA levels were lower in cells cultured in D medium compared with cells cultured in amyloplast-inducing medium (F and B media). The relative levels of GBSS and SBE transcripts in the three culture media also coincided with the relative starch accumulation (B > F > D), although the changes were small compared with the changes in AgpS mRNA levels. These results suggest that in addition to the changes in AgpS mRNA levels, GBSS and SBE mRNA levels also change in response to the hormonal conditions. To confirm this hypothesis, either auxin or cytokinin was added to cultures growing in F medium at different times, and the changes in the AgpS mRNA levels were examined using RNA gel-blot analyses (Fig. 9). The addition of auxin or cytokinin resulted in a respective decrease or increase in the AgpS mRNA levels, irrespective of the timing of addition. The effects of hormone addition on AgpS gene expression became obvious within 12 h of the addition, and were very similar to those observed for starch accumulation. These results indicate that auxin and cytokinin have opposite effects on the accumulation of AgpS mRNA during amyloplast differentiation in BY-2 cells.
Figure 8.
Comparison of GBSS and SBE transcript levels under various hormonal conditions. Total RNA was extracted from BY-2 cells cultured for 0, 12, 24, 36, and 48 h in D, F, or B medium and subjected to quantitative RNA gel-blot analyses. Each lane was loaded with 20 μg of total RNA for detection. The same samples of RNA used for determining AgpS transcript levels were used for this blot.
Figure 9.
Response of AgpS gene expression to auxin and cytokinin added during culture. A, RNA gel-blot analysis. Auxin (left) or cytokinin (right) was added to the culture 0, 12, 24, and 36 h after transferring the stationary-phase cells to hormone-free (F) medium. Total RNA was extracted from the cells at 12-h intervals and subjected to quantitative RNA gel-blot analysis using AgpS as a probe. Arrowheads indicate the time of hormone addition. B, Changes in AgpS transcript levels. The hybridization signal densities were quantified using the Lane analyzer program, and the AgpS mRNA levels were expressed as relative values, where the transcript level in stationary-phase cells was defined as 1. Minor loading differences were calibrated by quantification of the rRNA signal density (not shown). Arrowheads indicate the time of hormone addition. Data are the means from three independent experiments. Vertical bars represent the se. ○, Control cells (no hormone addition); ▪, plus 2,4-D; and ▴, plus BA.
DISCUSSION
Effects of Auxin Deprivation and Cytokinin Application on Tobacco BY-2 Cells
In BY-2 cells, synchronous amyloplast formation is triggered by auxin deprivation (Sakai et al., 1996). In this study, we demonstrated that the application of auxin to cells grown in an auxin-depleted medium always inhibited amyloplast formation, regardless of when it was applied. The application of auxin also allowed the amyloplast-differentiating cells to regain their original meristematic properties. This is consistent with the fact that BY-2 cells need exogenously supplied auxin to induce cell division (Ishida et al., 1993). Along with the fact that amyloplast-differentiating cells regain their original meristematic properties by auxin application, many of the differentiating amyloplasts (i.e. plastids observed in the cells grown in auxin-depleted medium for 24 or 36 h) were observed to redifferentiate into proplastids after auxin addition.
Since the mechanism controlling the differentiation and de-differentiation of amyloplasts in plant cells is not clear, this system provides an ideal model for analyzing the process of these events, although which state of development in the plant is represented by this system is not defined. For example, in tobacco plants, amyloplast deposition occurs during root cap development. Root cap cells are derived from the division of a small group of initials located on the distal meristem that differentiate into amyloplast-containing columella cells that sense gravity (Masson, 1995). Winicur et al. (1998) reported that auxin deprivation also induces synchronous Golgi differentiation in BY-2 cells within 4 d. They mentioned that this differentiation resembles the process seen in root cap development. There appear to be many similarities in the growth of BY-2 cells and the development of root cap cells, but further studies are necessary to prove this hypothesis.
The effect of cytokinin was also tested by applying BA to cells cultured in hormone-free medium. Although it is clear that excessive cytokinin enhances the effects observed under auxin-starved conditions (i.e. it stimulated starch deposition and repressed cell division), two possible roles for cytokinin in amyloplast formation might be considered, as BY-2 cells already have endogenous cytokinin that is used to trigger the G2-M transition during their cell cycle (Laureys et al., 1998). The first possibility is that cytokinin is necessary to trigger amyloplast differentiation under auxin-depleted conditions, and that endogenous cytokinin is sufficient to trigger differentiation. The other is that auxin depletion alone is sufficient to trigger amyloplast formation, and that cytokinin only enhances amyloplast development.
Analyses using inhibitors of the action or synthesis of endogenous cytokinin, such as 2-chloro-4-cyclohexylamino-6-ethyl-amino-s-triazine or N-alkyl-carbamate, may reveal the in vivo role, since cytokinin added to an auxin-supplied BY-2 cell culture did not result in the development of amyloplasts and the cells actively proliferated in a manner similar to cells cultured in medium supplied with auxin alone. The further repression of cell division observed with excess cytokinin might indicate that a high concentration of cytokinin inhibits cell division (Skoog et al., 1967; Mackenzie et al., 1972). However, the exact role of cytokinin in amyloplast differentiation remains to be determined.
Steady-State Levels of mRNA for Starch Synthetic Genes Are Altered by the Application of Auxin and Cytokinin
We analyzed AgpS, GBSS, and SBE transcript levels to determine whether the transcripts of genes involved in starch synthesis were also affected by auxin and cytokinin addition. Sakai et al. (1997) used transcription/translation inhibitors to show that amyloplast formation in BY-2 cells requires nuclear gene expression. In the present study, AgpS transcripts were used to confirm this hypothesis, as the holoenzyme of ADP-Glc pyrophosphorylase is widely believed to play a central role in starch synthesis in several species (Preiss, 1991). Higher levels of AgpS transcripts accumulated in cells cultured in amyloplast-inducing medium (F and B media) than in cells cultured in D medium, which does not induce amyloplast formation.
We also determined the number of AgpS transcripts per cell by quantitative RNA gel-blot analyses, and patterns of expression similar to those observed in RNA gel-blot analyses performed on total RNA were obtained (data not shown). A correlation between the accumulation of ADP-Glc pyrophosphorylase transcripts and starch was also observed in developing potatoes (Prat et al., 1990). Furthermore, we studied mRNA levels of GBSS and SBE, which are necessary for biosynthesis of amylose and amylopectin, respectively. Similar to the changes observed in AgpS mRNA levels, higher levels of GBSS and SBE transcripts accumulated in cells cultured in amyloplast-inducing medium (F and B media) than in cells cultured in D medium, which does not induce amyloplast formation. However, the changes in GBSS and SBE mRNA levels were not as significant as the changes in AgpS mRNA levels. This is partly because existing GBSS or SBE proteins participate in starch synthesis during amyloplast development, as demonstrated by the fact that stationary-phase BY-2 cells contain a certain amount of GBSS protein (Sakai et al., 1999). It is also likely that other GBSS or SBE isoforms have a similar role in starch synthesis during BY-2 amyloplast development.
Further analyses revealed that there was a significant response in the accumulation of AgpS transcripts to the exogenous addition of auxin and cytokinin during amyloplast development, as reflected by changes in starch content per cell following application of these phytohormones. In this experiment, AgpS gene expression was chosen for further study because AgpS mRNA levels changed much more dramatically than GBSS or SBE mRNA levels upon exposure to changing auxin and cytokinin condition. Since the allosteric properties of ADP-Glc pyrophosphorylase are primary factors in the regulation of the enzyme's activity (Stark et al., 1992; Greene and Hannah, 1998), differences in AgpS transcript levels under various hormonal conditions do not directly explain the alteration in starch content. However, our results indicate that accumulation of AgpS transcripts is repressed by the presence of auxin and increased by the addition of cytokinin, either directly or indirectly, thereby affecting the rate of starch accumulation. The changes in GBSS and SBE mRNA levels after either auxin or cytokinin treatment were not as significant as the changes in AgpS mRNA levels (data not shown); however, GBSS and SBE mRNA levels showed some response to hormonal conditions, as described in Figure 8. Further study is needed to determine whether auxin and cytokinin also regulate AgpS, GBSS, and SBE protein levels.
Several plant genes that are either down-regulated by auxin or up-regulated by cytokinin have been identified (for review, see Sitbon et al., 1997; Schmülling et al., 1997); however, no such genes related to starch synthesis have been identified. The function of many of the plant genes whose transcription is regulated by either auxin or cytokinin is unknown. Some may have roles in BY-2 amyloplast development, for example, acting as transcriptional factors to regulate gene expression concerned with starch synthesis. The exploration of gene expression responsible for amyloplast development in BY-2 cells is now being studied.
ACKNOWLEDGMENT
The authors thank Yohsuke Takahashi (University of Tokyo) for allowing us to use the tobacco elongation factor 1α gene probe.
Footnotes
This work was supported by a research fellowship (no. 5122 to Y.M.) from the Japan Society for the Promotion of Science for Young Scientists, by a Grant-in-Aid for Scientific Research in Priority Areas (no. 10170208 to A.S.), by a grant-in-aid (no. 11163206 to T.K.) from the Ministry of Education, Science, Sports and Culture of Japan and the Ministry of Agriculture, Forestry and Fisheries of Japan.
LITERATURE CITED
- Ball S, Guan H, James M, Meyers A, Keeling P, Mouille G, Buléon A, Colonna P, Preiss J. From glycogen to amylopectin: a model for the biogenesis of the plant starch granule. Cell. 1996;86:349–352. doi: 10.1016/s0092-8674(00)80107-5. [DOI] [PubMed] [Google Scholar]
- Coenen C, Lomax TL. Auxin-cytokinin interactions in higher plants: old problems and new tools. Trends Plant Sci. 1997;9:351–355. doi: 10.1016/S1360-1385(97)84623-7. [DOI] [PubMed] [Google Scholar]
- Dubois M, Gilles KA, Hamilton JK, Rebers PA, Smith F. Colorimetric method for determination of sugars and related substances. Anal Chem. 1956;28:350–356. [Google Scholar]
- Greene TW, Hannah LC. Adenosine diphosphate glucose pyrophosphorylase, a rate-limiting step in starch biosynthesis. Physiol Plant. 1998;103:574–580. [Google Scholar]
- Ishida S, Takahashi Y, Nagata T. Isolation of cDNA of an auxin-regulated gene encoding a G protein β subunit-like protein from tobacco BY-2 cells. Proc Natl Acad Sci USA. 1993;90:11152–11156. doi: 10.1073/pnas.90.23.11152. [DOI] [PMC free article] [PubMed] [Google Scholar]
- Kirk JTO. Proplastids, etioplasts, amyloplasts, chromoplasts and other plastids. In: Kirk JTO, Tilney-Basset RAE, editors. The Plastids: Their Chemistry, Structure, Growth, and Inheritance. Ed 2. Amsterdam: Elsevier/North-Holland Biomedical Publishing; 1978. pp. 219–241. [Google Scholar]
- Kuroiwa T, Miyamura S, Kawano S, Hizume M, Toh-e A, Miyakawa I, Sando N. Cytological characterization of NOR in the bivalent of Saccharomyces cerevisiae. Exp Cell Res. 1986;165:199–206. doi: 10.1016/0014-4827(86)90544-6. [DOI] [PubMed] [Google Scholar]
- Laureys F, Dewitte W, Witters E, Montagu MV, Inzè D, Onckelen HV. Zeatin is indispensable for the G2-M transition in tobacco BY-2 cells. FEBS Lett. 1998;426:29–32. doi: 10.1016/s0014-5793(98)00297-x. [DOI] [PubMed] [Google Scholar]
- Mackenzie IA, Konar A, Street HE. Cytokinins and the growth of cultured sycamore cells. New Phytol. 1972;71:633–638. [Google Scholar]
- Martin C, Smith AM. Starch biosynthesis. Plant Cell. 1995;7:971–985. doi: 10.1105/tpc.7.7.971. [DOI] [PMC free article] [PubMed] [Google Scholar]
- Masson PH. Root gravitropism. BioEssays. 1995;17:119–127. doi: 10.1002/bies.950170207. [DOI] [PubMed] [Google Scholar]
- Matsunaga S, Kawano S, Takano H, Uchida H, Sakai A, Kuroiwa T. Isolation and developmental expression of male reproductive organ-specific genes in a dioecious campion, Melandrium album (Silene latifolia) Plant J. 1996;10:679–689. doi: 10.1046/j.1365-313x.1996.10040679.x. [DOI] [PubMed] [Google Scholar]
- Matthysse AG, Scott TK. Functions of hormones at the whole plant level of organization. In: Scott TK, editor. Hormonal Regulation of Development II. Encyclopedia of Plant Physiology, New Series. Vol. 10. Berlin: Springer-Verlag; 1984. pp. 219–243. [Google Scholar]
- Miller CO, Skoog F, Saltza MH, Strong FM. Kinetin, a cell division factor from deoxyribonucleic acid. J Am Chem Soc. 1955;77:1329–1334. [Google Scholar]
- Nagata T, Nemoto Y, Hasezawa S. Tobacco BY-2 cell line as the “HeLa” cell in the cell biology of higher plants. Int Rev Cytol. 1992;132:1–30. [Google Scholar]
- Prat S, Frommer WB, Höfgen R, Keil M, Kossmann J, Köster-Töpfer M, Liu X-J, Müller B, Peña-Cortés H, Rocha-Sosa M, Sánchez-Serrano JJ, Sonnewald U, Willmitzer L. Gene expression during tuber development in potato plants. FEBS Lett. 1990;268:334–338. doi: 10.1016/0014-5793(90)81281-r. [DOI] [PubMed] [Google Scholar]
- Preiss J. Biology and molecular biology of starch synthesis and regulation. Oxf Surv Plant Mol Cell Biol. 1991;7:59–114. [Google Scholar]
- Sakai A, Kawano S, Kuroiwa T. Conversion of proplastids to amyloplasts in tobacco cultured cells is accompanied by changes in the transcriptional activities of plastid genes. Plant Physiol. 1992;100:1062–1066. doi: 10.1104/pp.100.2.1062. [DOI] [PMC free article] [PubMed] [Google Scholar]
- Sakai A, Miyazawa Y, Saito C, Nagata N, Takano H, Hirano HY, Kuroiwa T. Amyloplast formation in cultured tobacco cells. III. Determination of the timing of gene expression necessary for starch accumulation. Plant Cell Rep. 1999;18:589–594. [Google Scholar]
- Sakai A, Miyazawa Y, Yashiro K, Suzuki T, Kawano S. Amyloplast formation in cultured tobacco cells. II. Effects of transcription/translation inhibitors on accumulation of starch. Cytologia. 1997;62:295–301. [Google Scholar]
- Sakai A, Yashiro K, Kawano S, Kuroiwa T. Amyloplast formation in cultured tobacco cells: effects of plant hormones on multiplication, size, and starch content. Plant Cell Rep. 1996;15:601–605. doi: 10.1007/BF00232461. [DOI] [PubMed] [Google Scholar]
- Sambrook J, Fritsch EF, Maniatis T. Molecular Cloning: A Laboratory Manual. Ed 2. Cold Spring Harbor, NY: Cold Spring Harbor Laboratory Press; 1989. [Google Scholar]
- Schmülling T, Schäfer S, Romanov G. Cytokinins as regulators of gene expression. Physiol Plant. 1997;100:505–519. [Google Scholar]
- Sitbon F, Perrot-Rechenmann C. Expression of auxin-regulated genes. Physiol Plant. 1997;100:443–455. [Google Scholar]
- Skoog F, Hamzi HQ, Sweykowska AM, Leonard NJ, Carraway KL, Fujii T, Helgeson JP, Loeppky RN. Cytokinins: structure/activity relationships. Phytochemistry. 1967;6:1169–1192. [Google Scholar]
- Smith AM, Denyer K, Martin C. The synthesis of the starch granule. Annu Rev Plant Physiol Plant Mol Biol. 1997;48:67–87. doi: 10.1146/annurev.arplant.48.1.67. [DOI] [PubMed] [Google Scholar]
- Stark DM, Timmerman KP, Barry GF, Preiss J, Kishore GM. Regulation of the amount of starch in plant tissues by ADP glucose pyrophosphorylase. Science. 1992;258:287–292. doi: 10.1126/science.258.5080.287. [DOI] [PubMed] [Google Scholar]
- Suzuki T, Kawano S, Sakai A, Fujie M, Kuroiwa H, Nakamura H, Kuroiwa T. Preferential mitochondrial and plastid DNA synthesis before multiple cell divisions in Nictotiana tabacum. J Cell Sci. 1992;103:831–837. [Google Scholar]
- Winicur ZM, Zhang GF, Staehelin LA. Auxin deprivation induces synchronous Golgi differentiation in suspension-cultured tobacco BY-2 cells. Plant Physiol. 1998;117:501–513. doi: 10.1104/pp.117.2.501. [DOI] [PMC free article] [PubMed] [Google Scholar]


