

Abstract
Background:
Patients undergoing hematopoietic cell transplantation (HCT) for hematological malignancies experience a number of challenges during treatment. There is growing evidence that malglycemia (hyperglycemia, hypoglycemia, and/or increased glycemic variability) contributes to HCT-related complications, even in patients without preexisting diabetes. The purpose of this pilot study was to investigate factors influencing glycemic status and associated infection occurrences in nondiabetic autologous HCT recipients.
Methods:
Oncology patients without preexisting diabetes treated with autologous HCT at a National Cancer Institute–designated cancer center were followed from admission through discharge or 28 days post-HCT. Patients had morning fasting laboratory tests. Descriptive statistics and Cox proportional hazards models were used to examine associations between BG levels and risk for infection while adjusting for baseline covariates including age, body mass index (BMI), cumulative glucocorticoid dose, and diagnosis.
Results:
The sample included 28 female and 25 male predominately non-Hispanic White patients (mean age 55.7 years, SD = 11.32). Blood glucose (BG) range was 35–325 mg/dl. Twenty-three patients incurred at least one infection. BMI ≥ 25 kg/m2 was associated with high BG and infections. In the multivariate Cox model, an increase of 1 interquartile range in BG 2 days before infection was associated with a moderately increased risk of infection (hazard ratio = 1.44, p = .008).
Conclusions:
Understanding the contributors to and consequences of malglycemic events can lead to better protocols for identifying patients at greater risk for infection. Further investigation is warranted for interventions to mitigate BG events for improved outcomes.
Keywords: autologous hematopoietic cell transplantation, glycemic status, infections
Individuals undergoing treatment for cancer are at risk for adverse events from the malignancy, treatments used to eradicate or mitigate the malignancy and immunosuppression (Butler, Btaiche, & Alaniz, 2005). In particular, infections can readily occur in these patients, leading to sepsis and possibly death (Aisenberg, Rolston, & Safdar, 2004; Nichols, 2003). There is growing evidence that malglycemia is another contributor to such adverse outcomes, including infections (Derr, Hsiao, & Saudek, 2008; Hammer et al., 2009).
Malglycemia is defined as perturbations in random blood glucose (BG) levels, including hyperglycemia (BG ≥ 126 mg/dl) and hypoglycemia (BG < 70 mg/dl), and/or increased glycemic variability (defined as a standard deviation [SD] of individual BG measures ≥29 mg/dl; Hammer et al., 2009). Among the three components of malglycemia, the risk for hyperglycemia appears to predominate among patients undergoing treatment for cancer. Hyperglycemic events are not unexpected among individuals with preexisting diabetes during cancer treatments (Vischer et al., 2009), and as many as 18% of patients diagnosed with cancer have preexisting diabetes (Barone et al., 2008), as compared to 12.3% of the general population ≥20 years old (Centers for Disease Control and Prevention, 2014). Most studies investigating contributors to hyperglycemia have been conducted in nononcology patients. Based on evidence from previous studies, we hypothesize that, independent of diabetes, all patients with cancer may be at risk for hyperglycemic states from treatment with glucocorticoids (Mazali, Lalli, Alves-Filho, & Mazzali, 2008; Willi et al., 2002) and chemotherapeutic agents (Turina, Christ-Crain, & Polk, 2006; Willi et al., 2002). In addition, high body mass index (BMI; Roumen, Blaak, & Corpeleijn, 2009), nutritional imbalances (Butler et al., 2005; Jenkins et al., 2002; Martin-Salces, de Paz, Canales, Mesejo, & Hernandez-Navarro, 2008; Sheean & Braunschweig, 2006), physical inactivity (Katz, 2007; Lanza & Nair, 2009; Lanza et al., 2008), stress (Butler et al., 2005; Godbout & Glaser, 2006; Turina et al., 2006), and infections (Turina et al., 2006) can contribute to hyperglycemia. Currently, there is limited understanding about these contributors to hyperglycemia and related infections in patients actively undergoing treatment for cancer. Because associations between patients with diabetes and cancer are established (Giovannucci et al., 2010) and the majority of patients undergoing treatment for cancer do not have diabetes, investigating patients without preexisting diabetes undergoing cancer therapies for glycemic disturbances and sequelae could lead to better treatment protocols for improved outcomes.
In the present study, we investigated the contributors to malglycemia, particularly hyperglycemia, and associations between hyperglycemia and infections among nondiabetic patients with hematological malignancies who received autologous hematopoietic cell transplantation (HCT). Focusing on HCT recipients allowed us to assess a relatively homogenous hospitalized population who were receiving similar treatments and had daily fasting blood laboratory tests that were processed through the same core analyzer. Comparing uniform laboratory results to patient factors (e.g., age, sex, BMI, and race/ethnicity) can help distinguish which patients may be at greater risk for hyperglycemic events during treatment. Additionally, complicating factors in this population such as febrile neutropenia need to be considered. All patients become neutropenic following HCT from the conditioning regimen, which increases the risk for infections independent of other factors. Fever during this phase is another potential infection indicator (Zhang, Zhao, & Huang, 2015). The purposes of this investigation, therefore, were to describe demographic and clinical characteristics associated with malglycemic events, particularly hyperglycemia, and infection occurrences in nondiabetic patients with hematological malignancies who received autologous HCT, while taking multiple variables (particularly age, BMI, and glucocorticoid dose) into account.
Material and Method
Patients and Setting
Adult patients (≥18 years of age) diagnosed with a hematological malignancy being treated at a single urban National Cancer Institute–designated cancer center who were scheduled for an autologous HCT on the inpatient bone marrow transplant (BMT) unit were eligible for this study. Inclusion criteria required that patients be able to read, write, and understand English and give written informed consent. We excluded patients with preexisting diabetes. Further, part of the eligibility for receiving HCT includes assessment of a weighted comorbidity index. Scores are categorized by risk for death, with 0 = low risk, 1–2 = intermediate risk, and 3 = high risk (Sorror et al., 2005). Patients in this study were at low risk.
The observation period was from day of admission to the inpatient BMT unit through discharge or 28 days post-HCT, whichever came first. Patients enrolled in the study who were transferred to the intensive care unit for an adverse event remained in the study. We also took blood samples for a separate analysis of proinflammatory cytokine expression during treatment; however, those findings are not part of this analysis.
Measurements
We obtained patient and clinical characteristics from electronic medical records, including date of birth, sex, race/ethnicity, BMI, type of malignancy, and conditioning regimen (including amount of glucocorticoids). The conditioning regimen was similar for all patients and included carmustine, cytarabine, etoposide, and melphalan. We categorized BMI per the National Institutes of Health (NIH)/National Institute of Diabetes and Digestive and Kidney Diseases (NIDDK) guidelines of underweight <18.5 kg/m2, normal 18.5–24.9 kg/m2, overweight 25.0–29.9 kg/m2, obese 30.0–34.9 kg/m2, and morbidly obese ≥35 kg/m2 (NIDDK, 2013). We defined febrile neutropenia as a temperature ≥38°C with an absolute neutrophil count <500/mm3.
All laboratory values were from morning fasting blood tests, which are routinely drawn between 0400 and 0630. We selected BG > 110 mg/dl to define hyperglycemia in this patient population based on studies in critical care that have shown increased risk for adverse outcomes in patients at this glycemic level (Joshi, Patel, Wert, Parvathaneni, & Cheriyath, 2014; Scuteri et al., 2014). We defined hypoglycemia as BG <70 mg/dl and increased glycemic variability as an SD of individual BG measures ≥29 mg/dl (Hammer et al., 2009).
We defined infections as detection of a microorganism that was not part of the normal flora or of a microorganism that was part of the normal flora but had increased colony-forming units and/or administration of increased and/or additional antimicrobial agents along with the standard prophylactic regimen. Prophylactic antimicrobial agents included fluconazole 100–200 mg PO q day, acyclovir 400 mg PO q12 hours, cefepime 1–2 gm IV q12 hours, and vancomycin 250 mg PO q6 hours. Infectious microorganisms included vancomycin-resistant enterococci, vancomycin-susceptible enterococci, Klebsiella species, gram-negative bacteria, Escherichia coli, and cytomegalovirus. We counted a positive procalcitonin test without a detected microorganism but with fever as an infection in two patients. Coagulase negative Staphylococcus and other organisms part of the normal flora detected exclusively in the central line catheter indicated infections if the oncologist or another hospital provider initiated or modified antibiotic therapy. We counted the same microorganism detected in two or more cultures taken at different time points as the same infection. Specimens are commonly collected for culture at the first sign of fever or other symptom (e.g., diarrhea). Cultures included in this study were taken from blood, urine, and central line catheters. All cultures taken were evaluated for 3–5 days postcollection, but all microorganisms detected and documented as an infection in this patient population showed a positive culture 1 day following collection. Additional or increased antimicrobial medications were initiated either the same day as specimen collection or the following day when the laboratory results indicated a positive culture. Due to the possibility of increased colonization of normal flora in the stool and sputum, we did not consider documented positive cultures from specimens in these areas to be infections in our analysis.
Study Procedures and Data Analysis
We obtained approval for the study protocol from the cancer center’s Protocol Review and Monitoring Committee followed by the medical center’s institutional review board. Nurses working directly with patients scheduled for HCT made initial patient contact, which was followed by a member of the study team meeting with each patient. Following the collection of written informed consent there was no further contact between the study team and the patient. We collected all data for this analysis via electronic medical records. Observations were during hospitalization days directly related to the autologous HCT only.
We analyzed data using SPSS Version 22 (IBMCorp, Armonk, NY) and the R (Version 3.1.3) statistical computing environment (R_Core_Team). Descriptive statistics were calculated for demographic and clinical characteristics including BG level and variability using the SD. Independent groups t-tests were used to compare average BMI and BG between infection groups. The Cox proportional hazards model was used to evaluate associations between the time-dependent variable of BG levels and the outcome of risk for infection. Before fitting multivariate models, we explored associations between infection risk and BG level and variability on the same day as the measurement of infection as well as 1–4 days before that day in bivariate Cox proportional hazards models. Time-invariant variables of age, BMI, amount of glucocorticoids, and diagnosis were included in multivariate models. A patient cluster variable was in all Cox models for robust standard errors, given the increased likelihood of additional infections after the primary infection in the same patient.
Results
Among the 56 patients enrolled, 53 completed autologous HCT and were included in the analyses. Attrition was due to death prior to HCT (n = 1) or not receiving the HCT due to competing health issues (n = 2).
Demographic and Clinical Characteristics Associated With Malglycemia
Patient demographic and clinical characteristics are shown in Table 1. Mean patient age was 55.75 years (SD = 11.3; range 31–73 years). Over 77% of patients were over the age of 50 years and had more BG values >110 mg/dl compared to patients under the age of 50 (not significant [NS]). Most patients were non-Hispanic White (69.8%) and receiving treatment for multiple myeloma (56.6%). Almost 53% of the patients were treated in 2011; however, the protocol for autologous HCT remained the same throughout the study period (2011–2013).
Table 1.
Patient Characteristics.
| Characteristic | Female (n = 28) Median (minimum, maximum) | Male (n = 25) Median (minimum, maximum) |
|---|---|---|
| Age, years | 57.5 (31, 68) | 57.0 (31, 73) |
| n (%) | n (%) | |
| Hispanic ethnicity | 4 (14.3) | 1 (4.0) |
| Race | ||
| White | 20 (71.4) | 17 (68.0) |
| Black | 5 (17.9) | 6 (24.0) |
| Asian | 3 (10.7) | 2 (8.0) |
| Diagnosis | ||
| Multiple myeloma | 16 (57.1) | 14 (56.0) |
| Lymphoma | 9 (32.1) | 5 (20.0) |
| Hodgkin disease | 3 (10.7) | 3 (12.0) |
| Amyloidosis | 0 (0.0) | 1 (4.0) |
| Other myeloma | 0 (0.0) | 2 (8.0) |
| BMI | ||
| Underweight | 1 (3.6) | 0 (0.0) |
| Within normal range | 8 (28.6) | 7 (28.0) |
| Overweight | 10 (35.7) | 11 (44.0) |
| Obese | 5 (17.9) | 5 (20.0) |
| Morbidly obese | 4 (14.3) | 2 (8.0) |
| Year of transplant | ||
| 2011 | 17 (60.7) | 11 (44.0) |
| 2012 | 8 (28.6) | 7 (28.0) |
| 2013 | 3 (10.7) | 7 (28.0) |
Note. Percentages are rounded. Underweight = BMI < 18.5 kg/m2, within normal range = 18.5–24.9 kg/m2, overweight = 25.0–29.9 kg/m2, obese 30.0–34.9 kg/m2, and morbidly obese ≥ 35.0 kg/m2. BMI = body mass index.
All patients received dexamethasone pre-HCT, with the exception of two patients who received prednisone, and seven patients also received post-HCT steroids. The mean and median doses were 64.6 mg and 64.0 mg, respectively. The sample was too homogenous to make a distinction between steroid dose and risk for hyperglycemia.
Mean BMI was 28.83 (range 17.80–52.15), with 70% of patients in the overweight or obese ranges. Higher BMI was associated with more frequent BG measures > 110 mg/dl (r = .334, p = .015). Compared to patients without infections, patients with infections had higher average BMI, M Infection = 31.9 kg/m2, range 17.8–52.2; M Noninfection = 26.5 kg/m2, range 20.6–37.7; t(30.5) = −2.79, p < .01 (Figure 1).
Figure 1.
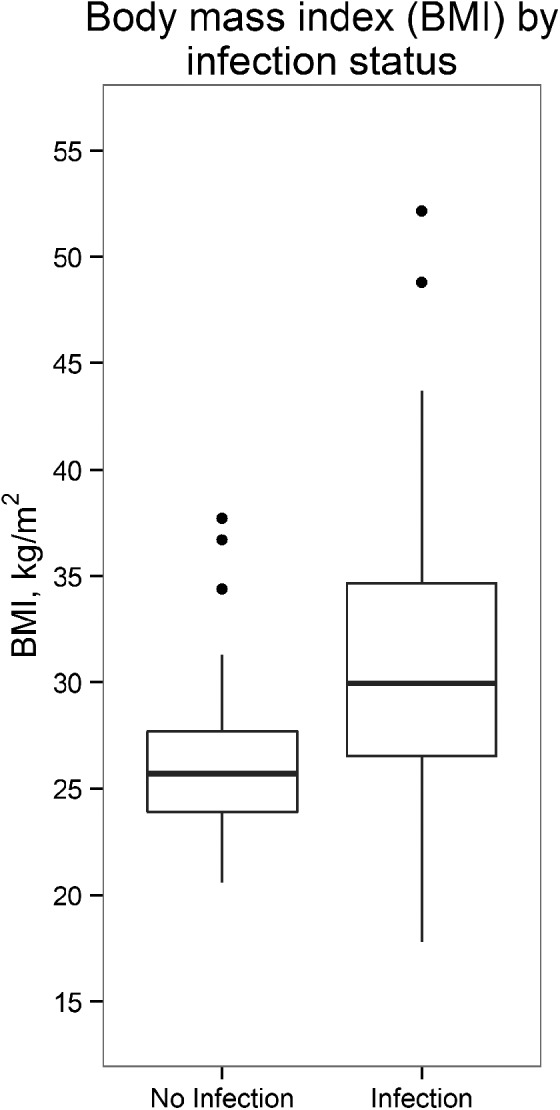
Box plot of body mass index (BMI) by infection status. Patients with higher BMI had more infections compared to patients with lower BMI. Differences were statistically significant (p < .01).
Malglycemia and Infections
Overall mean BG was 96.6 mg/dl, with individual BG values ranging from 35 to 325 mg/dl and the per-patient BG mean over hospitalization days ranging from 75.23 to 156.09 mg/dl. Of the individual BG values, 3% were hypoglycemic (<70 mg/dl), 18.6% were hyperglycemic (>110 mg/dl), and 10% were ≥126 mg/dl. The mean proportion of days with BG > 110 mg/dl was 17% (range 0–87%). Within-subject variability of BG measured by SD ranged from 6.82 to 48.44 mg/dl, with a mean of 17.72 mg/dl.
A total of 23 patients had 26 infections during the study period, with 1 patient having 2 infections occurring and another having 3. Infections are listed by location and microorganism in Table 2.
Table 2.
Infections by Location.
| Microorganism | Location of Detected Microorganism, n |
||
|---|---|---|---|
| Blood | Urine | Catheter | |
| Staphylococcus aureas (VSE or VRE) | — | 7 | 5 |
| Klebsiella species | — | 1 | — |
| Gram-negative bacteria | 2 | 3 | 1 |
| Escherichia coli | 1 | 1 | — |
| Cytomegalovirus | 3 | — | — |
| Positive procalcitonin testa | 2 | — | — |
Note. VRE = vancomycin-resistant enterococcus; VSE = vancomycin-susceptible enterococcus.
aPostive procalcitonin test indicates an infection, microorganism unknown.
The presence of febrile neutropenia was not associated with infection occurrence. Of the 13 BG metrics, we explored to identify the relation between BG and infection risk, the majority (nine) were significant or marginally significant, including BG >110 mg/dl, and BG variability on the same day as and 1–4 days before the day on which infection was detected. The variant with the strongest association with infection risk was BG measured 2 days prior to the day on which infection was detected (hazard ratio [HR] = 1.58, p < .001), and we incorporated this variable into a multivariate Cox proportional hazard model predicting time to infection.
Including the variables of BMI, age, steroid dose, and type of malignancy, the Cox proportional hazards model (Table 3) showed a moderately increased risk for infection with an increase of 1 interquartile range in BG 2 days prior to the infection observation day (HR = 1.44, p = .008). There was also an association between BMI and risk for infection. In the unadjusted model, a 1 interquartile increase in BMI increased the risk of infection by 1.39 (p = .029). In the adjusted model, an increase in BMI of 1 interquartile range increased the risk for infection by 1.44 (p = .053).
Table 3.
Cox Proportional Hazards Models.
| Unadjusted |
Adjusted |
|||||
|---|---|---|---|---|---|---|
| Covariate | HR | p | 95% CI | HR | p | 95% CI |
| BG 2 days prior | 1.58 | <.001* | [1.25, 2.01] | 1.44 | .008* | [1.10, 1.89] |
| Age | 1.03 | .877 | [0.69, 1.55] | 0.98 | .942 | [0.52, 1.83] |
| BMI | 1.39 | .029* | [1.03, 1.86] | 1.44 | .053 | [0.99, 2.08] |
| Pre Dex | 0.95 | .805 | [0.60, 1.48] | 1.01 | .958 | [0.60, 1.73] |
| Total Dex | 0.98 | .469 | [0.91, 1.04] | 0.99 | .651 | [0.96, 1.03] |
| Diagnosis | ||||||
| MM vs. lymphoma | 1.65 | .227 | [0.73, 3.74] | 2.05 | .082 | [0.91, 4.62] |
| Other vs. lymphoma | 0.44 | .179 | [0.13, 1.46] | 0.45 | .239 | [0.12, 1.70] |
Note. BG, age, and BMI were each divided by their interquartile range. BG = blood glucose; BMI = body mass index; HR = hazard ratio; other = other hematological malignancies (Hodgkin’s disease, amyloidosis, and other myelomas); Pre Dex = total dose of dexamethasone (steroid) prior to day of transplantation; total Dex = total dose of dexamethasone throughout hospitalization; MM = multiple myeloma; CI = confidence interval.
*p < .05.
Discussion
Contributors to Malglycemia
In this study, we explored demographic and clinical characteristics in association with malglycemic events, particularly hyperglycemia, and infection occurrences in nondiabetic patients with hematological malignancies who received autologous HCT. We selected the variables of BMI, age, and glucocorticoid dose based on preliminary clinical findings from our prior work coupled with studies in the literature that evaluated biological mechanisms in nononcology subjects.
The sample was closely divided between male and female patients with the majority being non-Hispanic White. Supporting our hypothesis, the most significant patient characteristic associated with hyperglycemia was BMI at a level of ≥25 kg/m2 (overweight—obese) compared to a BMI < 25 kg/m2. High BMI is an established risk for diabetes (defined by hyperglycemia) due to increased insulin resistance (Giovannucci et al., 2010; Makki, Froguel, & Wolowczuk, 2013). At levels of obesity (BMI ≥ 30 kg/m2), adipose tissue remodeling occurs, creating metabolic dysfunction leading to oxidative stress (Le Lay, Simard, Martinez, & Andriantsitohaina, 2014). A state of metabolic inflammation ensues, impairing glucose metabolism and inducing hyperglycemic states (Makki et al., 2013). These pathways have not been well studied in patients with cancer and merit further investigation due to the increased risk for adverse events.
In addition to BMI, we hypothesized that older age and higher glucocorticoid doses would be associated with higher levels of BG, more hyperglycemic events, and more glycemic variability. The normal physiology of aging can potentially increase the risk for hyperglycemia, in part due to reduced organ function (Campisi & d’Adda di Fagagna, 2007; Tchkonia, Zhu, van Deursen, Campisi, & Kirkland, 2013). We found that patients over the age of 50 had more days of BG >110 mg/dl, our benchmark for high BG in this population, compared to younger patients; however, only 22.6% of the patients in our study were under the age of 50, and this difference was not significant in the descriptive analysis. Although other studies evaluating BG and outcomes in HCT populations have adjusted for age (Derr et al., 2008; Hammer et al., 2009), to our knowledge, this was the first that investigated age as a contributor.
Glucocorticoids are part of the conditioning regimen in HCT recipients for their immunosuppressive (Perez et al., 2014) and antiemetic (Einhorn, Grunberg, Rapoport, Rittenberg, & Feyer, 2011) properties, but they also increase the risk for hyperglycemia (Oyer, Shah, & Bettenhausen, 2006; Perez et al., 2014). The sequelae of glucocorticoid administration involve increased insulin resistance, induced gluconeogenesis, and the inhibition of insulin production by pancreatic β cells (Perez et al., 2014), thus leading to hyperglycemic states. Therefore, we anticipated that patients who received higher doses of steroids would have higher levels of BG. With few exceptions, the amount of steroids administered to patients did not vary greatly, leading to our lack of finding major differences between patients regarding steroid dose and BG levels.
Malglycemia and Infections
Over 40% of patients in this sample incurred one or more infections, mostly occurring within the first 2 weeks post-HCT. Although not well investigated in patients with cancer, the likely mechanism for the association between hyperglycemia and infections is an inflammatory pathway that interferes with immune function. For example, in patients with diabetes, hyperglycemia causes oxidative stress that impairs host innate immune cell mechanisms that normally detect pathogen molecules and activate immune responses to eliminate the pathogens (Buchholz & Stephens, 2008). As noted above, similar pathways account for the association between obesity and impaired immune function (Le Lay et al., 2014; Makki et al., 2013); in fact, we also found an association between high BMI and infection rates. Figure 2 is a simple schematic showing these associations. Our findings suggest that patients scheduled for autologous HCT who have a BMI ≥25 kg/m2 have an increased risk for glycemic events and infections and thus warrant close glucose monitoring. Further investigation of these pathways in patients with cancer can provide better evidence to guide future clinical practice.
Figure 2.
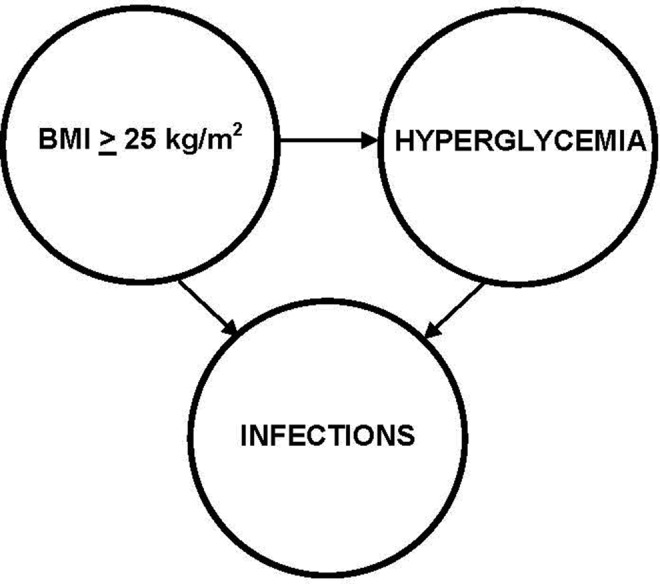
Schematic of associations among a body mass index ≥25 kg/m2, hyperglycemia, and infections in patients with cancer being treated with autologous hematopoietic cell transplantation.
We also evaluated the association between BG and risk for infection using a Cox regression model. Findings reinforced our conclusion that the risk for infections increased with increasing glycemic levels. We analyzed BG levels as an event prior to detection of an infection, but it is important to note that infections can also increase BG (Turina et al., 2006). To our knowledge, researchers have not studied increases in BG following infections and the potential for increased risk of further infections based on these later BG values. Future investigations should include this analysis.
Limitations, Strengths, and Implications
Limitations of this study include the small sample size and, with that, a lack of variability in the variables of age and glucocorticoid dose, which inhibited our ability to test our hypothesis that age and steroid dose are associated with the risk for infections. Also, due to the sample size, we could detect only moderate and larger effects.
The strengths of the study included the homogenous sample with uniform laboratory tests, thus eliminating confounding variables of diverse types of malignancies and treatments and varying laboratory measurement that can fluctuate throughout the day. This was also the first study, to our knowledge, that investigated BG in patients undergoing treatment for cancer that excluded patients with preexisting diabetes. This aspect of the study is important because it is well established that patients with diabetes are at risk for hyperglycemic events during cancer therapies, and they are thus usually closely monitored. The understanding that patients without diabetes are also at risk for these events implies that practice protocols may need to change to ensure that all patients have an optimal opportunity for successful outcomes when undergoing treatments for cancer.
In conclusion, patients undergoing HCT for hematological malignancies are at risk for glucose excursions, which can increase the risk for infections. Understanding the contributors to malglycemic and, in particular, hyperglycemic events can lead to better screening protocols for identifying patients at greatest risk for infections and other adverse events. For example, patients with a BMI ≥ 25 should have close BG monitoring during treatment. Further research is warranted to develop interventions to mitigate BG events for improved patient outcomes.
Footnotes
Author Contribution: Marilyn J. Hammer contributed to conception, design, acquisition, analysis, and interpretation; drafted and critically revised manuscript; gave final approval; and agrees to be accountable for all aspects of work ensuring integrity and accuracy. Gail D’Eramo Melkus contributed to design and interpretation; drafted and critically revised manuscript; gave final approval; and agrees to be accountable for all aspects of work ensuring integrity and accuracy. M. Tish Knobf contributed to design and interpretation; drafted and critically revised manuscript; gave final approval; and agrees to be accountable for all aspects of work ensuring integrity and accuracy. Corey Casper contributed to conception and interpretation; drafted and critically revised manuscript; gave final approval; and agrees to be accountable for all aspects of work ensuring integrity and accuracy. Jason Fletcher contributed to design, analysis, and interpretation; drafted and critically revised manuscript; gave final approval; and agrees to be accountable for all aspects of work ensuring integrity and accuracy. Charles M. Cleland contributed to design, analysis, and interpretation; drafted and critically revised manuscript; gave final approval; and agrees to be accountable for all aspects of work ensuring integrity and accuracy.
Declaration of Conflicting Interests: The author(s) declared no potential conflicts of interest with respect to the research, authorship, and/or publication of this article.
Funding: The author(s) disclosed receipt of the following financial support for the research, authorship, and/or publication of this article: This study was funded by the National Institutes of Health, National Institute of Nursing Research (K23NR012467).
References
- Aisenberg G., Rolston K. V., Safdar A. (2004). Bacteremia caused by Achromobacter and Alcaligenes species in 46 patients with cancer (1989-2003). Cancer, 101, 2134–2140. [DOI] [PubMed] [Google Scholar]
- Barone B. B., Yeh H. C., Snyder C. F., Peairs K. S., Stein K. B., Derr R. L.…Brancati F. L. (2008). Long-term all-cause mortality in cancer patients with preexisting diabetes mellitus: A systematic review and meta-analysis. Journal of the American Medical Association, 300, 2754–2764. doi:10.1001/jama.2008.824 [DOI] [PMC free article] [PubMed] [Google Scholar]
- Buchholz K. R., Stephens R. S. (2008). The cytosolic pattern recognition receptor NOD1 induces inflammatory interleukin-8 during Chlamydia trachomatis infection. Infection and Immunity, 76, 3150–3155. doi:110.1128/IAI.00104-00108 [DOI] [PMC free article] [PubMed] [Google Scholar]
- Butler S. O., Btaiche I. F., Alaniz C. (2005). Relationship between hyperglycemia and infection in critically ill patients. Pharmacotherapy, 25, 963–976. [DOI] [PubMed] [Google Scholar]
- Campisi J., d’Adda di Fagagna F. (2007). Cellular senescence: When bad things happen to good cells. Nature Reviews. Molecular Cell Biology, 8, 729–740. [DOI] [PubMed] [Google Scholar]
- Centers for Disease Control and Prevention. (2014). National diabetes statistics report: Estimates of diabetes and its burden in the United States, 2014. Atlanta, GA: U.S. Department of Health & Human Services; Retrieved November 4, 2015, from http://diabetes.niddk.nih.gov/DM/PUBS/statistics/#i_people [Google Scholar]
- Derr R. L., Hsiao V. C., Saudek C. D. (2008). Antecedent hyperglycemia is associated with an increased risk of neutropenic infections during bone marrow transplantation. Diabetes Care, 31, 1972–1977. [DOI] [PMC free article] [PubMed] [Google Scholar]
- Einhorn L. H., Grunberg S. M., Rapoport B., Rittenberg C., Feyer P. (2011). Antiemetic therapy for multiple-day chemotherapy and additional topics consisting of rescue antiemetics and high-dose chemotherapy with stem cell transplant: Review and consensus statement. Support Care Cancer, 19, S1–S4. doi:10.1007/s00520-010-0920-z [DOI] [PubMed] [Google Scholar]
- Giovannucci E., Harlan D. M., Archer M. C., Bergenstal R. M., Gapstur S. M., Habel L. A., Yee D. (2010). Diabetes and cancer: A consensus report. Diabetes Care, 33, 1674–1685. [DOI] [PMC free article] [PubMed] [Google Scholar]
- Godbout J. P., Glaser R. (2006). Stress-induced immune dysregulation: Implications for wound healing, infectious disease and cancer. Journal of NeuroImmune Pharmacology, 1, 421–427. [DOI] [PubMed] [Google Scholar]
- Hammer M. J., Casper C., Gooley T. A., O’Donnell P. V., Boeckh M., Hirsch I. B. (2009). The contribution of malglycemia to mortality among allogeneic hematopoietic cell transplant recipients. Biology of Blood and Marrow Transplantation, 15, 344–351. doi:10.1016/j.bbmt.2008.12.488 [DOI] [PMC free article] [PubMed] [Google Scholar]
- Jenkins D. J., Kendall C. W., Augustin L. S., Franceschi S., Hamidi M., Marchie A.…Axelsen M. (2002). Glycemic index: Overview of implications in health and disease. American Journal of Clinical Nutrition, 76, 266S–273S. [DOI] [PubMed] [Google Scholar]
- Joshi R., Patel S., Wert Y., Parvathaneni A., Cheriyath P. (2014). Decreased mortality with tight glycemic control in critically ill patients: A retrospective analysis in a large community hospital system. Endocrine Practice, 1–27. doi:10.4158/ep13374.or [DOI] [PubMed] [Google Scholar]
- Katz A. (2007). Modulation of glucose transport in skeletal muscle by reactive oxygen species. Journal of Applied Physiology, 102, 1671–1676. doi:10.1152/japplphysiol.01066.2006 [DOI] [PubMed] [Google Scholar]
- Lanza I. R., Nair K. S. (2009). Muscle mitochondrial changes with aging and exercise. American Journal of Clinical Nutrition, 89, 467S–471S. doi:10.3945/ajcn.2008.26717D [DOI] [PMC free article] [PubMed] [Google Scholar]
- Lanza I. R., Short D. K., Short K. R., Raghavakaimal S., Basu R., Joyner M. J.…Nair K. S. (2008). Endurance exercise as a countermeasure for aging. Diabetes, 57, 2933–2942. doi:10.2337/db08-0349 [DOI] [PMC free article] [PubMed] [Google Scholar]
- Le Lay S., Simard G., Martinez M. C., Andriantsitohaina R. (2014). Oxidative stress and metabolic pathologies: From an adipocentric point of view. Oxidative Medicine & Cellular Longevity, 2014, 908539 doi:10.1155/2014/908539 [DOI] [PMC free article] [PubMed] [Google Scholar]
- Makki K., Froguel P., Wolowczuk I. (2013). Adipose tissue in obesity-related inflammation and insulin resistance: Cells, cytokines, and chemokines. International Scholarly Research Notices (ISRN)—Inflammation, 2013, 139239 doi:10.1155/2013/139239 [DOI] [PMC free article] [PubMed] [Google Scholar]
- Martin-Salces M., de Paz R., Canales M. A., Mesejo A., Hernandez-Navarro F. (2008). Nutritional recommendations in hematopoietic stem cell transplantation. Nutrition, 24, 769–775. doi:10.1016/j.nut.2008.02.021 [DOI] [PubMed] [Google Scholar]
- Mazali F. C., Lalli C. A., Alves-Filho G., Mazzali M. (2008). Posttransplant diabetes mellitus: Incidence and risk factors. Transplantation Proceedings, 40, 764–766. doi:10.1016/j.transproceed.2008.03.018 [DOI] [PubMed] [Google Scholar]
- National Institute of Diabetes and Digestive and Kidney Diseases. (2013). Overweight and obesity statistics. Retrieved from http://win.niddk.nih.gov/publications/PDFs/stat904z.pdf
- Nichols W. G. (2003). Management of infectious complications in the hematopoietic stem cell transplant recipient. Journal of Intensive Care Medicine, 18, 295–312. [DOI] [PubMed] [Google Scholar]
- Oyer D. S., Shah A., Bettenhausen S. (2006). How to manage steroid diabetes in the patient with cancer. Journal of Supportive Oncology, 4, 479–483. [PubMed] [Google Scholar]
- Perez A., Jansen-Chaparro S., Saigi I., Bernal-Lopez M. R., Minambres I., Gomez-Huelgas R. (2014). Glucocorticoid-induced hyperglycemia. Journal of Diabetes, 6, 9–20. doi:10.1111/1753-0407.12090 [DOI] [PubMed] [Google Scholar]
- R Core Team. (2015). R: A language and environment for statistical computing. R Foundation for Statistical Computing, Vienna, Austria. Retrieved from https://www.R-project.org/
- Roumen C., Blaak E. E., Corpeleijn E. (2009). Lifestyle intervention for prevention of diabetes: Determinants of success for future implementation. Nutrition Reviews, 67, 132–146. doi:10.1111/j.1753-4887.2009.00181.x [DOI] [PubMed] [Google Scholar]
- Scuteri A., Laurent S., Cucca F., Cockcroft J., Cunha P. G., Manas L. R.…Nilsson P. M. (2014). Metabolic syndrome across Europe: Different clusters of risk factors. European Journal of Preventive Cardiology. doi:10.1177/2047487314525529 [DOI] [PMC free article] [PubMed] [Google Scholar]
- Sheean P., Braunschweig C. (2006). The incidence and impact of dextrose dose on hyperglycemia from parenteral nutrition (PN) exposure in hematopoietic stem cell transplant (HSCT) recipients. JPEN—Journal of Parenteral and Enteral Nutrition, 30, 345–350. [DOI] [PubMed] [Google Scholar]
- Sorror M. L., Maris M. B., Storb R., Baron F., Sandmaier B. M., Maloney D. G., Storer B. (2005). Hematopoietic cell transplantation (HCT)-specific comorbidity index: A new tool for risk assessment before allogeneic HCT. Blood, 106, 2912–2919. doi:10.1182/blood-2005-05-2004 [DOI] [PMC free article] [PubMed] [Google Scholar]
- Tchkonia T., Zhu Y., van Deursen J., Campisi J., Kirkland J. L. (2013). Cellular senescence and the senescent secretory phenotype: Therapeutic opportunities. Journal of Clinical Investigation, 123, 966–972. doi:10.1172/jci64098 [DOI] [PMC free article] [PubMed] [Google Scholar]
- Turina M., Christ-Crain M., Polk H. C., Jr (2006). Diabetes and hyperglycemia: Strict glycemic control. Critical Care Medicine, 34, S291–S300. [DOI] [PubMed] [Google Scholar]
- Vischer U. M., Bauduceau B., Bourdel-Marchasson I., Blickle J. F., Constans T., Fagot-Campagna A.…Doucet J. (2009). A call to incorporate the prevention and treatment of geriatric disorders in the management of diabetes in the elderly. Diabetes & Metabolism, 35, 168–177. doi:10.1016/j.diabet.2009.02.003 [DOI] [PubMed] [Google Scholar]
- Willi S. M., Kennedy A., Wallace P., Ganaway E., Rogers N. L., Garvey W. T. (2002). Troglitazone antagonizes metabolic effects of glucocorticoids in humans: Effects on glucose tolerance, insulin sensitivity, suppression of free fatty acids, and leptin. Diabetes, 51, 2895–2902. [DOI] [PubMed] [Google Scholar]
- Zhang W. X., Zhao Q. Y., Huang H. Q. (2015). Febrile neutropenic infection occurred in cancer patients undergoing autologous peripheral blood stem cell transplantation. Transplantation Proceedings, 47, 523–527. doi:10.1016/j.transproceed.2015.01.013 [DOI] [PubMed] [Google Scholar]