

Abstract
Linear models offer a robust, flexible, and computationally efficient set of tools for modeling quantitative structure activity relationships (QSAR), but have been eclipsed in performance by non-linear methods. Support vector machines (SVMs) and neural networks are currently among the most popular and accurate QSAR methods because they learn new representations of the data that greatly improve modelability. In this work we use shallow representation learning to improve the accuracy of L1 regularized logistic regression (LASSO) and meet the performance of Tanimoto SVM. We embedded chemical fingerprints in Euclidean space using Tanimoto (aka Jaccard) similarity kernel principal components analysis (KPCA), and compared the effects on LASSO and SVM model performance for predicting the binding activities of chemical compounds against 102 virtual screening targets. We observed similar performance and patterns of improvement for LASSO and SVM. We also empirically measured model training and cross validation times to show that KPCA used in concert with LASSO classification is significantly faster than linear SVM over a wide range of training set sizes. Our work shows that powerful linear QSAR methods can match nonlinear methods, and demonstrates a modular approach to non-linear classification that greatly enhances QSAR model prototyping facility, flexibility, and transferability.
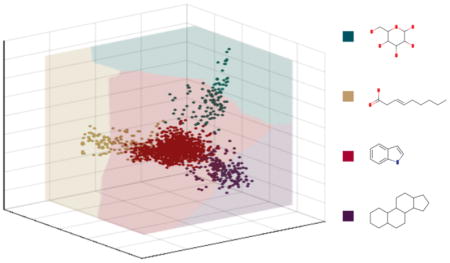
Graphical Abstract
INTRODUCTION
Since its introduction over 50 years ago, quantitative structure activity relationship (QSAR) modeling has become an indispensible tool for drug development.1, 2 A powerful application of QSAR is ligand based virtual screening, where predictive models are built from experimental data and used to mine chemical libraries for promising lead compounds.3, 4 Common screening objectives include molecular properties that influence ADME profiles,5 activity against desired therapeutic targets, and liability against targets that contribute to adverse drug reactions (ADRs).6, 7 The diversity of targets, objectives, and constraints make virtual screening challenging and complex.
The most straightforward approach is similarity-based virtual screening.8 Library compounds are compared to a reference set of known active molecules, and those similar above some threshold are selected as putative leads. 2D chemical fingerprints and Tanimoto similarity are the most popular representations for assessing similarity.9 These methods are (1) versatile-- because they admit any representation that supports comparison, and (2) efficient--because they are non-parametric and do not require fitting models or hyper parameters. However, they are limited because they summarize similarity as a scalar quantity, and do not have sufficient granularity to capture the precise features that drive critical similarities and differences.10
Linear models give granular insight into structure activity relationships by learning quantitative rules that relate specific substructural features to biological activities.11 Since their early application in QSAR, linear modeling techniques have been refined and optimized extensively.12–14 Today many robust implementations are available for popular models such as logistic regression, principal components analysis (PCA),15 and partial least squares (PLS).16 A limitation of linear methods for QSAR is their use of the dot product, which is less discriminative than non-linear Tanimoto similarity for sparse bit vectors like chemical fingerprints.17 Consequently, non-linear methods such as support vector machine (SVM),18, 19 neural networks,18, 20, 21 random forests,22 and influence relevance voting (IRV),23 often eclipse the performance of linear QSAR methods and make them appear uncompetitive, despite the availability of efficient, accessible, mature techniques and associated software implementations.
In particular, Support Vector Machines (SVMs) are frequently used for non-linear QSAR.19 They combine the strengths of similarity search and linear models by using non-linear similarity functions to map data into high dimensional vector spaces.24 A key advantage of SVM is that task-specific prior information can be used to choose a kernel and representation that gives a favorable non-linear abstraction (e.g. Tanimoto similarity for 2D fingerprints).25 However, SVMs also have a number of limitations: models may take a long time to train or have convergence issues, hyperparameter adjustments can be difficult and time consuming, and limited custom kernel support complicates workflows and limits the transferability of the methods.26, 27
Kernel principal components analysis (KPCA) is a nonlinear embedding technique closely related to SVM.24, 28 KPCA takes a set of data examples and a positive definite measure of similarity, and returns a set of continuous vector representations whose dot products give minimum error regularized estimates of the similarity measure. Of course, it shares the qualities of classical PCA: features of the transformed data are uncorrelated and ordered by their explanatory power, and new data can be projected into the subspace spanned by the training examples.
Our work is motivated by the hypothesis that KPCA allows us to access the non-linear abstraction of our data in the hidden layer and extend it to other machine learning models.25 We train sparse logistic regression models on KPCA embedded chemical fingerprints and show significant improvements in accuracy. We use KPCA embedded vectors to train Tanimoto SVM models with an implementation of that does not ordinarily permit use of non-standard kernels. We show that KPCA embedding is surprisingly efficient over a broad range of virtual screening dataset inputs. Our work shows that KPCA embedding makes non-linear QSAR more flexible and transferable, and provides a role for linear models within the broader context of representation learning.29
CONCLUSIONS
We have demonstrated the potential for modularity in non-linear classification enabled by shallow, unsupervised representation learning: we provide nonlinear modeling capabilities in the context of a linear modeling formalism. Any learning architecture must provide two functions: (1) the creation of a useful abstraction of the data, and (2) a method for fitting a model using the data abstraction. Often the embedding step is done implicitly, but this can limit transferability and applicability.2, 51 We show that separating these functions into isolated modules (for QSAR modeling, and in the context of linear models) can greatly enhance speed, facility, and flexibility.29, 52
METHODS
Kernel PCA Embedding
Step 1: Compute Tanimoto similarity matrix
Given a set of data molecules, X= {x1,x2,…,xn} represented as sets of sparse binary indicator features, we can compute the Tanimoto similarity T(xi,xj) using the formula above where 〈xi,xj〉 denotes the dot product of fingerprints xi and xj.
The heart of the “kernel trick” is Mercer’s theorem, which relates the output of certain types of non-linear similarity functions to dot products of vectors ϕ(xi) and ϕ(xj) in a high dimensional space.
Step 2: Compute its eigenvalue decomposition (or SVD)
We factor the Tanimoto similarity matrix with the eigenvalue decomposition (or SVD), and then multiply the eigenvectors (Q) by the singular values (Λ) to return the embedded data Φ(X).
The new features are orthogonal and ordered by variance, and dot products of molecule vectors approximate Tanimoto similarities. We can also smooth the data by discarding low variance features. In general, the first k eigenvalues and eigenvectors give a minimum error rank k approximation of the data. Here ||·||2 is the spectral norm, and Λ(k) denotes the first k singular values of T(X,X).
Step 3: Use the eigenvectors to project data into Tanimoto space
To embed new data points we compute similarity to the points in our training data, and than right multiply by the inverse of our embedded training data.
Software
We built our software in R 3.3.0. We used the glmnet package for LASSO classification,30 and the e1017 (LibSVM) and kernlab packages for SVM.26, 31, 32 We used the caret package to do stratified sampling for cross validation,33 and the ROCR package to compute performance measures.34
Classification Datasets
We tested classification performance using representation-benchmarking dataset assembled by Heikamp et al.35, 36 The active set consists of 75,251 compounds that affect 102 therapeutic targets (ChEMBL IC50 ≤ 10 μM). A number of therapeutic target families (5HT transporters/receptors, carbonic anhydrases, kinases), and exclusionary targets (HERG, CYP family) are represented. The data are grouped into Easy, Intermediate, and Difficult classes based on maxSIM recovery rates. Summary statistics describing the size and diversity of activity class datasets are shown in Table 1. An additional 10,000 compounds from ZINC were also provided as decoys. The data are encoded as ECFP4 and MACCS fingerprints to give contrasting examples of high and low fidelity representations.37, 38
TABLE 1.
Summary information about the benchmarking dataset is shown. The columns labeled “Tc >X” show the percentage of active Tanimoto similarities above cutoffs 0.8 and 0.3 reported by Jasial et al.36 The meanSIM columns shows average recovery rates reported by Heikamp et al.35
| Difficulty Class (# Targets) | # of Compounds Median [Range] | MACCS | ECFP 4 | ||
|---|---|---|---|---|---|
| Tc >0.8 | meanSim | Tc >0.3 | meanSim | ||
| Easy (22) | 116 [50–339] | 16.0% | 74.1% | 38.2% | 89.3% |
| Intermediate (50) | 371 [111–1540] | 5.0% | 42.6% | 10.9% | 69.4% |
| Difficult (30) | 1609 [420–3144] | 1.2% | 13.8% | 4.1% | 27.8% |
Model Training and Classification Accuracy Assessment
We evaluated the classification performance of LASSO and SVM models using AUC, F1-score, and Matthew’s correlation coefficient (MCC). Because the thresholding process used to compute AUC yielded a range of values for F-score and MCC, we report their maxima. We evaluated changes in classification performance (Δp/p0) and error (Δε/ε0) for models trained on KPCA vectors relative to the baseline of linear models trained on 2D fingerprints. We computed the performance measures using a 10-fold cross validation in scheme in which 90% of the data was used to train each fold-specific model, and the remaining 10% was used to evaluate prediction accuracy. For models trained with embedded molecule vectors, KPCA embedding was included in the 10-fold cross validation. We used nested 10-fold cross validation on the training data to tune model hyperparameters. We fit lasso models using the glmnet package with a lambda min ratio of 0.001 and selected the lasso penalty parameter using the one standard error criterion with AUC as the performance metric. For SVM, we used Platt scaling and evaluated the C parameter over six orders of magnitude [10−3,103]. We measured the total training and cross validation times and fit polynomial models for extrapolation.
RESULTS
LASSO Classification
Figure 1 (Top) shows the effect of KPCA embedding on LASSO classification model performance for each of the 108 ChEMBL activity classes. In aggregate, changes in performance were biased toward improvement, but within the expected variation for both MACCS (z-score=0.76) and ECFP4 (z-score=0.26) fingerprints. However, the change in performance was unevenly distributed across virtual screening targets, favoring intermediate and difficult target activity models trained on MACCS fingerprints (Table 2a). Of the ten most significantly affected activity class models (Table 2b), all except Glucocorticoid receptor (GCR) were difficult targets. In general, the relatively small changes in performance (Δp) we observed represented large portions of the maximum possible improvement (Δε). No significant decrease in accuracy (z-score < −1) was observed for any activity class. Performance tables for all individual activity classes and are listed in the Supporting Material.
Figure 1.


Effect of KPCA embedding on LASSO (Top) and SVM (Bottom) classification performance for the 102 activity classes in the benchmarking dataset. Each bar represents a virtual screening target. The heights of dark shaded regions indicate minimum performance. The heights of the light shaded regions indicate maximum performance. The colors of the light shaded regions indicate whether native fingerprints (red) or KPCA embedded fingerprints (blue) yielded better performance. Activity classes are ordered by mean performance.
Table 2a.
Overall changes in LASSO classification performance (Δp) and error (Δε) as well as average z-scores for Tanimoto kernel embedded fingerprints relative to standard MACCS and ECFP4 fingerprints. Note that increasing performance (Δp > 0) corresponds to decreasing error (Δε < 0). Z-score indicates the change in classification performance (Δp) relative to standard error.
| FP Type | Difficulty | ΔpAUC | ΔpF1 | ΔpMCC | ΔεAUC | ΔεpF1 | ΔεMCC | z-score |
|---|---|---|---|---|---|---|---|---|
| MACCS | Easy | 0.20% | 0.37% | 0.62% | −20.6% | −20.5% | −17.7% | 0.10 |
| Intermediate | 0.81% | 1.41% | 2.86% | −35.5% | −28.3% | −27.8% | 0.44 | |
| Difficult | 1.48% | 2.82% | 5.87% | −47.5% | −36.6% | −35.8% | 1.32 | |
| ECFP4 | Easy | 0.00% | 0.23% | 0.23% | 0.36% | −15.7% | −16.1% | 0.05 |
| Intermediate | 0.35% | 0.61% | 1.21% | −30.9% | −23.4% | −23.0% | 0.26 | |
| Difficult | 0.20% | 0.32% | 0.66% | −5.0% | −11.1% | −10.9% | 0.24 |
Table 2b.
Target classes for which Tanimoto kernel embedding yielded the most significant changes in LASSO classification performance (ΔpAUC) and error (ΔεAUC) relative to standard MACCS fingerprints. Asterisks indicate intermediate targets.
| Target (ID) | ΔpAUC | ΔεAUC | z-score |
|---|---|---|---|
| CB2 (259) | 4.0% | −77.5% | 4.84 |
| 5HTT (121) | 2.1% | −69.4% | 4.54 |
| CB1 (87) | 4.1% | −64.3% | 3.78 |
| HSD1 (11489) | 2.7% | −70.6% | 3.75 |
| H3 (10280) | 1.4% | −60.9% | 3.45 |
| 5HT-2a (107) | 3.5% | −67.2% | 3.08 |
| HERG (165) | 3.3% | −48.2% | 2.52 |
| NET (100) | 1.5% | −59.6% | 2.05 |
| GCR (25)* | 2.2% | −50.1% | 2.00 |
| VEGF2 (10980) | 1.1.% | −53.9% | 1.74 |
SVM Classification
Figure 1 (bottom) shows the effect of KPCA embedding on SVM classification performance for each of the 108 ChEMBL activity classes. Overall, they were similar to those observed for LASSO classification. The aggregate change in performance was larger for MACCS (z-score= 0.81) than ECFP4 (z-score=0.11) fingerprints, but within the expected variation for both fingerprint types. Improvements again favored intermediate and difficult activity classes (Table 2c). Small changes in performance represented large portions of the maximum possible improvement. 8 of the top 10 most significantly affected model also showed the biggest improvement for LASSO classification (Table 2d). We did not observe significant differences in performance (z-score < −1) for any activity class. Performance tables for all individual activity classes and are listed in the Supporting Material.
Table 2c.
Overall changes in SVM classification performance (Δp) and error (Δε) as well as average z-scores for Tanimoto kernel embedded fingerprints relative to standard MACCS and ECFP4 fingerprints. Note that increasing performance (Δp > 0) corresponds to decreasing error (Δε < 0). Z-score indicates the change in classification performance (Δp) relative to standard error.
| FP Type | Difficulty | ΔpAUC | ΔpF1 | ΔpMCC | ΔεAUC | ΔεF1 | ΔεMCC | z-score |
|---|---|---|---|---|---|---|---|---|
| MACCS | Easy | 0.13% | 0.10% | 0.18% | 23.1% | −3.15% | −2.78% | 0.03 |
| Intermediate | 0.88% | 1.61% | 3.29% | −48.4% | −39.6% | −39.2% | 0.63 | |
| Difficult | 1.67% | 3.12% | 6.62% | −54.2% | −41.8% | −41.1% | 1.67 | |
| ECFP4 | Easy | 0.00% | 0.02% | 0.03% | 23.0% | −20.7% | −20.7% | 0.03 |
| Intermediate | 0.02% | 0.06% | 0.15% | N/A | −6.25% | 6.12% | 0.05 | |
| Difficult | 0.12% | 0.30% | 0.64% | −17.1% | −20.6% | −20.7% | 0.27 |
Table 2d.
Target classes for which Tanimoto kernel embedding yielded the most significant changes in SVM classification performance (ΔpAUC) and error (ΔεAUC) relative to standard MACCS fingerprints.
| Target (ID) | ΔpAUC | ΔεAUC | z-score |
|---|---|---|---|
| CB2 (259) | 3.7% | −76.1% | 3.77 |
| HSD1 (11489) | 2.7% | −72.4% | 3.51 |
| CB1 (87) | 4.5% | −69.9% | 3.27 |
| 5HT-2a (107) | 3.8% | −68.2% | 2.98 |
| H3 (10280) | 1.5% | −62.6% | 2.23 |
| 5HTT (121) | 2.0% | −65.9% | 2.21 |
| 5HT-1a (51) | 1.5% | −62.5% | 2.16 |
| 5HT-2c (108) | 2.6% | −54.7% | 2.11 |
| HERG (165) | 2.5% | −40.6% | 2.07 |
| NET (100) | 1.8% | −67.2% | 1.94 |
Comparison between LASSO and SVM
Figure 2 shows a direct comparison of LASSO and SVM classification performance for native and embedded fingerprints. SVM generally performed better than the LASSO, however differences in performance were dependent on the representation used to train the models. Native ECFP4 fingerprints gave the largest difference in accuracy (z-score=0.76). The effect was most pronounced for difficult targets (Table 3a), and a number of individual models showed differences in performance above the expected variation (Table 3b). The difference in performance was much smaller for native MACCS fingerprints (z-score=0.21). Here the effect was more evenly distributed across easy, intermediate, and difficult targets (Table 3a), and no individual target had a z-score > 1. Tanimoto KPCA embedding had the effect of reducing the gap in performance between SVM ad LASSO models for ECFP4 (z-score=0.57), while doing the opposite for MACCS (z-score=0.31). In both cases, the effect was concentrated in the intermediate and difficult classes (Table 3c,d). We also compared F1-scores for SVM and LASSO classification models trained on KPCA embedded fingerprints with the results for Tanimoto SVM reported by Balfer et al on Dopamine-D2 receptor (72), Cannabinoid CB2 receptor (259), and MAP Kinase P38 receptor (10188) activity classes.17 An F-test showed no significant difference (p=0.96).
Figure 2.

Comparison of LASSO and SVM models trained on (Top) native and (Bottom) embedded fingerprints for the 102 activity classes in the benchmarking dataset. Dark shaded regions indicate min performance. Light shaded regions indicate max performance. Colors indicate whether (Red) LASSO or (Blue) SVM performed better. Activity classes are ordered by mean performance.
Table 3a.
Comparison of LASSO and SVM classification performance (Δp) and error (Δε) as well as average z-scores for native MACCS and ECFP4 fingerprints.
| FP Type | Difficulty | ΔpAUC | ΔpF1 | ΔpMCC | ΔεAUC | ΔεF1 | ΔεMCC | z-score |
|---|---|---|---|---|---|---|---|---|
| MACCS | Easy | 0.35% | 0.81% | 1.53% | −39.6% | −50.0% | −49.6% | 0.23 |
| Intermediate | 0.39% | 0.81% | 1.72% | −13.0% | −16.2% | −16.1% | 0.21 | |
| Difficult | 0.07% | 0.49% | 1.03% | −1.18% | −7.23% | −7.07% | 0.18 | |
| ECFP4 | Easy | 0.62% | 1.11% | 2.27% | −53.3% | −61.9% | −61.9% | 0.33 |
| Intermediate | 0.68% | 1.58% | 3.20% | −74.2% | −68.2% | −68.0% | 0.73 | |
| Difficult | 0.51% | 1.30% | 2.68% | −60.0% | −49.7% | −49.6% | 1.08 |
Table 3b.
Target classes for which SVM shows the most significant changes in classification performance (ΔpAUC) and error (ΔεAUC) relative to LASSO classification for standard ECFP4 fingerprints.
| Target (ID) | ΔpAUC | ΔεAUC | z-score |
|---|---|---|---|
| GCPR44 (20174) | 0.39% | −97.1% | 1.32 |
| c-SRC (10434) | 0.86% | −92.0% | 1.31 |
| HERG (165) | 0.58% | −41.5% | 1.26 |
| MAPK14 (10188) | 0.40% | −72.1% | 1.24 |
| D4 (90) | 0.63% | −67.1% | 1.21 |
| D2 (72) | 0.30% | −68.7% | 1.19 |
| NET (100) | 0.46% | −58.5% | 1.19 |
| COX2 (126) | 0.42% | −71.8% | 1.12 |
| NPY5R (11336) | 0.15% | −98.1% | 1.10 |
| ACHE (93) | 0.47% | −69.1% | 1.09 |
Table 3c.
Comparison of LASSO and SVM classification performance (Δp) and error (Δε) as well as average z-scores for KPCA embedded MACCS and ECFP4 fingerprints.
| FP Type | Difficulty | ΔpAUC | ΔpF1 | ΔpMCC | ΔεAUC | ΔεF1 | ΔεMCC | z-score |
|---|---|---|---|---|---|---|---|---|
| MACCS | Easy | 0.27% | 0.53% | 1.07% | −33.5% | −42.8% | −41.5% | 0.20 |
| Intermediate | 0.44% | 1.00% | 2.07% | −30.4% | −24.6% | −24.3% | 0.33 | |
| Difficult | 0.24% | 0.74% | 1.53% | −15.6% | −16.8% | −16.3% | 0.35 | |
| ECFP4 | Easy | 0.63% | 0.90% | 1.84% | −52.4% | −47.1% | −46.8% | 0.28 |
| Intermediate | 0.35% | 1.04% | 2.14% | −49.0% | −56.0% | −55.8% | 0.51 | |
| Difficult | 0.42% | 1.28% | 2.68% | −52.4% | −51.8% | −51.7% | 0.87 |
Table 3d.
Target classes for which SVM shows the most significant changes in classification performance (ΔpAUC) and error (ΔεAUC) relative to LASSO classification for KPCA embedded ECFP4 fingerprints.
| Target (ID) | ΔpAUC | ΔεAUC | z-score |
|---|---|---|---|
| NPY5R (11336) | 2.92% | −60.5% | 1.36 |
| PTK2 (11242) | 1.92% | −97.7% | 1.16 |
| ACHE (93) | 0.43% | −69.3% | 1.14 |
| CYP2C9 (12911) | 4.61% | −59.2% | 1.14 |
| CA1 (10193) | 0.30% | −74.9% | 1.13 |
| 5HT-2a (107) | 0.34% | −68.5% | 1.11 |
| CYP3A4 (17045) | 1.76% | −52.1% | 0.94 |
| A2A (52) | 1.09% | −57.3% | 0.93 |
| VEGF2 (10980) | 0.10% | −75.8% | 0.91 |
| CYP19A1 (65) | 0.25% | −80.0% | 0.91 |
Computation Time
Figure 3 shows the activity class size and total cross validation times for non-linear LASSO and linear SVM. KPCA embedding combined with lasso training was faster than linear SVM trained on 2D fingerprints for all input sizes and fingerprint types. The speed up ranged from negligible for smaller inputs to an order of magnitude for the largest inputs tested. We observed that the computation time of linear SVM scaled much better with ECFP4 than MACCS fingerprints. Fingerprint type did not significantly impact the compute times for KPCA embedded models. Extrapolation from polynomial models (Table 4) predicted that linear SVM would overtake non-linear LASSO at and input size of 19,077 compounds for ECFP4, and 484,673 compounds for MACCS.
Figure 3.

Comparison of 10-fold training and cross validation times for Linear SVM and KPCA LASSO classification for the 102 activity classes in the benchmarking dataset. The x-axis shows training set size, and y-axis shows total processor time. Trend lines were fit with smoothing splines.
Table 4.
Fitted coefficients and p-values for polynomial models relating training set size to observed 10 fold cross validation times for KPCA/LASSO and Linear SVM classification with ECFP4 fingerprints.
| SVM/ECFP4 (R2 = 0.98) | Input | Coefficient | P-value |
| n | 6.62 × 10⁻¹ | < 0.01 | |
| n2 | 5.15 × 10⁻⁴ | < 0.01 | |
| LASSO/KPCA (R2 = 0.99) | n | 6.52 × 10⁻² | < 0.01 |
| n2 | −1.69 × 10⁻⁵ | 0.09 | |
| n3 | 2 × 10⁻⁸ | < 0.01 |
DISCUSSION
Tanimoto KPCA embedding improves LASSO and Linear SVM performance
Our results (Figure 1) show that non-linear embedding of chemical fingerprints using KPCA improves LASSO (Table 2) and SVM (Table 2c) classification performance for a number of important virtual screening targets. The magnitude of the performance gains we observed were relatively small, but meaningful when considered in the context of the large chemical libraries, which order on the number of tens of millions of molecules,39 where small reductions in error can equate to hundreds or thousands of fewer misclassified compounds. The targets in our dataset fall into a number of families that commonly participate in ADRs, such as ion and neurotransmitter transporters (HERG, 5HTT, NET); G-protein coupled receptors (CB1, CB2, H3); nuclear receptors (GCR); and enzymes (HSD1, VEGFR2).7 Among these, the difficult targets are critical because they are highly promiscuous, and thus the most likely causes of safety related attrition from off target effects; and it was here that non-linear embedding delivered the greatest improvements in performance (Tables 2b, 2d). Furthermore, while Tanimoto KPCA embedding did not improve classification performance on all targets, it never significantly hurt performance.
Effects of KPCA embedding depend on the properties of the underlying representation
The smaller effect size for ECFP4 fingerprints can be explained by the underlying hashing scheme employed in the fingerprint generation process. Often referred to as “feature hashing” or the “hashing trick”, the practice of using hash table values to efficiently represent extremely sparse, high-dimensional data is a common optimization for natural language models, SVMs in particular.40, 41 Thus, ECFP4 fingerprints can be considered to be highly optimized for linear models, and almost uniquely tailored for linear SVMs. KPCA embedding brought the performance of models trained on MACCS closer to those trained on ECFPs. This implies that the high dimensional feature space of ECFPs may not capture significantly more classification relevant information than the 166 structural keys of MACCS, so much as represent it in a way such that relationships between data are linear. The improvement from KPCA embedding observed for MACCS can similarly be attributed to representing the data in a way such that similarity relationships between molecules are linear. Thus, for ECFP4 fingerprints, which are already highly optimized for linear properties, the effects were limited. Our results suggest that KPCA embedding is most useful in combination with compact, “lo-fi”, SMILES based representations that are not highly optimized for linear classification, such as MACCS and LINGOS.42, 43
LASSO models trained with embedded fingerprints are comparable to Tanimoto SVM
Our results show that embedding fingerprints with Tanimoto KPCA improves LASSO performance such that it is virtually equivalent to Tanimoto SVM (Figure 2). While performance was biased in favor of SVM models, the differences were within the standard error for all but a few cases (Table 3). For those, SVM models already significantly outperformed LASSO models when trained on native fingerprints, and Euclidean embedding of chemical structures narrowed the gap in performance. The marginally better performance of SVM relative to comparable LASSO models can be explained by the difference in how each fits a separating hyperplane. LASSO classification selects a subset of features, and considers all of the data examples, even those far from the decision boundary, when computing an optimally separating hyperplane. SVM maps the data to a high dimensional feature space, and considers only a subset of examples near the class boundary. Thus, SVM models tend to perform better near class boundaries, but the overall contribution to accuracy is small because points are unlikely to fall in the affected regions.
KPCA/LASSO classification is significantly faster than linear SVM for ADR target datasets
Our observation that LASSO classification with KPCA embedded fingerprints was much faster than linear SVM (Figure 3) is counterintuitive given the theoretical complexity of KPCA O(n3) is greater than SVM O(n2). This can be explained by two factors: the absence of KPCA hyperparameters, and the size of the datasets. KPCA has no hyperparameters to optimize, thus it is a one-time cost. Grid search for tuning SVM hyperparameters can require on the order of hundreds of model fits, which inflates the total computational cost up to an equivalent factor. The result is a range of inputs where KPCA is faster than training an accurate SVM model, even when it is much slower than fitting a single unoptimized SVM model. We expect SVM to overtake KPCA/LASSO at large enough scale, however it is unclear when that will happen. Our polynomial models (Table 4) provide rough estimates, but like most extrapolations they are subject to wide confidence intervals. In the limit of largest most diverse activity class in our dataset (HERG), KPCA was still two orders of magnitude faster than linear SVM. Our results highlight an important caveat to keep in mind when considering theoretical guarantees: they may omit non-trivial application details that significantly affect empirical performance measurements, thus asymptotic limits may not apply to a range of relevant problem sizes.
Implications for deep and shallow learning
Much of the recent interest in data embedding (particularly in the deep neural network learning community) stems from the idea that deep and shallow learning architectures generate their effects by learning new distributed representations of the data in their hidden layers.25 Neural network embedded chemical fingerprints have shown promise, but share limitations common to deep learning: Models are computationally expensive and difficult to train, and hyperparameters like the learning rate, smoothing parameters, and model architecture must be tuned for each application.20, 44, 45 Shallow learning offers a simpler and more robust alternative, but with limitations. Restricting network depth makes training easier and more efficient, but limits the expressiveness of the range of nonlinear representations that can be learned. While the added expressiveness of the representations learned by deep neural networks generally accounts for their superiority in complex learning tasks, selection of an appropriate kernel using prior knowledge can allow us to obtain favorable tradeoffs in efficiency and expressivity. Thus, “shallow” learning as embodied by our methods and SVM may be preferred tasks for which the user has specific a priori understanding of the feature space; and deep learning may be preferable for tasks involving extremely large datasets, for which the user lacks confidence about the most appropriate representation or similarity function.
Considerations for KPCA embedding
The choice of the kernel and underlying data representation are the two most important metaparameters for KPCA, and most effectively selected on the basis of prior knowledge and intuition. For this work, we used Tanimoto similarity because of its recognized utility as similarity measure for 2D chemical fingerprints. Alternatively if the data were continuous and real valued, as in the case of whole molecule descriptors, a radial basis function or polynomial kernel would be more appropriate. For distance based modeling approaches such as k-means clustering, we might use classical multidimensional scaling (MDS), a particular type of KPCA that preserves distances.28, 46 It should be noted that while classical MDS and PCA are equivalent up to an orthogonal rotation around the origin, this is not the case for other distance/similarity metric pairs. The biggest limitations of KPCA are the memory and time requirements, which are O(n2) and O(n3) respectively. We have shown that for the range of problems we have addressed, these are not prohibitive; however for much larger problems a number of optimizations such as matrix sketching,47 non-random sampling,48 and ensemble approaches49 are available as well as distributed and streaming versions of KPCA.50
Supplementary Material
Acknowledgments
Funding Sources
SER and RBA are supported by NIH grants GM102365 and GM61374. RBA is also supported by EB020405.
We thank Stanford University and the Bioengineering department for their support, and T. Liu, E. Mallory, B. Percha, A. Gottlieb, and W. Zhou as well as the editor for helpful discussions and guidance.
ABBREVIATIONS
- RF
Random Forest
- SVM
Support Vector Machine
- PCA
Principal Components Analysis
- KPCA
Kernel Principal Components Analysis
- IRV
Influence Relevance Voting
- LASSO
Least Absolute Shrinkage Selection Operator
Footnotes
Author Contributions
SER conducted the research and analysis. SR and RBA planned the research and wrote the manuscript together.
Notes
The authors declare no competing financial interest.
This information is available free of charge via the internet at http://pubs.acs.org. Tables displaying classification accuracy (AUC, F-Score, MCC) for individual activity classes for all experimental conditions. (.docx)
References
- 1.Hansch C, Maloney PP, Fujita T. Correlation of Biological Activity of Phenoxyacetic Acids with Hammett Substituent Constants and Partition Coefficients. Nature. 1962;194:178. [Google Scholar]
- 2.Cherkasov A, Muratov EN, Fourches D, Varnek A, Baskin II, Cronin M, Dearden J, Gramatica P, Martin YC, Todeschini R. QSAR modeling: where have you been? Where are you going to? J Med Chem. 2014;57:4977–5010. doi: 10.1021/jm4004285. [DOI] [PMC free article] [PubMed] [Google Scholar]
- 3.Walters WP, Stahl MT, Murcko MA. Virtual screening - an overview. Drug Discov Today. 1998;3:160–178. [Google Scholar]
- 4.Shoichet BK. Virtual screening of chemical libraries. Nature. 2004;432:862–5. doi: 10.1038/nature03197. [DOI] [PMC free article] [PubMed] [Google Scholar]
- 5.Hansch C, Leo A, Mekapati SB, Kurup A. QSAR and ADME. Bioorg Med Chem. 2004;12:3391–400. doi: 10.1016/j.bmc.2003.11.037. [DOI] [PubMed] [Google Scholar]
- 6.Hughes JP, Rees S, Kalindjian SB, Philpott KL. Principles of early drug discovery. Br J Pharmacol. 2011;162:1239–49. doi: 10.1111/j.1476-5381.2010.01127.x. [DOI] [PMC free article] [PubMed] [Google Scholar]
- 7.Bowes J, Brown AJ, Hamon J, Jarolimek W, Sridhar A, Waldron G, Whitebread S. Reducing safety-related drug attrition: the use of in vitro pharmacological profiling. Nat Rev Drug Discov. 2012;11:909–922. doi: 10.1038/nrd3845. [DOI] [PubMed] [Google Scholar]
- 8.Willett P. Similarity-based approaches to virtual screening. Biochem Soc Trans. 2003;31:603–6. doi: 10.1042/bst0310603. [DOI] [PubMed] [Google Scholar]
- 9.Willett P. Similarity-based virtual screening using 2D fingerprints. Drug Discov Today. 2006;11:1046–1053. doi: 10.1016/j.drudis.2006.10.005. [DOI] [PubMed] [Google Scholar]
- 10.Eckert H, Bajorath J. Molecular similarity analysis in virtual screening: foundations, limitations and novel approaches. Drug Discov Today. 2007;12:225–33. doi: 10.1016/j.drudis.2007.01.011. [DOI] [PubMed] [Google Scholar]
- 11.Free SM, Jr, Wilson JW. A Mathematical Contribution to Structure-Activity Studies. J Med Chem. 1964;7:395–9. doi: 10.1021/jm00334a001. [DOI] [PubMed] [Google Scholar]
- 12.Hoerl AE, Kennard RW. Ridge Regression - Biased Estimation for Nonorthogonal Problems. Technometrics. 1970;12:55. [Google Scholar]
- 13.Friedman J, Hastie T, Tibshirani R. The elements of statistical learning. Vol. 1 Springer; Berlin: 2001. Springer series in statistics. [Google Scholar]
- 14.Tibshirani R. Regression shrinkage and selection via the lasso: a retrospective. Journal of the Royal Statistical Society Series B-Statistical Methodology. 2011;73:273–282. [Google Scholar]
- 15.Dunteman GH. Principal components analysis. Sage; 1989. [Google Scholar]
- 16.Wold H. Encyclopedia of statistical sciences. 1985. Partial least squares. [Google Scholar]
- 17.Balfer J, Bajorath J. Visualization and Interpretation of Support Vector Machine Activity Predictions. J Chem Inf Model. 2015;55:1136–47. doi: 10.1021/acs.jcim.5b00175. [DOI] [PubMed] [Google Scholar]
- 18.Byvatov E, Fechner U, Sadowski J, Schneider G. Comparison of support vector machine and artificial neural network systems for drug/nondrug classification. J Chem Inf Comput Sci. 2003;43:1882–9. doi: 10.1021/ci0341161. [DOI] [PubMed] [Google Scholar]
- 19.Heikamp K, Bajorath J. Support vector machines for drug discovery. Expert Opin Drug Discov. 2014;9:93–104. doi: 10.1517/17460441.2014.866943. [DOI] [PubMed] [Google Scholar]
- 20.Duvenaud DK, Maclaurin D, Iparraguirre J, Bombarell R, Hirzel T, Aspuru-Guzik A, Adams RP. Convolutional networks on graphs for learning molecular fingerprints. In Advances in neural information processing systems. 2015;2015:2224–2232. [Google Scholar]
- 21.Lusci A, Pollastri G, Baldi Deep Learning in Chemoinformatics: The Prediction of Aqueous Solubility for Drug-Like Molecules. J Chem Inf Model. 2013;53:1563–1575. doi: 10.1021/ci400187y. [DOI] [PMC free article] [PubMed] [Google Scholar]
- 22.Svetnik V, Liaw A, Tong C, Culberson JC, Sheridan RP, Feuston BP. Random forest: a classification and regression tool for compound classification and QSAR modeling. J Chem Inf Comput Sci. 2003;43:1947–58. doi: 10.1021/ci034160g. [DOI] [PubMed] [Google Scholar]
- 23.Lusci A, Fooshee D, Browning M, Swamidass J, Baldi P. Accurate and efficient target prediction using a potency-sensitive influence-relevance voter. J Cheminf. 2015;7:63. doi: 10.1186/s13321-015-0110-6. [DOI] [PMC free article] [PubMed] [Google Scholar]
- 24.Hofmann T, Scholkopf B, Smola AJ. Kernel methods in machine learning. Ann Math Stat. 2008;36:1171–1220. [Google Scholar]
- 25.Bengio Y. Learning deep architectures for AI. Foundations and trends® in Machine Learning. 2009;2:1–127. [Google Scholar]
- 26.Karatzoglou A, Smola A, Hornik K, Zeileis A. kernlaban S4 package for kernel methods in R. 2004. [Google Scholar]
- 27.Cawley GC, Talbot NLC. On Over-fitting in Model Selection and Subsequent Selection Bias in Performance Evaluation. Journal of Machine Learning Research. 2010;11:2079–2107. [Google Scholar]
- 28.Schölkopf B, Smola A, Müller K-R. Kernel principal component analysis. International Conference on Artificial Neural Networks; 1997; Springer; 1997. pp. 583–588. [Google Scholar]
- 29.Bengio Y, Courville A, Vincent P. Representation learning: A review and new perspectives. IEEE transactions on pattern analysis and machine intelligence. 2013;35:1798–1828. doi: 10.1109/TPAMI.2013.50. [DOI] [PubMed] [Google Scholar]
- 30.Friedman J, Hastie T, Tibshirani R. glmnet: Lasso and elastic-net regularized generalized linear models. R package version. 2009:1. [Google Scholar]
- 31.Chang CC, Lin CJ. LIBSVM: A Library for Support Vector Machines. Acm Transactions on Intelligent Systems and Technology. 2011;2:27. [Google Scholar]
- 32.Meyer D, Dimitriadou E, Hornik K, Weingessel A, Leisch F. e1071: Misc Functions of the Department of Statistics (e1071) In: Wien TU, editor. R package version 1.6–3. 2014. Retrieved from. [Google Scholar]
- 33.Kuhn M. Building Predictive Models in R Using the caret Package. Journal of Statistical Software. 2008;28:1–26. [Google Scholar]
- 34.Sing T, Sander O, Beerenwinkel N, Lengauer T. ROCR: visualizing classifier performance in R. Bioinformatics. 2005;21:3940–1. doi: 10.1093/bioinformatics/bti623. [DOI] [PubMed] [Google Scholar]
- 35.Heikamp K, Bajorath J. Large-scale similarity search profiling of ChEMBL compound data sets. J Chem Inf Model. 2011;51:1831–9. doi: 10.1021/ci200199u. [DOI] [PubMed] [Google Scholar]
- 36.Jasial S, Hu Y, Vogt M, Bajorath J. Activity-relevant similarity values for fingerprints and implications for similarity searching. F1000Res. 2016:5. doi: 10.12688/f1000research.8357.1. [DOI] [PMC free article] [PubMed] [Google Scholar]
- 37.Rogers D, Hahn M. Extended-connectivity fingerprints. J Chem Inf Model. 2010;50:742–54. doi: 10.1021/ci100050t. [DOI] [PubMed] [Google Scholar]
- 38.Durant JL, Leland BA, Henry DR, Nourse JG. Reoptimization of MDL keys for use in drug discovery. J Chem Inf Model. 2002;42:1273–1280. doi: 10.1021/ci010132r. [DOI] [PubMed] [Google Scholar]
- 39.Irwin JJ, Shoichet BK. ZINC - A free database of commercially available compounds for virtual screening. J Chem Inf Model. 2005;45:177–182. doi: 10.1021/ci049714. [DOI] [PMC free article] [PubMed] [Google Scholar]
- 40.Langford J, Li L, Strehl A. Technical report. 2007 http://hunch.net.
- 41.Weinberger K, Dasgupta A, Langford J, Smola A, Attenberg J. Feature hashing for large scale multitask learning. Proceedings of the 26th Annual International Conference on Machine Learning; 2009; ACM; 2009. pp. 1113–1120. [Google Scholar]
- 42.Vidal D, Thormann M, Pons M. LINGO, an efficient holographic text based method to calculate biophysical properties and intermolecular similarities. J Chem Inf Model. 2005;45:386–93. doi: 10.1021/ci0496797. [DOI] [PubMed] [Google Scholar]
- 43.Jastrzębski S, Leśniak D, Czarnecki WM. Learning to SMILE (s) 2016 arXiv preprint arXiv:1602.06289. [Google Scholar]
- 44.Kearnes S, McCloskey K, Berndl M, Pande V, Riley P. Molecular graph convolutions: moving beyond fingerprints. J Comput Aided Mol Des. 2016;30:595–608. doi: 10.1007/s10822-016-9938-8. [DOI] [PMC free article] [PubMed] [Google Scholar]
- 45.Baskin II, Winkler D, Tetko IV. A renaissance of neural networks in drug discovery. Expert opinion on drug discovery. 2016;11:785–795. doi: 10.1080/17460441.2016.1201262. [DOI] [PubMed] [Google Scholar]
- 46.Kruskal JB. Nonmetric Multidimensional-Scaling - a Numerical-Method. Psychometrika. 1964;29:115–129. [Google Scholar]
- 47.Agarwal PK, Har-Peled S, Varadarajan KR. Geometric approximation via coresets. Combinatorial and computational geometry. 2005;52:1–30. [Google Scholar]
- 48.Kumar S, Mohri M, Talwalkar A. Sampling Methods for the Nystrom Method. Journal of Machine Learning Research. 2012;13:981–1006. [Google Scholar]
- 49.Li N, Yang Y. Ensemble kernel principal component analysis for improved nonlinear process monitoring. Ind Eng Chem Res. 2014;54:318–329. [Google Scholar]
- 50.Ghashami M, Perry DJ, Phillips JM. Streaming kernel principal component analysis. matrix. 2015;100:1. [Google Scholar]
- 51.Hartung T, Bremer S, Casati S, Coecke S, Corvi R, Fortaner S, Gribaldo L, Halder M, Hoffmann S, Roi A, et al. A modular approach to the ECVAM principles on test validity. Altern Lab Anim. 2004;32:467–72. doi: 10.1177/026119290403200503. [DOI] [PubMed] [Google Scholar]
- 52.Varnek A, Baskin I. Machine learning methods for property prediction in chemoinformatics: quo vadis? J Chem Inf Model. 2012;52:1413–1437. doi: 10.1021/ci200409x. [DOI] [PubMed] [Google Scholar]
Associated Data
This section collects any data citations, data availability statements, or supplementary materials included in this article.