Abstract
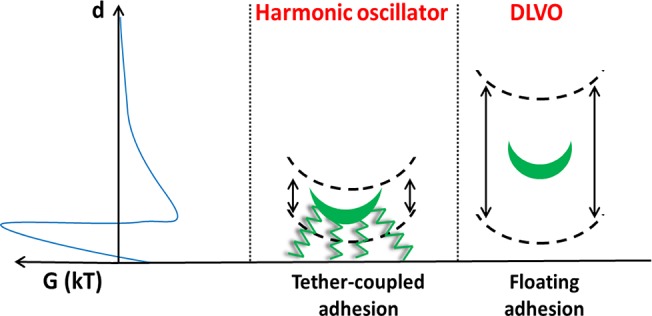
Models for bacterial adhesion to substratum surfaces all include uncertainty with respect to the (ir)reversibility of adhesion. In a model, based on vibrations exhibited by adhering bacteria parallel to a surface, adhesion was described as a result of reversible binding of multiple bacterial tethers that detach from and successively reattach to a surface, eventually making bacterial adhesion irreversible. Here, we use total internal reflection microscopy to determine whether adhering bacteria also exhibit variations over time in their perpendicular distance above surfaces. Streptococci with fibrillar surface tethers showed perpendicular vibrations with amplitudes of around 5 nm, regardless of surface hydrophobicity. Adhering, nonfibrillated streptococci vibrated with amplitudes around 20 nm above a hydrophobic surface. Amplitudes did not depend on ionic strength for either strain. Calculations of bacterial energies from their distances above the surfaces using the Boltzman equation showed that bacteria with fibrillar tethers vibrated as a harmonic oscillator. The energy of bacteria without fibrillar tethers varied with distance in a comparable fashion as the DLVO (Derjaguin, Landau, Verwey, and Overbeek)-interaction energy. Distance variations above the surface over time of bacteria with fibrillar tethers are suggested to be governed by the harmonic oscillations, allowed by elasticity of the tethers, piercing through the potential energy barrier. Bacteria without fibrillar tethers “float” above a surface in the secondary energy minimum, with their perpendicular displacement restricted by their thermal energy and the width of the secondary minimum. The distinction between “tether-coupled” and “floating” adhesion is new, and may have implications for bacterial detachment strategies.
Introduction
Bacterial adhesion occurs to many different surfaces in a wide variety of environments, and is either desirable such as in many bioreactor systems, soil remediation or to intestinal surfaces in the human body or is, among others, the cause of severe infections, food spoilage or microbially induced corrosion.1 Accordingly, there is an ongoing quest to model bacterial adhesion. This quest is on the one hand led by biochemists trying to discover more and more specific ligand–receptor systems facilitating bacterial adhesion to surfaces, while on the other hand physico-chemists attempt to design generally valid models that explain and predict adhesion of bacteria to surfaces by treating living organisms as (bio)colloidal particles.2,3
The two most common physicochemical approaches used to model bacterial adhesion are surface thermodynamic4,5 and (extended) DLVO (Derjaguin, Landau, Verwey and Overbeek)-types of analyses.6,7 Application of surface thermodynamics involves the measurement of contact angles with different liquids, followed by calculation and comparison of the free energies of the substratum and bacterial cell surfaces to yield an interfacial free energy of adhesion. Negative values for the interfacial free energy of adhesion are assumed to be predictive for bacterial adhesion to occur, but this has never become a generally valid observation, possibly because the surface thermodynamic requirement of reversibility is seldom or never met and the interface between a bacterium and a substratum surface is a dynamic one, changing over time.8,9 DLVO-types of analyses calculate the interaction energy between a (bio)colloidal particle and a substratum surface as a function of distance between the particle and the substratum surface. Under most relevant conditions, electrostatic interactions in bacterial adhesion are repulsive, that together with attractive Lifshitz–van der Waals forces yield a secondary interaction minimum at a distance of around 20–50 nm10 from the substratum surface, a potential energy barrier that impedes close approach and a deep primary minimum close to the surface that can only be reached once a particle has overcome the potential energy barrier. Also DLVO-type approaches have never acquired a general validity across different bacterial strains and species. An important reason for this is that bacterial cell surfaces can possess a wide variety of surface appendages of different length, width, composition and surface density that have been suggested to be able to pierce the potential energy barrier and tether a bacterium to a surface. Moreover, possession of tethers with lengths that may range up to several micrometers9 makes it impossible to adequately define the interaction distance in DLVO-type analyses of bacterial adhesion as it creates a multiscale roughness on the bacterial cell surface.11 Several of the troublesome issues involved in the application of surface thermodynamic and DLVO-types of analyses of bacterial adhesion have been addressed in a new model of bacterial adhesion describing irreversible adhesion of bacteria as a result of the reversible binding of multiple tethers that detach from and successively reattach to a surface, resulting in irreversible adhesion of an organism as a whole.9 The model puts bacterial adhesion a par with the irreversible adsorption of high-molecular-weight proteins to surfaces, mediated by multiple, reversibly binding molecular segments and was confirmed by in silico modeling of the key-observations underlying the model: (1) force–distance curves in single probe bacterial atomic force microscopy showing detachment events indicative of multiple binding tethers, (2) nanoscopic displacements of bacteria with relatively long autocorrelation times up to several seconds, in the absence of macroscopic displacement, (3) nanoscopic vibrational amplitudes of adhering bacteria parallel to a surface decreasing with increasing adhesion-forces, and (4) increases in mean-squared-displacements over prolonged time periods according to tα with 0 < α ≪ 1, indicative of confined displacement.9
The role of adhesion forces acting perpendicular to a substratum surface may seem puzzling in a model that is based on parallel displacements of adhering bacteria over the surface. However, in silico modeling suggested that tether adhesion forces merely dictate the frequency with which individual tethers detach. This leaves the question open as to whether the distance of an adhering bacterium above a substratum surface also varies over time, similar as its position on a substratum surface, and whether tether-binding plays a role here too.
In order to answer this question, this paper aims to determine whether adhering bacteria exhibit variations over time in their distance perpendicular to substratum surfaces and, if so, whether these variations differ for two streptococcal strains with and without 91 nm long fibrillar, tethers. Total internal reflection microscopy (TIRM)12−14 will be used to determine the variations in distance above different substratum surfaces over time, employing hydrophobic and hydrophilic glass surfaces as substrata. Distance variations will be related with the shape and width of the secondary interaction minimum and its distance from the substratum surface in a DLVO-type of analysis.
Experimental Section
Bacterial Strains, Culture Conditions, and Harvesting
Streptococcus salivarius HB7, possessing 91 nm long fibrillar tethers and its isogenic mutant HBC12, considered bald without demonstrable surface tethers,15 were employed in this study (see Figure 1). Both S. salivarius strains are negatively charged, yet differ in surface hydrophobicity with S. salivarius HBC12, being slightly more hydrophilic than S. salivarius HB7.16 Both S. salivarius strains were precultured in 10 mL of Todd Hewitt Broth (THB, OXOID, Basingstoke, UK), under static conditions. Precultures were grown for 24 h at 37 °C. After 24 h, precultures were inoculated into 200 mL of THB, and maintained under identical conditions for another 16 h. Streptococci were harvested by centrifugation at 5000g for 5 min at 10 °C, subsequently washed three times in 100 mL of adhesion buffer having an ionic strength of 57 mM (50 mM potassium chloride, 2 mM potassium phosphate, and 1 mM calcium chloride, pH 6.8) or ionic strength of 0.57 mM (10 times diluted adhesion buffer). Following this, bacteria were sonicated on ice three times for 10 s at 30 W (Vibra Cell model 375; Sonics and Materials Inc., Danbury, CT) to break bacterial chains and obtain single bacteria. Finally, bacteria were resuspended in adhesion buffer to a final concentration of 3 × 10⁸ bacteria/mL, as determined using a Bürker–Türk counting chamber.
Figure 1.
Transmission electron micrographs of negatively stained (1% methylamine tungstate) sections of S. salivarius HB7 (a) and S. salivarius HBC12 (b). The bar denotes 100 nm. Adapted from Van der Mei et al. with permission from the publisher, Springer Nature.15
Preparation of Substratum Surfaces
Glass microscope slides (15 mm × 15 mm; Thermo Scientific, 38116 Braunschweig, Germany) were used as substrata. Prior to each experiment, glass surfaces were cleaned by 10 min sonication at 100 W (Bransonic 2510E, Danbury, USA) in 2% Hellmanex (Hellma GmbH & CO., Müllheim, Germany), 99% ethanol and finally in ultrapure water (specific resistance >18 MΩ cm). Next, glass surfaces were treated with UV/ozone, yielding a hydrophilic surface while for the preparation of hydrophobic surfaces, glass slides were thoroughly dried after water-washing in an oven at 80 °C, followed by silanization in 0.05% (w/v) dimethyldichlorosilane (DDS Sigma-Aldrich) in 99% ethanol for approximately 15 min.
Total Internal Reflection Microscopy
Adhesion of streptococci onto uncoated and DDS-coated glass surfaces was established from adhesion buffer (0.57 mM or 57 mM) at room temperature. To this end, a streptococcal suspension was introduced into the circularly shaped flow chamber (14 mm diameter and 0.35 mm in height) of the instrument using a peristaltic pump at a flow rate of 300 μL/min during 60 min. Next the chamber was perfused with buffer, after which TIRM light scattering was measured. TIRM was performed on an objective-based total internal reflection fluorescence (TIRF) microscope (Nikon, Eclipse Ti with TIRF module, Tokyo, Japan), equipped with a high numerical aperture objective (Olympus, PLANO-APO 100×, 1.45, Tokyo, Japan) illuminated by a 488 nm laser (Melles Griot, Dynamic Laser, Salt Lake City, UT) laterally focused on the back focal plane. To avoid overexposure by the reflected laser beam, a spatial filter was employed to block the reflected beam in the back focal plane without image interference. The filter cube contained only a 488 dichroic mirror. Scattering light was captured on an electron multiplying, charge-coupled device camera (Andor, ixon DU-885BV Andor, Dublin, Ireland). Image size was cropped to 512 × 512 pixel resolutions to achieve a frame rate of 33 frames/s over 2000 frames. Prior to each experiment, the TIRM angle was verified with an out-coupling prism to an external reference. Light scattered by adhering bacteria was observed as two diffraction limited spots, separated by the bacterial diameter, recognized as a comet-orbit shape.17
For each adhering single bacterium, the relative z-displacement, zt, at time t with respect to the closest distance encountered, was calculated according to
| 1 |
with It the intensity of the scattered light in the evanescent field at time t, Imax the maximum intensity belonging to the distance of closest bacterial approach and dp the penetration depth of the evanescent wave (185 nm). Absolute distances could not be obtained, because the evanescent wave intensity was not constant over the entire field of view. As a result the maximum intensity Imax was different for each bacterium over the field of view. The vibrational amplitude Δz was calculated as the standard deviation of all zt-displacements over the experimental time. All TIRM experiments were carried out in triplicates on uncoated and DDS-coated glass surfaces using different bacterial cultures for each experiment.
Contact Angle Measurements
Contact angles were measured on the uncoated and DDS-coated glass surfaces with water, formamide, and methyleneiodide. Three 0.5 μL droplets of each liquid were randomly positioned on one microscope slide, employing three slides for one series of measurements with each of the above three liquids. Images of the droplets were recorded by a camera about 5 s after placing a droplet on a coverslips surface and the droplet contour digitized after gray-value thresholding, after which contact angles were calculated from the digitized contours using homemade software. Contact angles on bacteria were measured by preparing macroscopic bacterial lawns on membrane filters. Bacterial lawns were made by suspending bacteria to a concentration of 3 × 10⁸ mL–1 in water, followed by deposition on a cellulose acetate membrane filter (pore diameter 0.45 μm) placed on a fritted glass support by filtration of the suspension. At least three separate filters, from three different cultures were used for each bacterial strain tested. Strains deposited similarly in a smooth and even layer. The filters with their deposited bacterial lawn, were placed on a metal sample disc and allowed to air-dry for 30–90 min,18 in order to obtain relatively stable, so-called “plateau” contact angles, indicative of bacteria in a hydrated state but without free water in between. Contact angles were subsequently measured as described above. The contact angels presented, represent the averages from three experiments with separate prepared surfaces as well as bacterial cultures.
Next, contact angles on each surface were converted to a Lifshitz–van der Waals (γLW) and acid–base (γAB) surface free energy component, while the acid–base component was split up into an electron-donating (γ–) and an electron-accepting (γ+) parameter according to
 |
2 |
in which γ denotes the surface free energy and/or its components and parameters of the various liquids used or the solid surface to be analyzed, while θ represents the contact angle of the different liquids.19 Surface free energy components and parameters of the liquids used can be found in Supporting Information Table S1.
Bacterial and Substratum Zeta Potentials
To determine the zeta potentials of the two bacterial strains, particulate microelectrophoresis (Zetasizer nano-ZS, Malvern Instruments, Worcestershire, UK) was carried out at low and high ionic strength (0.57 and 57 mM, respectively) at pH 6.8.20 Streaming potential measurements were employed to determine the zeta potentials of uncoated and DDS-coated glass surfaces. To this end, glass slides with and without DDS-coating were mounted in a homemade parallel plate flow chamber, separated by a 100 μm Teflon spacer.21 A platinum electrode was located on each side of the chamber. The streaming potentials were measured at pressures ranging from 50 to 400 mbar, and each pressure was applied for 10 s in both directions. Following this, the zeta potentials were calculated by linear regression, i.e., linear least-squares fitting of the streaming potentials.
DLVO Theory
The DLVO theory, describes (bio)colloidal particle adhesion as a result of attractive Lifshitz–van der Waals and attractive or repulsive electrostatic forces. Accordingly, the interaction energy between a colloidal particle and a substratum can be expressed as a function of their separation distance (d) as
| 3 |
in which GTOT, GLW, and GEL represent the total, Lifshitz–van der Waals, and electrostatic interaction energies, respectively. The Lifshitz–van der Waals interaction between a spherical colloidal particle and a planar surface is given by
| 4 |
in which A is the Hamaker constant and a is the radius of the colloidal particle.19 The Hamaker constant was derived from the Lifshitz–van der Waals component of interfacial free energy of adhesion according to
| 5 |
in which d0 is the distance of closest approach (0.157 nm).22−24 Analogously, the electrostatic interaction can be calculated using measured zeta potentials according to
| 6 |
in which ε refers to the dielectric permittivity of the medium, and ζb and ζs refer to the zeta potentials of the bacterium and substratum surface, respectively. 1/κ is the Debye–Hückel length, given by
| 7 |
in which e corresponds to the electron charge, kB is the Boltzmann constant, T is the absolute temperature, zi is the valence of ions present, and ni is the number of ions per unit volume.
Statistical Analysis
All experiments were carried out in triplicates with separately prepared bacterial cultures as well as different surfaces, and all data are presented as means ± standard deviations. Results were compared pairwise for the two different strains of bacteria for the effects of ionic strength by using a Student’s t test. p < 0.05 was considered to be statistically significant.
Results
Table 1 summarizes the contact angles measured with different liquids on both substratum surfaces and bacterial strains. On the basis of the water contact angles, uncoated and DDS-coated glass surfaces can be classified as hydrophilic and hydrophobic, respectively. Although S. salivarius HB7 was more hydrophobic than S. salivarius HBC12, both bacterial strains can be classified as hydrophilic.
Table 1. Contact Angles with Different Liquids for Uncoated and DDS-Coated Glass Surfaces as Well as for S. salivarius HB7 and S. salivarius HBC12a.
| surface/bacterial strain | θwater (deg) | θformamide (deg) | θmethyleneiodide (deg) |
|---|---|---|---|
| glass | 23.3 ± 1.5 | 19.3 ± 2.3 | 52.3 ± 6.4 |
| DDS-coated glass | 97.0 ± 1.7 | 74.3 ± 6.7 | 63.3 ± 3.8 |
| S. salivarius HB7 | 34.3 ± 4.6 | 12.3 ± 2.5 | 24.0 ± 6.0 |
| S. salivarius HBC12 | 21.6 ± 3.6 | 24.7 ± 4.9 | 38.0 ± 16.2 |
Data represent averages with standard deviations over three droplets on three different glass surfaces of each type and bacterial lawns prepared from three different bacterial cultures.
Surface free energy components and parameters, calculated from contact angles with the three different liquids were subsequently compiled in Table 2, most notably showing a small acid–base component for hydrophobic DDS-coated glass, due to both small electron-donating and accepting parameters. In addition, the ratio of electron-donating over electron-accepting parameters varied between the two substratum surfaces, indicative of different structuring of water molecules nearby the surface.19,25 Both streptococcal strains had similar acid–base components, but S. salivarius HBC12 had a much higher electron-donating surface free energy parameter than S. salivarius HB7, resulting in different ratios between their electron-donating and electron-accepting parameters. Zeta potentials of the different surfaces, also compiled in Table 2, were negative for all surfaces at both low and high ionic strength, while being significantly more negative in the low ionic than in the high ionic strength buffer.
Table 2. Surface Free Energy Components and Parameters Together with Zeta Potentials for Uncoated and DDS-Coated Glass Surfaces as Well as for S. salivarius HBC12 and S. salivarius HB7, Respectivelya.
| surface
free energy components and parameters (mJ m–2) |
||||
|---|---|---|---|---|
| glass | DDS-coated glass | S. salivarius HBC12 | S. salivarius HB7 | |
| γ | 54.9 ± 1.1 | 27.7 ± 1.0 | 51.5 ± 2.6 | 57.0 ± 1.2 |
| γLW | 34.0 ± 3.0 | 26.8 ± 1.3 | 40.1 ± 7.9 | 46.3 ± 2.1 |
| γAB | 21.1 ± 3.8 | 0.4 ± 0.4 | 11.5 ± 8.8 | 10.6 ± 3.2 |
| γ– | 48.0 ± 0.8 | 2.1 ± 1.8 | 51.8 ± 4.9 | 35.1 ± 10.2 |
| γ+ | 2.3 ± 0.9 | 0.4 ± 0.7 | 0.9 ± 0.9 | 1.0 ± 0.8 |
| γ–/γ+ | 20.6 ± 0.9 | 4.1 ± 3.2 | 59.7 ± 5.5 | 35.1 ± 13.5 |
| zeta
potentials (mV) |
||||
|---|---|---|---|---|
| glass | DDS-coated glass | S. salivarius HBC12 | S. salivarius HB7 | |
| 0.57 mM | –84.9 ± 0.4 | –55.2 ± 1.4 | –20.0 ± 0.4 | –16.9 ± 2.4 |
| 57 mM | –39.5 ± 0.6 | –27.8 ± 0.0 | –8.2 ± 0.2 | –9.1 ± 2.5 |
Data regarding surface energetics represent averages with standard deviations over three measurements on three different glass surfaces of each type and bacterial lawns prepared from three different bacterial cultures. Bacterial zeta potentials are averages with standard deviations over three experiments with different bacterial cultures, while substratum zeta potentials are averages with standard deviations over three streaming potential measurements with different uncoated and DDS-coated surfaces.
The surface free energy components from Table 2 can be used together with their counterparts for water (see Supporting Information Table S1) to calculate the Lifshitz–van der Waals interfacial free energy of adhesion (eq 4), and subsequently using eq 5 to calculate the Hamaker constant for bacterial interaction with uncoated or DDS-coated glass in an aqueous suspension. Since the concept of interaction distance in the DLVO approach loses its meaning when the bacterial cell surface possesses a multiscale roughness,11 such as due to fibrillar surface tethers in S. salivarius HB7, these calculations were only made for S. salivarius HBC12, yielding Hamaker constants of 3.8 × 10⁻²¹ and 1.6 × 10⁻²¹ J against glass and DDS-coated glass, respectively. DLVO interaction energies versus distance for S. salivarius HBC12 for glass and DDS-coated glass were subsequently calculated inserting these Hamaker constants and the zeta potentials from Table 2, into eqs 3, 4, and 6, assuming a bacterial radius of 500 nm,26 and a Debye–Hückel length 1/κ for the two ionic strengths (0.57 and 57 mM) of 1.3 × 10⁻⁸ and 1.3 × 10⁻⁹ m, respectively.
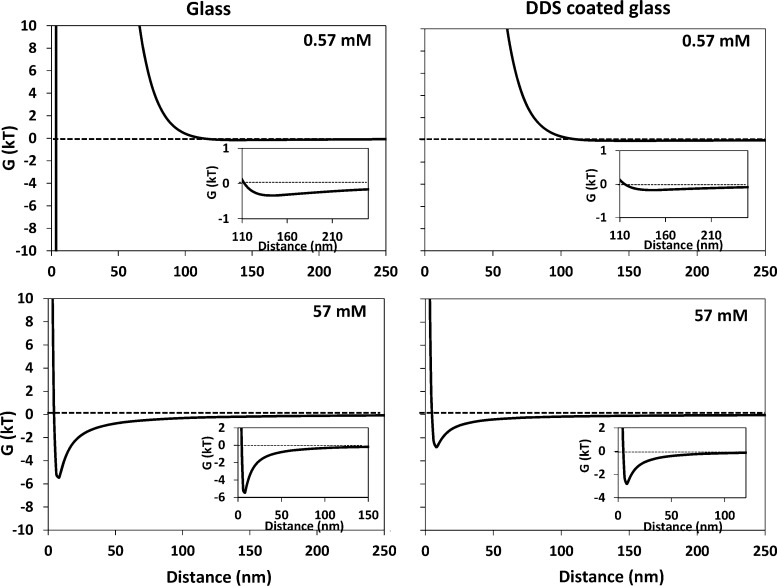
At low ionic strength (Figure 2), the secondary minimum was extremely shallow with a depth of 0.5kT and 0.25kT for uncoated and DDS-coated glass, respectively and located approximately 140 to 150 nm away from the substratum surface, respectively. Due to the decrease of electrostatic repulsion, the secondary minimum at 57 mM ionic strength was much deeper than that in 0.57 mM suspensions (Figure 2) and amounted around 5kT and 3kT for glass and DDS-coated glass, respectively, while being located approximately 15 nm from the surface. The potential energy barrier at close approach may be considered too high for a bacterium to overcome and adhere in the primary minimum as a whole in all cases.27 Due to the relatively strong electron-donating and electron-accepting parameters of glass as compared with DDS-coated glass, both strains will also experience large monopolar repulsion at close approach, that will be far less or absent on hydrophobic, DDS-coated glass than on hydrophilic glass (see also Table 2). For S. salivarius HBC12 on glass monopolar repulsion ΔGAB(d0) amounts +30.4 mJ m–2, turning into attraction (−10.6 mJ m–2) on DDS-coated glass, but since this is at the distance of closest approach d0, it is not reflected in the interaction energies presented in Figure 2 according to the DLVO theory as applied.
Figure 2.
Interaction energies between S. salivarius HBC12 and uncoated or DDS-coated glass surfaces in different ionic strength suspensions, as a function of their surface-to-surface separation distance. Insets represent part of the interaction energy curve at a different scale to better visualize the secondary minimum.
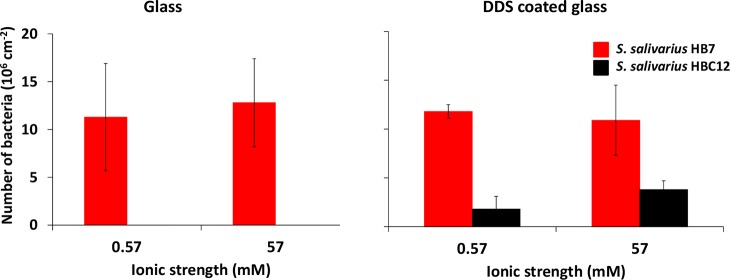
As a first step in the TIRM measurements, the chamber was perfused with a bacterial suspension and the number of adhering streptococci enumerated, as summarized in Figure 3.
Figure 3.
Numbers of adhering S. salivarius HB7 and S. salivarius HBC12 on glass and DDS-coated glass surfaces at ionic strengths of 0.57 and 57 mM. Note that, on uncoated glass, the number of adhering S. salivarius HBC12 was too low for microscopic enumeration.
S. salivarius HB7 with its fibrillar tethers adhered in approximately equal numbers to uncoated and DDS-coated glass, regardless of ionic strength (11 × 106 and 13 × 106 cm–2). S. salivarius HBC12 demonstrated no microscopically enumerable numbers to the uncoated glass surface, but on DDS-coated glass enumerable numbers were observed, amounting 2 × 10⁶ and 4 × 106 cm–2 for the low and high ionic strength suspension, respectively.
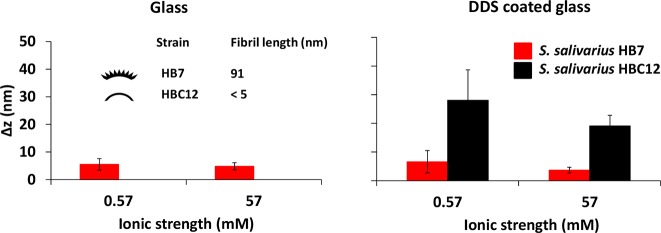
Vibrational amplitudes, Δz, of S. salivarius HB7 adhering on a hydrophilic, uncoated glass surface (Figure 4) were relatively small, around 5 nm irrespective of ionic strength, while S. salivarius HBC12 adhered in too low numbers for TIRM experiments. S. salivarius HB7 also exhibited a relatively small vibrational amplitude Δz of around 5 nm on hydrophobic, DDS-coated glass, albeit here the vibrational amplitude was slightly higher at low ionic strength (not statistically significant; p > 0.05, Student’s t test) than at high ionic strength. Strikingly, S. salivarius HBC12 demonstrated much higher vibrational amplitudes Δz on hydrophobic, DDS-coated glass than as observed for S. salivarius HBC7. In addition, these vibrational amplitudes decreased slightly toward high ionic strength (not statistically significant; p > 0.05, Student’s t test).
Figure 4.
Vibrational amplitudes Δz above glass or DDS-coated glass surfaces for S. salivarius HB7 and S. salivarius HBC12 in low and high ionic strength buffers, obtained using TIRM. Note that on hydrophilic glass, the number of adhering S. salivarius HBC12 was too low for TIRM measurements. Data represent averages over three separate experiments with error bars indicating the standard deviations over three different bacterial cultures.
Discussion
Using TIRM, the variations in distance over time from a substratum surface to which they adhered, were measured for two strains of S. salivarius with and without fibrillar surface tethers. The strain with fibrillar tethers showed vibrational amplitudes of around 5 nm, regardless of ionic strength or substratum hydrophobicity. The strain without fibrillar tethers did not adhere in sufficient numbers to derive vibrational amplitudes on hydrophilic, uncoated glass, due to unfavorable thermodynamic conditions (interfacial free energy of adhesion27,28 calculated from the data in Table 2: + 26.5 mJ m–2 due to strong monopolar repulsion). Oppositely, on hydrophobic, DDS-coated glass (interfacial free energy of adhesion: −12.3 mJ m–2 in absence of strong monopolar repulsion), the nonfibrillated strain adhered reasonably well and vibrated perpendicularly above the surface with a 5-fold-higher amplitude around 25 nm, regardless of ionic strength. Previously, TIRM has been used to analyze the change in separation distance of these streptococcal strains adhering for only 5 min to a substratum surface upon reducing ionic strength.29 When the ionic strength was reduced from 57 mM to 5.7 mM, the distance between the bacterial cell of S. salivarius HB7 and the substratum increased from 45 to 90 nm, which suggests that fibrils change from a compressed, side-on conformation to a fully stretched state. This conclusion was later confirmed by QCM-D (quartz crystal microbalance with dissipation) experiments30 suggesting collapse of streptococcal fibrillar tethers within several minutes after contact with a substratum surface. The vibrational amplitude of the fibrillated strain observed here (5 nm) is not only much smaller than the distance at which a bacterium adheres above the surface and unaffected by ionic strength, but also much smaller than the fibrillar length or the distance above the surface measured before, probably because in our measurements 60 min of adhesion were allowed before measurements, causing tether collapse over time under influence of the adhesion forces arising from the substratum surface.
The perpendicular, vibrational amplitudes of adhering S. salivarius HBC12 without fibrillar surface tethers can be related with the DLVO interaction free energy curves but due to low numbers of adhering bacteria resulting from combined monopolar and low ionic strength electrostatic repulsions only at high ionic strength. Under high ionic strength conditions, there is a clear secondary minimum (Figure 2). Accounting for a thermal energy of 1.5kT for a bacterium,31 this allows a bacterium adhering in the secondary minimum to float and move away from and toward the substratum surface. This floating behavior is constrained by the width of the secondary minimum, while bacteria remain to adhere at an average distance above the surface dictated by the absolute secondary interaction minimum. The width of the secondary interaction minimum at 1.5kT above the absolute minimum amounts around 15 to 20 nm, which coincides with the variations in distance (Δz) above the surface observed using TIRM (Figure 4). Perpendicular, vibrational amplitudes of S. salivarius HBC12, adhering in a “floating” mode are much larger than of strain S. salivarius HB7, possessing fibrillar tethers (Figure 4). Tether coupling to the surface clearly restricts the vibrational amplitudes.
In order to obtain further evidence for a floating or tether-coupled mode of bacterial adhesion, the energy of adhering bacteria as a function of their distance above a substratum surface can be compared with the distant-dependent DLVO interaction energy (see Figure 2). The probability of a bacterium being located at a certain position z above a surface follows from the frequency histogram of bacterial positions around its equilibrium, P(zt – ⟨zt⟩), which was related to the Boltzmann distribution32 according to
| 8 |
in which A is a normalization constant, G(zt – ⟨zt⟩) is the interaction energy at a position relative to the equilibrium z-position, ⟨zt⟩, of a bacterium.
The interaction energy can now readily be calculated expressed in kT units according to
| 9 |
Neglecting log(A) as a constant that merely defines the absolute energy level, the distance dependence of the interaction energy follows directly from the vibration amplitudes and associated probabilities that a position above the surface is occupied. Shapewise, the interaction energies of S. salivarius HB7 (Figure 5) are highly symmetrical and parabolic at both ionic strengths and can be well fitted to a harmonic oscillator model32 according to
| 10 |
in which k is the spring constant of the tether, that can on average be calculated to be 2.5 × 10⁻⁵ N m–1 regardless of ionic strengths. Thus, it can be concluded that streptococci with fibrillar surface tethers couple directly to a substratum surface, which requires piercing of the DLVO potential energy barrier by the tethers, which has been suggested before33 but never backed-up with experimental evidence.
Figure 5.
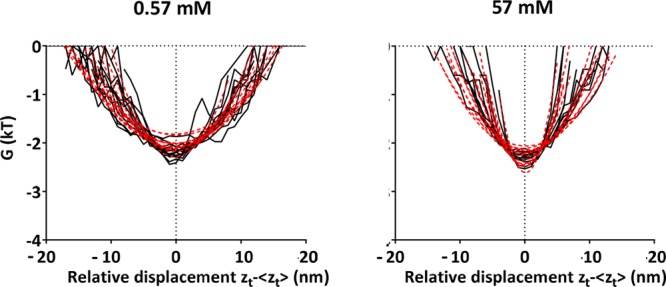
Comparison of the distance dependence of the interaction energy (calculated from perpendicular vibration amplitudes above the surface) between adhering S. salivarius HB7 with fibrillar surface tethers and hydrophobic, DDS-coated glass surface at two ionic strengths (0.57 and 57 mM) with the distance dependence calculated according to a harmonic oscillator model. Black lines represent the calculated interaction energy as a function of the relative displacement (zt – ⟨zt⟩), and the red dotted lines represent their fitting to a harmonic oscillator model. The figure refers to 15 individual bacteria, each represented by one pair of black and red dotted lines, i.e., fits.
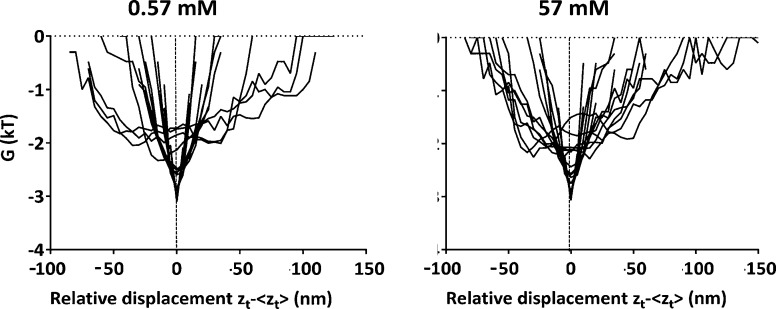
The distance dependence of the interaction energy calculated from vibration amplitudes for S. salivarius HBC12 is completely different than that for S. salivarius HB7 (compare Figures 5 and 6). Most notably, its distance dependence is not symmetrical around an equilibrium distance and therewith not according to a harmonic oscillator model but resembling the asymmetry of the DLVO secondary potential energy minimum (compare Figures 2 and 6). This confirms absence of tether-coupling and a mode of adhesion that we propose to call “floating-adhesion” above the surface.
Figure 6.
Distance dependence of the interaction energy (calculated from perpendicular vibration amplitudes above the surface) between adhering S. salivarius HBC12 without fibrillar surface tethers and hydrophobic, DDS-coated glass surface at two ionic strengths (0.57 and 57 mM), showing an asymmetrical distribution around their equilibrium position. Black lines represent the calculated interaction energy as a function of the relative displacement (zt – ⟨zt⟩). The figure refers to 15 individual bacteria, each represented by one line.
In summary, we have provided experimental evidence for the existence of two modes of bacterial adhesion, as schematically summarized in Figure 7. Bacteria with fibrillar surface tethers adhere to a substratum surface in an irreversible fashion by tether-coupling to the surface, i.e. piercing of the tether through the potential energy barrier (Figure 7a). Distance variations above the surface over time are governed by the harmonic oscillations allowed by the spring. Bacteria without fibrillar surface tethers adhere in the secondary energy minimum with their perpendicular displacement over time restricted by the width of the secondary minimum at 1.5kT above the minimum itself (Figure 7b). The distinction between “tether-coupled” and “floating” adhesion is new, and may have implications for bacterial detachment strategies, since detachment of tether-coupled bacteria may involve disrupting the bond of multiple tethers with a surface while “floating” adhesion will be disrupted by decreasing the depth of the secondary interaction minimum, which is relatively easy, e.g., by changing prevailing ionic strength conditions or slight-rinsing of the substrata with adhering bacteria (data not shown). (For details on detachment forces involved in slight-rinsing see Gomez-Suarez, et al.34)
Figure 7.
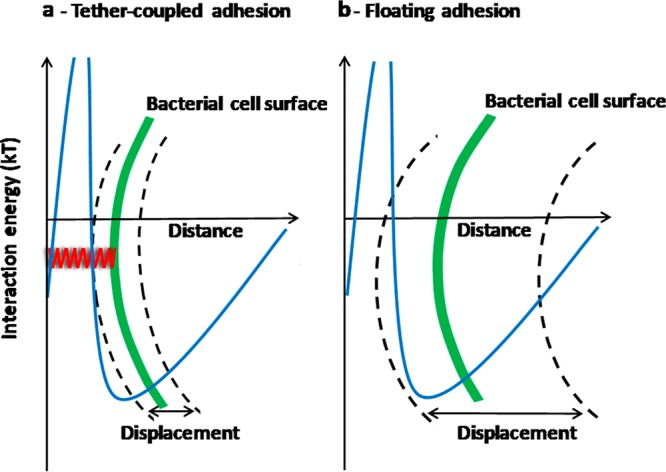
Schematics of tether-coupled adhesion of a bacterium (a) and floating adhesion (b). Note that tether-coupled adhesion requires piercing of the elastic tether (indicated as a red spring) through the DLVO-potential energy barrier.
Acknowledgments
This study was entirely funded by UMCG, Groningen, The Netherlands. Opinions and assertions contained herein are those of the authors and are not construed as necessarily representing views of the funding organization or their respective employer(s).
Supporting Information Available
The Supporting Information is available free of charge on the ACS Publications website at DOI: 10.1021/acs.langmuir.7b04331.
Surface free energy parameters and components of water, formamide, and methyleneiodide used for contact angle measurements (PDF)
The authors declare the following competing financial interest(s): H.J.B. is also director of a consulting company SASA BV. The authors declare no potential conflicts of interest with respect to authorship and/or publication of this article.
Supplementary Material
References
- Hall-Stoodley L.; Costerton J. W.; Stoodley P. Bacterial Biofilms: From the Natural Environment to Infectious Diseases. Nat. Rev. Microbiol. 2004, 2, 95–108. 10.1038/nrmicro821. [DOI] [PubMed] [Google Scholar]
- Rijnaarts H. H. M; Norde W.; Bouwers E. J.; Lyklema J. Research Bacterial Deposition in Porous Media Related to the Clean Bed Collision Efficiency and to Substratum Blocking by Attached Cells. Environ. Sci. Technol. 1996, 30, 2869–2876. 10.1021/es960597b. [DOI] [Google Scholar]
- Strevett K. A.; Chen G. Microbial Surface Thermodynamics and Applications. Res. Microbiol. 2003, 154, 329–335. 10.1016/S0923-2508(03)00038-X. [DOI] [PubMed] [Google Scholar]
- Absolom D. R.; Lamberti F. V.; Policova Z.; Zingg W.; Van Oss C. J.; Neumann A. W. Surface Thermodynamics of Bacterial Adhesion. Appl. Environ. Microbiol. 1983, 46, 90–97. [DOI] [PMC free article] [PubMed] [Google Scholar]
- Fletcher M.; Marshall K. C. Bubble Contact Angle Method for Evaluating Substratum Interfacial Characteristics and Its Relevance to Bacterial Attachment. Appl. Environ. Microbiol. 1982, 44, 184–192. [DOI] [PMC free article] [PubMed] [Google Scholar]
- Rijnaarts H. H. M.; Norde W.; Bouwer E. J.; Lyklema J.; Zehnder A. J. B. Reversibility and Mechanism of Bacterial Adhesion. Colloids Surf., B 1995, 4, 5–22. 10.1016/0927-7765(94)01146-V. [DOI] [Google Scholar]
- An Y. H.; Friedman R. J. Concise Review of Mechanisms of Bacterial Adhesion to Biomaterial Surfaces. J. Biomed. Mater. Res. 1998, 43, 338–348. . [DOI] [PubMed] [Google Scholar]
- Busscher H. J.; Uyen M. H. M. J. C.; Weerkamp A. H.; Postma W. J.; Arends J. Reversibility of Adhesion of Oral Streptococci to Solids. FEMS Microbiol. Lett. 1986, 35, 303–306. 10.1111/j.1574-6968.1986.tb01547.x. [DOI] [Google Scholar]
- Sjollema J.; Van der Mei H. C.; Hall C. L.; Peterson B. W.; De Vries J.; Song L.; De Jong E. D.; Busscher H. J.; Swartjes J. J. T. M. Detachment and Successive Re-Attachment of Multiple, Reversibly-Binding Tethers Result in Irreversible Bacterial Adhesion to Surfaces. Sci. Rep. 2017, 7, 4369. 10.1038/s41598-017-04703-8. [DOI] [PMC free article] [PubMed] [Google Scholar]
- Hermansson M. The DLVO Theory in Microbial Adhesion. Colloids Surf., B 1999, 14, 105–119. 10.1016/S0927-7765(99)00029-6. [DOI] [Google Scholar]
- Ostvar S.; Wood B. D. Multiscale Model Describing Bacterial Adhesion and Detachment. Langmuir 2016, 32, 5213–5222. 10.1021/acs.langmuir.6b00882. [DOI] [PubMed] [Google Scholar]
- Prieve D. C. Measurement of Colloidal Forces with TIRM. Adv. Colloid Interface Sci. 1999, 82, 93–125. 10.1016/S0001-8686(99)00012-3. [DOI] [Google Scholar]
- Walz J. Y. Measuring Particle Interactions with Total Internal Reflection Microscopy. Curr. Opin. Colloid Interface Sci. 1997, 2, 600–606. 10.1016/S1359-0294(97)80052-0. [DOI] [Google Scholar]
- Robertson S. K.; Bike S. G. Quantifying Cell-Surface Interactions Using Model Cells and Total Internal Reflection Microscopy. Langmuir 1998, 14, 928–934. 10.1021/la9709610. [DOI] [Google Scholar]
- Van der Mei H. C.; Handley P. S.; Busscher H. J. Depth Profiling of the Elemental Surface Composition of the Oral Microorganism S. salivarius HB and Fibrillar Mutants by X-Ray Photoelectron Spectroscopy. Cell Biophys. 1992, 20, 99–110. 10.1007/BF02782657. [DOI] [PubMed] [Google Scholar]
- Van der Mei H. C.; Weerkamp A. H.; Busscher H. J. A Comparison of Various Methods to Determine Hydrophobic Properties of Streptococcal Cell Surfaces. J. Microbiol. Methods 1987, 6, 277–287. 10.1016/0167-7012(87)90065-0. [DOI] [Google Scholar]
- Mattheyses A. L.; Axelrod D. Direct Measurement of the Evanescent Field Profile Produced by Objective-Based Total Internal Reflection Fluorescence. J. Biomed. Opt. 2006, 11, 014006. 10.1117/1.2161018. [DOI] [PubMed] [Google Scholar]
- Van Oss C. J.; Gillman C. F. Phagocytosis as a Surface Phenomenon. I. Contact Angles and Phagocytosis of Non-Opsonized Bacteria. J. Reticuloendothel. Soc. 1972, 12, 283–292. [PubMed] [Google Scholar]
- Van Oss C. J.; Giese R. F. Role of the Properties and Structure of Liquid Water in Colloidal and Interfacial Systems. J. Dispersion Sci. Technol. 2005, 25, 631–655. 10.1081/DIS-200027316. [DOI] [Google Scholar]
- Wilson W. W.; Wade M. M.; Holman S. C.; Champlin F. R. Status of Methods for Assessing Bacterial Cell Surface Charge Properties Based on Zeta Potential Measurements. J. Microbiol. Methods 2001, 43, 153–164. 10.1016/S0167-7012(00)00224-4. [DOI] [PubMed] [Google Scholar]
- Van Wagenen R. A.; Andrade J. D. Flat Plate Streaming Potential Investigations: Hydrodynamics and Electrokinetic Equivalency. J. Colloid Interface Sci. 1980, 76, 305–314. 10.1016/0021-9797(80)90374-4. [DOI] [Google Scholar]
- Van Oss C. J.The Properties of Water and Their Role in Colloidal and Biological Systems, first ed.; Elsevier Ltd., 2008. [Google Scholar]
- Van Oss C. J.Interfacial Forces in Aqueous Media, second ed.; Taylor & Francis Group, LLC., 2006. [Google Scholar]
- Abu-Lail N. I.; Camesano T. A. Specific and Nonspecific Interaction Forces between Escherichia Coli and Silicon Nitride, Determined by Poisson Statistical Analysis. Langmuir 2006, 22, 7296–7301. 10.1021/la0533415. [DOI] [PubMed] [Google Scholar]
- Van Oss C. J. Development and Applications of the Interfacial Tension between Water and Organic or Biological Surfaces. Colloids Surf., B 2007, 54, 2–9. 10.1016/j.colsurfb.2006.05.024. [DOI] [PubMed] [Google Scholar]
- Marrie T. J.; Noble M. A.; Costerton J. W. Examination of the Morphology of Bacteria Adhering to Peritoneal Dialysis Catheters by Scanning and Transmission Electron Microscopy. J. Clin. Microbiol. 1983, 18, 1388–1398. [DOI] [PMC free article] [PubMed] [Google Scholar]
- Wang Z.; Jin Y.; Shen C.; Li T.; Huang Y.; Li B. Spontaneous Detachment of Colloids from Primary Energy Minima by Brownian Diffusion. PLoS One 2016, 11, e0147368. 10.1371/journal.pone.0147368. [DOI] [PMC free article] [PubMed] [Google Scholar]
- Krekeler C.; Ziehr H.; Klein J. Influence of Physicochemical Bacterial Surface Properties on Adsorption to Inorganic Porous Supports. Appl. Microbiol. Biotechnol. 1991, 35, 484–490. 10.1007/BF00169754. [DOI] [Google Scholar]
- Bayoudh S.; Othmane A.; Bettaieb F.; Bakhrouf A.; Ouada H. B.; Ponsonnet L. Quantification of the Adhesion Free Energy between Bacteria and Hydrophobic and Hydrophilic Substrata. Mater. Sci. Eng., C 2006, 26, 300–305. 10.1016/j.msec.2005.10.045. [DOI] [Google Scholar]
- Olsson A. L. J.; Arun N.; Kanger J. S.; Busscher H. J.; Ivanov I. E.; Camesano T. A.; Chen Y.; Johannsmann D.; Van der Mei H. C.; Sharma P. K. The Influence of Ionic Strength on the Adhesive Bond Stiffness of Oral Streptococci Possessing Different Surface Appendages as Probed Using AFM and QCM-D. Soft Matter 2012, 8, 9870–9876. 10.1039/c2sm26025e. [DOI] [Google Scholar]
- Van Loosdrecht M. C. M.; Lyklema J.; Norde W.; Zehnder A. J. B. Bacterial Adhesion: A Physicochemical Approach. Microb. Ecol. 1989, 17, 1–15. 10.1007/BF02025589. [DOI] [PubMed] [Google Scholar]
- Dabros T.; Warszynski P.; Van de Ven T. G. M. Motion of Latex Spheres Tethered to a Surface. J. Colloid Interface Sci. 1994, 162, 254–256. 10.1006/jcis.1994.1034. [DOI] [Google Scholar]
- Bendinger B.; Rijnaarts H. H. M.; Altendorf K.; Zehnder A. J. B. Physicochemical Cell Surface and Adhesive Properties of Coryneform Bacteria Related to the Presence and Chain Length of Mycolic Acids. Appl. Environ. Microbiol. 1993, 59, 3973–3977. [DOI] [PMC free article] [PubMed] [Google Scholar]
- Gomez-Suarez C.; Busscher H. J.; Van der Mei H. C. Analysis of Bacterial Detachment from Substratum Surfaces by the Passage of Air-Liquid Interfaces. Appl. Environ. Microbiol. 2001, 67, 2531–2537. 10.1128/AEM.67.6.2531-2537.2001. [DOI] [PMC free article] [PubMed] [Google Scholar]
Associated Data
This section collects any data citations, data availability statements, or supplementary materials included in this article.


