

Abstract
Collision cross section (CCS) measurements with a linear drift tube have been utilized to study the gas phase conformers of a model peptide (Acetyl-PAAAAKAAAAKAAAAKAAAAK). Extensive molecular dynamics (MD) simulations have been conducted to derive an advanced protocol for the generation of a comprehensive pool of in-silico structures; both higher-energy and more thermodynamically-stable structures are included to provide an unbiased sampling of conformational space. MD simulations at 300 K are applied to the in-silico structures to more accurately describe the gas-phase transport properties of the ion conformers including their dynamics. Different methods used previously for trajectory method (TM) CCS calculation employing the Mobcal software [1] are evaluated. A new method for accurate CCS calculation is proposed based on clustering and data mining techniques. CCS values are calculated for all in-silico structures and those with matching CCS values are chosen as candidate structures. With this approach more than 300 candidate structures with significant structural variation are produced; although no final gas-phase structure is proposed here, in a second installment of this work, gas-phase hydrogen deuterium exchange data will be utilized as a second criterion to select among these structures as well as to propose a relative populations for these ion conformers. Here the need to increase conformer diversity and accurate CCS calculation is demonstrated and the advanced methods are discussed.
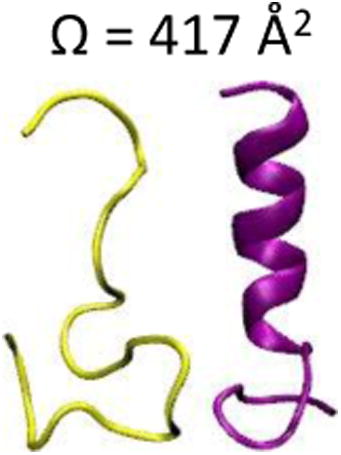
Graphical abstract
Introduction
The study of peptide and protein ion structure in the gas phase offers the opportunity of characterizing these systems in the absence of a complicating, explicitly defined environment, where the dynamic nature of hydrogen bonding [2, 3] and the relatively large number of discreet interacting species make these studies challenging [4, 5]. Gas-phase studies, therefore, provide a means to examine intrinsic (intramolecular) interactions in protein and peptide ion conformers [6-10]. The tools and methods used for these purposes have been categorized as physical and chemical probes [6]. As their names imply, a physical probe provides data related to a physical property of an ion (e.g., ion size), while a chemical probe provides information about ion reactivity leading to structural inference [6].
Collision cross sections (CCS) obtained from ion mobility spectrometry (IMS) measurements can be used as a physical probe of gas-phase ion size [11]. Molecular dynamics (MD) simulations can be coupled with CCS measurements to provide a powerful tool for structure studies [12-14]. In this approach, CCS calculations for in-silico structures are compared to experimental values to infer structural information. In early work, in-silico structures were largely used for relative size comparisons with protein ions [15]. In these studies, CCS calculations were performed for protein ion structures such as a native, a partially folded, an α-helix (unfolded), and a fully extended structure to effectively ascertain the relative degree of compactness for cytochrome c ions. More recently, NMR structures were used as inputs in MD simulations to optimize and produce a nominal structure for native-like, gas-phase ions of ubiquitin [16, 17]. Another approach associated with this method included the production of numerous, random in-silico structures to sample conformational space where the structures with matching CCS values could be selected as candidate structures [7, 8, 18]. Traditionally the most stable structure of these was accepted as the most representative of the gas-phase structures. Such an approach is valid insofar as the structure produced from electrospray ionization (ESI) and subsequent gas-phase ion transfer steps represents a more thermodynamically stable ion conformer rather than a higher-energy, kinetically-trapped state.
Several studies demonstrate the effect of solution conditions (and their solution structure) on the resulting gas-phase conformers [16, 19-26]. One issue is the degree to which such species resemble solution structures and their relative stability in the gas-phase. In studies of peptide ions, collisional activation of ion conformer populations suggest a large portion are kinetically-trapped species [19]. Separate studies have suggested that low charge state protein ions can persist as solution-like structures for extended periods of time in the gas phase [16]. Therefore, gas-phase studies may provide information about antecedent solution states. However, because CCS measurements provide limited structural information related to the shape of the ions and the fact that the computational techniques mentioned above are often directed toward obtaining the most stable gas-phase structures, difficulties arise with regard to structural assessments.
Recently we have proposed the application of gas-phase hydrogen deuterium exchange (HDX) with IMS and tandem mass spectrometry (MS/MS) to begin to address shortcomings associated with ion conformer selection [27-29]. In this approach, gas-phase ions undergo reactions with D2O reagent gas during the mobility separation. Subsequently, using electron transfer dissociation (ETD) fragmentation data, the number of deuteriums incorporated within each residue can be determined. Using a hydrogen accessibility scoring (HAS) algorithm and an effective collision model, a hypothetical deuterium uptake pattern for each in-silico structure can be generated to serve as an additional criterion for structure elucidation. In the second installment of this work, the HDX mechanism and gas-phase ion structure dynamics are utilized to improve the accuracy of the HAS algorithm. A goal of the work reported here is to develop a method to produce accurate structures as well as a means to assess their relative populations. To improve the accuracy of structural determinations, the study first focuses on enhanced conformational space sampling techniques and then CCS calculation methods are examined. It is confirmed that truly comprehensive sampling of conformational space for these types of studies is essential. Here, extensive MD simulations have been performed to produce combined pools of more thermodynamically-stable and higher-energy structures.
The trajectory method [13, 30] implemented in the Mobcal software suite [1] is widely used to calculate theoretical CCS values for in-silico ion structures. Although the procedure appears to be relatively straightforward, it can actually be quite complicated. This is especially true for peptide ions where the conformational energy barriers along the energy landscape are significantly smaller than for proteins. That is, peptide ions are highly flexible and can adopt a number of diverse energetically-available structures [31]. Because of this, no single in-silico structure is representative of the experimentally observed ion population. For this reason such structures are often referred to as “conformer type” [27]. Therefore, to obtain an accurate structural representation, the dynamic nature of a conformer type should be considered. The CCS exhibited by conformer types can be calculated along a MD trajectory run by averaging values for all structure frames. That said, such a process is prohibitively intensive computationally and approximation methods are highly desirable. To address this challenge, different data mining approaches have been tested and benchmarked to extract the most representative structures from a MD trajectory in order to propose an efficient protocol to calculate accurate CCS values exhibited by a conformer type.
Because the degree of similarity between solution- and gas-phase structures may be answered by studying gas-phase conformer establishment [9, 16, 17, 23, 32-36], the work presented in the discussion below is preliminary yet foundational in nature. That said, recent CCS measurements of partially-dehydrated, electrosprayed ions reveal that the gas-phase structure adaptation can depend on intrinsic factors such as the nature of basic residues and the interaction of other residues in the stabilization of structure [7, 23]. Therefore, although these studies provide valuable insight regarding gas-phase structure establishment, a statistical comparison of solution- and gas-phase structural types can provide additional insight into the actual resemblance of such species for a variety of biomolecular ions. In a series of manuscripts the application of IMS-HDX-MS/MS coupled with MD simulations for the accurate elucidation of structures (and their populations) in the gas-phase will be presented and, subsequently, the gas-phase structures and solution structures (from extensive MD simulations guided by CD spectroscopy data) will be compared statistically.
Experimental
Sample preparation
The model peptide Acetyl-PAAAAKAAAAKAAAAKAAAAK (> 90% purity) was synthesized by Genscript (Piscataway, NJ, USA). Peptide stock solutions were prepared by dissolving 1 mg of the model peptide (without further purification) in 1.0 mL Mili-Q water. ESI solutions were prepared by 1:10 dilution of stock solution with 100 mM solution of ammonium acetate in water. ESI solutions were infused (300 nL min-1) into the hybrid IMS-MS instrument [29, 37] through a pulled-tip capillary biased at 2200 V relative to the instrument entrance orifice.
IMS-MS measurements
The instrument used for these experiments has previously been described in detail [29, 37]. Briefly, a home-built drift tube coupled to a linear ion trap (LIT) mass spectrometer (LTQ Velos, ThermoScientifc, San Jose, CA, USA) was employed. A dual ion gating system was utilized to provide the time delay between the release of ions from the ion trap and the selection of ions of a given mobility. The delay time between the first and second ion gates was adjusted to mobility select the ions. Delay times between the two gates were scanned to obtain drift time distributions (0.1 ms increments). For each time increment mass spectra were collected for 0.5 minutes. The LIT m/z scan range of 400-1,000 was utilized. For MS/MS measurements, an ETD reaction time of 200 ms was employed.
Molecular dynamics (MD) simulations
To perform the in-vacuo MD simulations, an initial extended structure of a [M+3H]3+ ion was generated using the AMBER12 [38] molecular dynamics package. The non-polarizable all-atom Amber ff12SB force field was employed for structural parameterization. To derive the undefined force field parameters for the COOH-terminal Lysine residue carrying a distinct formal charge in the gas phase, two structures of this single amino acid with ψ and φ dihedral angle values matching those in α-helical and extended structures were generated. Quantum mechanics geometry optimizations for both conformations were carried out at HF/6-31G(d) theory level using the GAMESS software package [39, 40]. The optimized structures were subjected to multi-orientation molecular electrostatic potential (MEP) computations and charge fittings using the R.E.D. server development [39-44] to obtain the empirical force field parameters for this specific residue.
The extended initial structure of the triply-charged peptide ions with charge arrangements of K(6)-K(11)-K(21) and K(6)-K(16)-K(21) were energy minimized using 2500 steps of steepest descent algorithm followed by 2500 steps of conjugate gradient algorithm. Cyclic simulated annealing (SA) was employed for conformational space sampling of the energy-minimized structure [18, 29, 45]. During SA runs (1-fs time step), the Berendsen temperature coupling algorithm [46] was used. No long-range cutoffs for non-bonded interactions were considered. The temperature of the in-vacuo system was dramatically increased to 1,000 K over 8 ps with a heat bath coupling time constant of 0.2 ps, trans-omega dihedral restraints on the entire peptide backbone, and chirality restraints on all chiral centers. The heated structure was subjected to dynamics at constant temperature and gradually cooled to lower temperatures (10 K) over various designated total SA timescales (10, 20, 40, 100, 400 and 1200 ps) using the coupling time constant of 4.0 ps and was subsequently energy minimized to generate structures at 0 K (the annealed structures). This annealed structure served as the starting point for the next heating-cooling cycle. Of these timescales, 40 and 1200 ps SA runs were used to generate a more diverse pool of higher-energy and more thermodynamically stable structures as candidate conformers. The increased conformer diversity is described in the Results and Discussion section.
After 1,000 cycles of simulation, all resulting annealed structures (end of each SA run) were gradually heated to 300 K over a 100-ps timescale using the Berendsen temperature coupling algorithm with a coupling time constant of 1.0 ps and equilibrated. The final heated-equilibrated structures were subjected to 5 ns production MD in vacuo with a 2-fs timestep. The simulations were carried out without the non-bonded cutoffs for long-range interactions. The temperature of the system was maintained at 300 K using Langevin dynamics with a collision frequency of 1 ps-1 [47, 48]. 5,000 structures were sampled from each MD trajectory. The structures with the lowest potential energy in each MD trajectory were extracted to serve as the reference Cartesian coordinate set in mass-weighted, root-mean-square deviation (RMSD) calculations. Backbone-only RMSD values for all structures within a single trajectory were obtained using the ptraj [49] module implemented in the AMBER12 software package [38]. RMSD-oriented structures were subjected to a fixed-radius k-means clustering algorithm using the MMTSB toolset [50]. By applying an in-house script to this algorithm, the selected radius values for each trajectory were altered in a fashion such that the number of generated clusters was 50 (±10). Using the Mobcal software and trajectory method (TM) [1], collision cross section calculations were performed on the structures with the lowest RMSD relative to the mathematically-generated centroids for each resulting cluster.
The high annealing temperature of 1,000 K enhances the sampling process by overcoming high-energy barriers along the potential energy surface (PES) thus increasing the accessible conformational space for the sampling process [51, 52]. However, such a process facilitates unwanted cis-trans transitions and chirality inversions along the peptide backbone [51-53]. Therefore chirality and trans-omega dihedral restraints are normally applied to prevent such transitions. Notably, the presence of structural restraints may limit the sampled configurations to a narrower portion of conformational space [52]. Although restraints were employed for this study, careful examination showed that such an action did not affect the conformational space sampling capabilities of SA. For further discussion of the use of restraints and validating studies, see the Supplementary Information section. Method development and benchmarking processes were only conducted on K(6)-K(11)-K(21) peptide ions. The summery of the MD simulations is presented in Supplementary Figure 1.
Secondary structure analysis
To pinpoint the secondary structure elements, the STRIDE algorithm was employed [54]. This algorithm considers the positional-dependent hydrogen bond energy as well as the statistically-derived amino acid propensity to predict the secondary structure. The algorithm identified 310-helix, α-helix, π-helix, turn and random coil as the existing elements for the sampled structures. The helicity (HR) for a structure was determined as the ratio of the overall number of amino acid residues (without considering the acetyl cap) existing in any of the three possible helices (R) to the total number of amino acid residues (21). This generated a range of values from 0 (where none of the amino acid residues participates in a helix) to 1 (where all the backbone atoms exist in a helical structure). Normalized population values (NP) for helicity of each SA run with 1,000 annealed structures are presented for the range of 0 to 21 within-helix, R residues. Since the formation of a helix requires at least i to i+3 interactions, very low normalized population values are observed for one and two amino acid residues. Total helicity for 1,000 annealed structures was calculated according to Equation 1:
| (1) |
Selection of an appropriate temperature
MD simulations at constant temperature can provide an approximation of protein ion structural fluctuations which can affect their gas-phase transport properties [31, 55] and hydrogen-deuterium exchange reactivity [56]. The degree of the dynamics with regard to peptide structure highly depends on the energy of the ion and the accessible energy barriers. Therefore it is necessary to perform production simulations at a temperature matching the ion energy levels in the drift tube. Ion collisions with the neutral gas transform a portion of the drift velocity into a random velocity component. As a result, the internal energy of the ions increases, and thus their effective temperature is higher than the ambient temperature. The temperature of ions in the low-field limit regime can be estimated as [57]:
| (2) |
in which kB is Boltzmann's constant, mB, vd, Ta , and Teff are neutral buffer gas mass, ion drift velocity, ambient temperature, and the effective temperature of the ions, respectively. Using a drift velocity of 100 m·s-1 and ambient temperature of 293 K, the effective temperature can be estimated to be 300 K. Therefore, for the simulations to better match the experimental conditions, all the annealed structures have been heated to the higher temperature of 300 K and equilibrated. To sample the peptide ion dynamics at 300 K, the heated-equilibrated structures have been subjected to 5 ns production MD simulations at this temperature. The heating, equilibration and production MD simulations are performed for both charge arrangements of triply-charged protein ions and on structures sampled from the 40-ps and 1200-ps SA runs. Overall, two charge arrangements and two simulated annealing procedures were utilized to produce a pool of 4,000 annealed structures. The trajectories have been sampled to generate 5,000 frames for each initial heated-equilibrated conformation leading to a significantly large pool (5,000 1,000) of structures for a single charge arrangement and a specific SA run.
Cluster Analysis
All 4,000 trajectories obtained from MD simulations were subjected to clustering using the cluster.pl utility implemented in the MMTSB toolset [50]. This program applies hierarchical (jclust script) as well as partitional k-means (kclust script) clustering methods (see Supplementary Information section); however, due to the significant number of structures, the relatively faster k-means clustering algorithm has been used to perform the analysis. One drawback in selecting the k-means algorithm, is that the kclust script requires a “fixed-radius” parameter as the cluster threshold value and the number of generated clusters (k) cannot be determined by the user. Thus, a script -developed in house - has been employed to change the radius values for the kclust script in order to obtain a desired number of clusters.
To perform cluster analysis for a single trajectory, a series of 5,000 both backbone-only and all-atom RMSD-oriented structures have been subjected to the radius modifying script. For a particular radius value, the respective RMSD values are calculated and the similarity between the structures is determined. The total within-cluster sum of squares (TWSS) values are calculated according to Equation 3:
| (3) |
where RMSDij is the RMSD of the jth member of cluster i relative to the centroid of the corresponding cluster, Ni is the number of members present in the ith cluster, and k is the number of generated clusters for a particular radius value. The TWSS value represents the distance of cluster members from their corresponding centroid. As the script modifies the radius values by increments of 0.2 Å, the new TWSS values are calculated. A plot of TWSS values versus the different k values becomes relatively constant at a value known as an elbow-point which provides the optimal value for the number of generated clusters. The elbow-points have been calculated for all trajectories and the maximum value between all calculated elbow-points results in the optimal k value of 50 clusters (Supplementary Figure 2). Based on the behavior of the TWSS function at the elbow-point, dividing the trajectories into 50 clusters should result in the greatest mutual similarity among cluster members within the shortest computation time. Therefore, the k value of 50 (±10) and the corresponding generated clusters is expected to provide the highest accuracy; however, to examine the possibility for obtaining a desirable accuracy at lower computation times, a k value of 10 (±4) which corresponds to the area below the elbow-points for all TWSS plots, has been utilized to generate a different class of clusters. In the present manuscript, the terms 50-k and 10-k will be used to address k values of 50 (±10) and 10 (±4), respectively. In addition to this, the accuracy of the results has been investigated for a third class of analysis where the k value is selected to be 1 (no clustering). For the 10 reference trajectories, the accuracy can be determined by comparison of CCS values of weighted cluster-representative structures with the accurate CCS values (Ω*) corresponding to the average CCS value for all 5,000 structures in a MD production run. Therefore the selection of the cluster-representative structure is a priority.
Results and Discussion
Peptide ion collision cross sections
Figure 1 shows the three-dimensional (3D), raised-relief plot for model peptide ions indicating the abundances of ions at specific tD and m/z values. Upon electrospraying the model peptide, quadruply-, triply-, and doubly-protonated peptide ions are produced. Quadruply-protonated ions are observed as a small feature at m/z of ∼453. These ions exhibit three different conformer types with CCS values of 492, 506 and 534 Å2 (Supplementary Figure 3). Doubly-charged ions produce a wide, unresolved distribution with CCS values spanning a range of 300-400 Å2. The most dominant feature in the spectrum corresponds to triply-charged ions. The shape and width of the peak associated with these ions is consistent with the presence of at least three conformer types. The dominant conformer type is the most compact conformer with a CCS value of 417 Å2. The second most abundant conformer type is slightly more diffuse (Ω = 438 Å2). The third conformer type represents an unresolved shoulder in the ion's drift time distribution with a CCS value of 464 Å2 The most compact and slightly more diffuse conformers of triply-charged ions were selected for further study because of their higher overall intensity as well as increased conformer type purity upon mobility selection.
Figure 1.
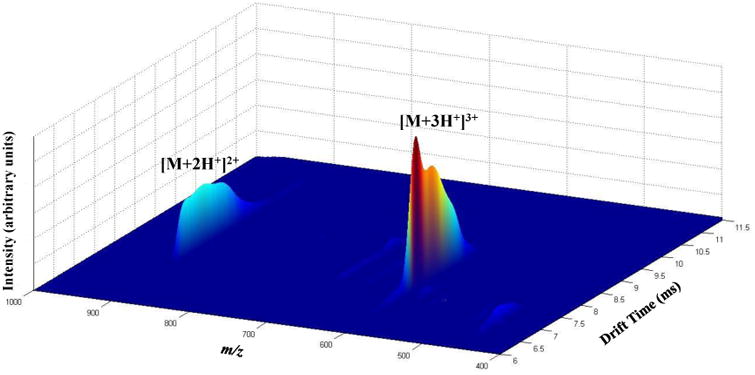
Three-dimensional (tD, m/z, intensity) raised-relief plot produced by electrospraying a solution of the model peptide Actyl-PAAAAKAAAAKAAAAKAAAAK. Dominant ions in the distribution are labeled.
Conformational space sampling
Several studies suggest that over the short timescale of the ESI process, the protein ions do not resemble equilibrated conformations in the gas phase; rather, they are higher-energy, meta-stable structures presenting similarities to the solution phase conformations [7, 24, 33]. In a single SA cycle, increasing the time of the cooling process leads to the generation of structures that are more thermodynamically stable [58]. Therefore lengthened cooling steps even in multiple cycles of SA simulations will direct the resulting conformational space toward the selection of lower-energy configurations. The primary goal of a cyclic SA approach in these studies is not to determine the global minimum as in many classical SA simulations [53, 59] but to sample a pool of structures from both thermodynamically-stable conformers as well as higher-energy configurations. Here, the conformational sampling quality is evaluated by varying the designated cooling timescale (see Experimental section) for multiple, 1,000-cycle SA runs. Figure 2a shows examples of the ion temperature as a function of the SA times for the [M+3H]3+ ion with charge arrangement of K(6)-K(11)-K(21). The resulting annealed structures sampled at the end of each simulation are subjected to additional cycles of heating-cooling steps. The potential energy values of the 1,000 resulting minimized conformers (annealed structures) are averaged for each run. The slower cooling algorithms generated more thermodynamically stable structures as expected (Figure 2b).
Figure 2.
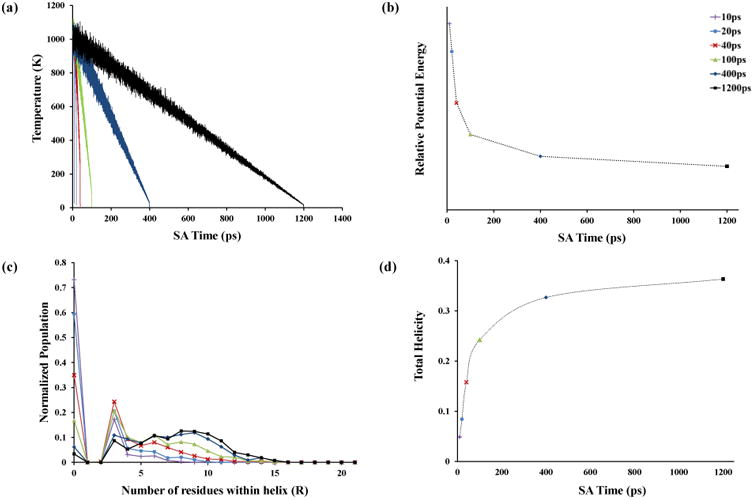
The effect of cooling time variation on sampled structures at the end of simulated annealing (SA) runs. Each color represent a specific simulation time ranging from 10 ps to 1200 ps. Panel a shows the change in system temperature as a function of time for six different simulations having the same annealing time period (8 ps). The associated energies of 1,000 structures obtained at the end of the SA cycles are averaged for each run and illustrated in panel b. Panel c shows the secondary structure analysis resulting in a helicity number represented by the within-helix residue count for each sampled structure that has been normalized for the population of 1,000 structures for a single SA run. The total helicity values for the representative SA runs are shown in panel d (see manuscript for more details).
A secondary structure analysis has been performed for all 1,000 annealed structures generated from multiple SA runs in order to determine the conformational space available to the protein backbone. Overall, slow-cooling simulations focused the conformational space toward the formation of more helical structures compared to fast-cooling SA runs which leads to the formation of more random structures. Figures 2c and 2d show an increase in the number of amino acid residues that are involved in helical structure.
Considering the number of residues involved in a helix (R) as presented in Figure 2c, the formation of a series of conformers having random structure encompassing at most 13 amino acid residues results from the 40-ps simulations (i.e., the NP is zero for R ≥ 13), while for the 1200-ps SA runs up to 16 residues can exist in helical structures (i.e., the NP is zero for R ≥ 16). This observation raises the issue of whether or not the conformational space sampled at 40 ps is more limited than that encountered by the peptide ion using cycles of 1200 ps. To estimate the relative diversity of sampled structures, mass-weighted RMSD calculations were performed pairwise for all 1,000 annealed structures. The average minimum and maximum pairwise RMSD values (data not shown) reveal a slightly larger (∼10%) difference in RMSD values for the 40-ps runs compared with the 1200-ps simulations. Because the ESI process can produce a number of conformers existing as a wide range of conformer types and energies [7, 24, 33], to produce an in-silico pool of structures that could contain a subset of species that are representative of the mixture, the 40-ps SA and the 1200-ps SA run was utilized which is expected to produce a wider range of conformer type and energy than either alone.
For the purposes of data reduction and to decrease the computation time, the annealed conformers could be clustered and representative structures used for each cluster; for example, if 5 annealed structures exist in each cluster, selection of a single representative conformer decreases the computation time by a factor of ∼5. However, a cluster analysis for 1,000 annealed structures obtained from 40-ps SA runs shows that such data reduction techniques can lead to a biased selection of sampled structures and eliminate a variety of conformation types such as structures with 9, 12 and 14 amino acids residues (of 21 total) existing in one of the three helical forms (Supplementary Figure 4). Therefore, all 4,000 annealed structures (2 SA run times, 2 protonation site arrangements, and 1,000 sampled structures from each cyclic SA run) have been subjected to subsequent analysis without initial clustering fallowing the SA runs.
It can also be argued that terminating the cooling step during the SA procedure at 300 K rather than 0 K and subsequently sampling a minimized conformer is more efficient by eliminating the further heating and equilibration steps. In order to benchmark a conformational space sampling technique, it has been necessary to continue the cooling steps to lower temperatures. The limited energy available at lower temperature (e.g., 10 K) leads to less structural fluctuation and the sampled conformations do not deviate from energetically available structures at such temperatures; therefore, a single structure can be used to benchmark the conformational space sampling methods. Notably, these structures would offer different starting point along the PES and do not represent the entire trajectory with regard to CCS calculations as discussed below. Therefore, the goodness of conformation space sampling can be qualitatively assessed by the diversity of these structures.
Although the production MD was used to simulate conformer fluctuations, it is noted that the timescale (5 ns) is significantly smaller than that of the measurement (∼9 ms). Considering that the MD trajectory could sample a localized area of the PES, the fact that some structural transformations may not occur on the short simulation timescale is, to some degree, mitigated by the SA approach where multiple structures are submitted to production MD. That is, a goal of the more extensive SA is to bypass energy barriers that may be associated with such structural transformations.
Additionally, the method of filtering candidate structures (CCS and, in the future, HDX matching) utilizes a linear combination of structures; thus in a sense, the filtering has the potential to stitch together the available conformational space. That said, even with this extensive approach, incomplete representation of structural fluctuations cannot be ruled out.
Collision cross section calculation
The trajectory method (TM) [30] calculation (using the Mobcal [1] software) has been widely utilized to calculate hypothetical CCS values for in-silico structures. For a single in-silico structure this process is straightforward; however, thousands of captured frames are associated with the production MD simulations. A valid solution is to calculate the CCS values for all structures within a single MD trajectory and average the obtained results (Ω* above); however, this is computationally extensive (if not impossible). For example, in the case of these experiments, CCS values for 20 million in-silico structures would have to be calculated with such an approach. Sampling and calculating CCS values for representative structures can provide a remedy for this problem. That is, the average of CCS values for several sampled frames can be nearly identical to the average of CCS values for the entire trajectory. Here, different methods of sampling have been utilized to reduce the calculation cost. To evaluate these methods and obtain reference CCS values for comparisons, the CCS calculations (trajectory method) were performed on the annealed structures. After plotting the potential energy-CCS distribution for these structures [only K(6),K(11),K(21) charge arrangements and 40-ps SA runs], the entire resulting CCS range was divided equally into 10 regions and the most stable annealed structure in each region was selected as a reference structure. To obtain the accurate CCS values for the conformer types at 300 K originating from these 10 reference structures, the Mobcal [1] software was used and the accurate CCS values (Ω*) were calculated by averaging the CCS values of all the conformers obtained from the corresponding production MD simulations (reference trajectories). The accuracy of the sampling and data mining methods was then evaluated by comparing the outcome of these methods to Ω* values for the 10 reference trajectories.
To test the data mining, several techniques including the method of clustering, the number of generated clusters and selection of the centroid or the closest structure to the centroid as the representative structure for each cluster have been employed and benchmarked to find the most efficient lemma. For all of these approaches, CCS values for a conformer type (the CCS representative of the entire trajectory) have been calculated as:
| (4) |
In Equation 4, Ni , Nt are the number of frames in the ith cluster (cluster members) and total number of MD frames (5,000 for these studies), respectively. The value Ωi is the CCS of the representative structures for the corresponding cluster, while Ωtotal is the calculated CCS value exhibited by a conformer type. The value k, represents the number of generated clusters for each trajectory.
The centroid as a representative structure
Per-atom averaging over the Cartesian coordinates of multiple structures in a trajectory, or a portion of it, leads to the formation of a geometry referred to as a centroid. This mathematically-generated geometry can represent the structures that have been utilized in its genesis; therefore, it can be implied that in order to reduce the computation time in the CCS calculations, the centroid can be used to describe the gas-phase transport of the corresponding cluster components. Because increased clustering of the frames in a MD trajectory positions increasingly similar conformations in a particular cluster, it may be expected to enhance the accuracy of this approach. Therefore, the effect of the number of clusters (k value) on the geometry of the centroid and its CCS value was investigated. Two structures with the lowest mutual RMSD value were selected from a series of random clusters generated after cluster analysis with k values of 1 (no clustering), 10 and 50 using the same production MD trajectory. The new centroids were created for each pair of structures (1st and 2nd structures in Figure 3). The CCS calculation using the Mobcal [1] software was performed. This procedure was repeated for various trajectories. Comparison between the calculated CCS values of the structure pairs with the CCS of their corresponding centroid illustrates that the selection of the centroid as the representative structure provides CCS values that are smaller than that of the initial pair (Figure 3). In addition, as the initial k value and the mutual similarity between each pair increases, the deviation of the CCS of the centroid from the CCS values of the 1st and 2nd structures decreases. The change in this deviation is significantly higher between the 10 to 50 cluster sets (b and c in Figure 3) than the 1 to 10 sets which is in agreement with the cluster behavior at the elbow-point suggested by the TWSS plot. It is worth mentioning that the Mobcal [1] software was incapable of calculating the TM-CCS values for a majority of the centroids resulting from the no clustering analysis most likely due to significant disruption in the geometry of the generated centroids (Figure 3). That is, the centroid geometry tends to improve as the number of clusters increases from 1 to 10 to 50.
Figure 3.
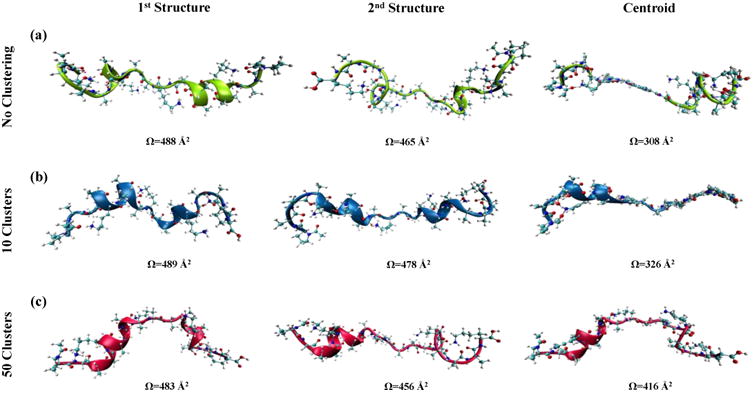
Schematics showing challenges with the use of centroid geometries for CCS calculations. Each row compares the calculated CCS values for the centroid and the original structures. The two structures on the left of each row are the conformers with the maximum RMSD within a single cluster in a production MD run. Geometries on the right are the calculated centroid of the conformers on the left. No cluster analysis is performed for the top row (RMSD= 12.57 Å), and for the middle and bottom rows, the maximum number of clusters is confined to 10 (RMSD= 5.18 Å) and 50 (RMSD= 2.66 Å), respectively.
Supplementary Figure 5 shows the average (over 5,000 structures) potential energy associated with collision cross sections for structures corresponding to 1,000 separate production MD trajectories. The CCS values (Ωtotal) have been calculated using clustering of the 5,000 frames of each trajectory according to Equation 4. In general, no significant difference is observed for different alignment methods (top versus bottom in Supplementary Figure 5) performed before cluster analyses. Although the majority of the resulting CCS values matches the experimental results for the two more compact conformer types of [M+3H+]3+ ions, the overall distribution (Supplementary Figure 5- all panels) is a relatively narrow CCS range and does not correlate to the more elongated conformer type. This can be indicative of inaccuracy in the CCS calculations. Notably, the width of the distribution for 50-k clusters is slightly larger than the 10-k centroid sets with an overall shift toward higher CCS values. This suggests that increasing the number of clusters results in increased accuracy in CCS determinations; however, the accuracy gain with this approach is expected to be limited as further increase in k value beyond 50 (the elbow-point) would not significantly affect the cluster members in terms of similarity. It would, however, increase the computation time.
Because the centroid is a mathematically generated three-dimensional arrangement of the atoms based on averaging the Cartesian coordinates of the multiple structures in the corresponding cluster, in a sense, it lacks any realistic physical meaning. This is observed in the centroid geometries illustrated in Figure 3. Also as demonstrated in Figure 3 and Supplementary Figure 5, this lack of physical meaning in centroid geometry is a source of significant error in CCS calculation. To address this issue, different strategies can be applied. Although these centroids can be reconstructed to a more realistic conformation via a variety of geometry optimization techniques, resulting structures merely follow the energy level criteria which does not guarantee the preservation of the memory of the trajectories from which they have been sampled. It may be argued that this loss in the trajectory information through geometry optimization and structural reconstruction can lead to inaccuracy in the intended trajectory representation. A remedy to these problems is the use of the closest structures to the centroid as the cluster-representative conformation.
Closest structure to a centroid as the representative species
In a cluster, the structure with the lowest RMSD relative to the centroid displays the highest degree of similarity to the centroid among all cluster members without having the attendant structural disruption of the centroid. To investigate the behavior of these more realistic structures and the accuracy of this approach, CCS calculations have been performed for all the closest structures to the centroids obtained from cluster analysis (k=1, 10 and 50). Subsequently, the TM-CCS values of the corresponding trajectories (Ωtotal) were calculated using Equation 4. Since the pre-clustering method of structure alignment (all-atom and backbone-only RMSD-orientation) does not affect the resulting CCS values (Supplementary Figure 5), the CCS calculations were only performed for the backbone-only RMSD-oriented trajectories.
To benchmark the accuracy of different CCS determination approaches, the accurate CCS values (Ω*) for the 10 reference structures are compared with Ωtotal values obtained with these methods. Supplementary Figure 6 shows the Ωtotal values after cluster analysis with k value of 1 and the accurate Ω* values. A comparison between these two data sets illustrates that geometry averaging over the trajectories without subsequent clustering leads to inaccuracy in CCS determination; not a sufficient number of structures is sampled. The error associated with these Ωtotal values is 5.9 % on average with a maximum value of 15 %.
The comparison of the no clustering method introduces the question of how clustering affects the overall accuracy. The Ωtotal values have also been determined using the centroids generated after 10-k and 50-k cluster analysis. Plotting the average potential energy of the trajectories versus their calculated Ωtotal values (Figure 4) reveals a high degree of similarity in energy-CCS distributions obtained from the 10-k and 50-k cluster analysis.
Figure 4.
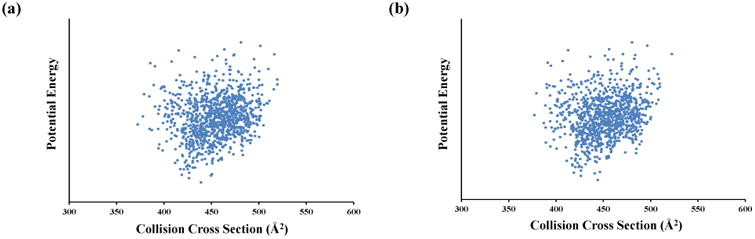
CCS values calculated for structure types (Qtotal , see manuscript) versus the average potential energy. Structures resulting from production MD runs have been backbone-only RMSD aligned prior to the clustering. The left panel shows the results for the 10-k clusters, while the right panel provides results for the 50-k clusters.
For direct comparisons among the accuracy achieved from the various cluster analysis methods, the Ωtotal values obtained from different clustering methods for 10 reference trajectories were compared with their corresponding Ω* values. Figure 5 shows these comparisons as well as the CCS values for each of these 10 reference structures. As mentioned above, these 0 K (annealed) structures do not convey information about peptide ion dynamics and therefore do not accurately capture the transport properties of the conformers at 300 K as indicated by the CCS value differences shown in Figure 5.
Figure 5.
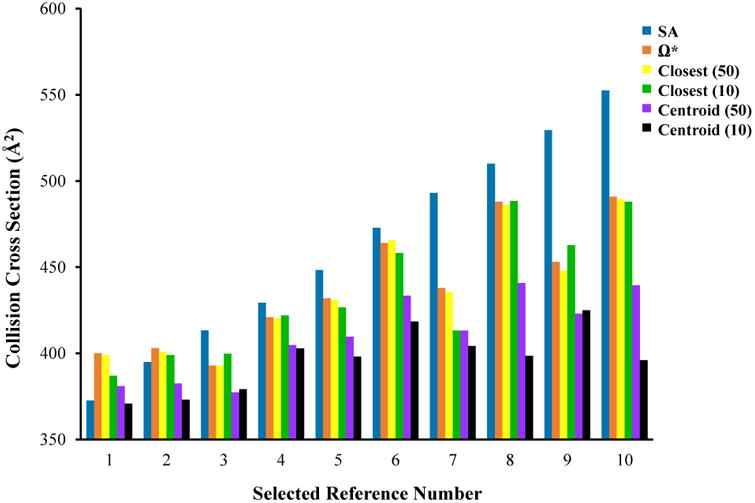
Bar graph showing the comparison of calculated CCS values for 10 selected reference trajectories (or annealed structures) obtained from different clustering approaches. The legend illustrates the bar colors corresponding to the CCS values for the 10 annealed structures from SA runs (SA); the accurate reference CCS values for all 5,000 conformers within 10 reference MD trajectories (Ω*); the Ωtotal values for the 50-k clustering method using the closest structure to the centroid [closest (50)] the Ωtotal values for a k=10 clustering method using the closest structure to the centroid [closest (10)] the Ωtotal values for a k=50 clustering method using centroids [Centroid (50)] and the Ωtotal values for 10-k clustering method using the centroids [Centroid (10)].
A useful comparison for this discussion is that of the Ωtotal values calculated after cluster analysis with k values of 10 and 50 while using the centroids as the representative structures. In comparison with Ω* the Ωtotal values for the former clustering method lead to a 9.5 % error on average with a maximum value of 23 %. These values decrease to 6.3 % and 10 %, respectively, for the latter cluster analysis (k=50). Such large error values support the claim of the inadequacy of centroids to represent the clusters and, by extension, the overall trajectory CCS values.
The Ωtotal values of the 10-k and 50-k cluster analyses obtained while utilizing the closest structures to the centroids as the cluster-representative members are also shown in Figure 5. Overall, the 10-k results exhibit a larger deviation from Ω*. The average error associated with this analysis is 1.7% with a maximum value of 5.6 %. For the same dataset, as the number of clusters generated increases to 50, the error decreases to 0.39 % and 0.97 % as the average and maximum values, respectively.
Overall, the selection of the closest structure to the centroid as the cluster-representative conformer rather than the centroid itself, not only improves the overall accuracy but also captures the change in accuracy between the 10-k and 50-k cluster analyses (Figure 5). Thus the approach can improve the computation time by utilizing a cluster analysis with lower k values depending on an acceptable error threshold. Considering the error threshold of 1% to 2% in our experimental analyses, the results generated with the 50-k, closest-structure-to-the-centroid clustering method will be employed in future studies as described in subsequent manuscripts associated with this work.
Candidate structures
Experimental CCS values can be calculated from drift time values for dataset features [11]. A time increment of 0.1 ms has been utilized to scan the drift time selection for these ions; therefore, a maximum error of 0.05 ms can be associated with the arrival time measurements. Here it is noted that this represents an upper limit. The drift time measurements are checked daily for accuracy by comparison to [M+3H]3+ and [M+2H]2+ angiotensin I and bradykinin ions, respectively. Collision cross sections agree with reported values to <±1 %. Notably, for triplicate analyses of these ions, scaled drift times (accounting for buffer gas pressure) were not observed to change (i.e., <0.1 ms). For the [M+3H]3+ peptide ions three different conformer types are observed. The conformer type having the greatest intensity was chosen for the gas-phase HDX measurements. Therefore, the focus here is on the compact conformer type (Ω= 417 ± Å2) and the slightly more diffuse conformer type (Ω= 438 ± Å2).
Ωtotal values have been determined for four distinct sets of simulations including two different charge arrangements and two different conformational space sampling methods of 40-ps and 1200-ps SA runs (see Experimental section). These calculated values for the corresponding trajectories have been compared with experimental CCS values to obtain a match for the compact and more elongated ion conformations (Figure 1). The production MD trajectories resulting in matching CCS values have been selected as the candidate-structure-originating trajectories. For the compact conformer type, 63 (out of 4,000) trajectories fall within the CCS range for compact ions, and 261 trajectories result in Ωtotal values that match the CCS value of the more diffuse conformer type. Figure 6 shows two structures for each conformer type with different protonation sites. Notably, these conformations are the annealed structures at 0 K that provided trajectories with matching CCS from dynamics at 300 K. Two candidate structures with matching CCS values for the compact conformer contain protonation sites of K(6), K(11), and K(21). The first structure exhibits α-helical secondary structure extending from the K(6) to the K(16) residue, while the second structure exhibits primarily a random coil conformer type. For the compact conformer type having the protonation site of K(6), K(16), and K(21), differences in structures are also observed (Figure 6). One displays a turn in the center while the second has two turns at the N-terminus and the C-terminus. For the more diffuse conformer types, Figure 6 shows examples in which one structure exhibits more helical nature while the second contains more random coil characteristics for both charge configurations. Notably, all other candidate structures exhibit a wide degree of structural difference. Overall, structures with significant α-helical character exhibit greater stability for this model peptide. This may be expected based on the high α-helix propensity of a polyalanine peptide and the ability to preserve such structures into the gas phase [10, 60].
Figure 6.
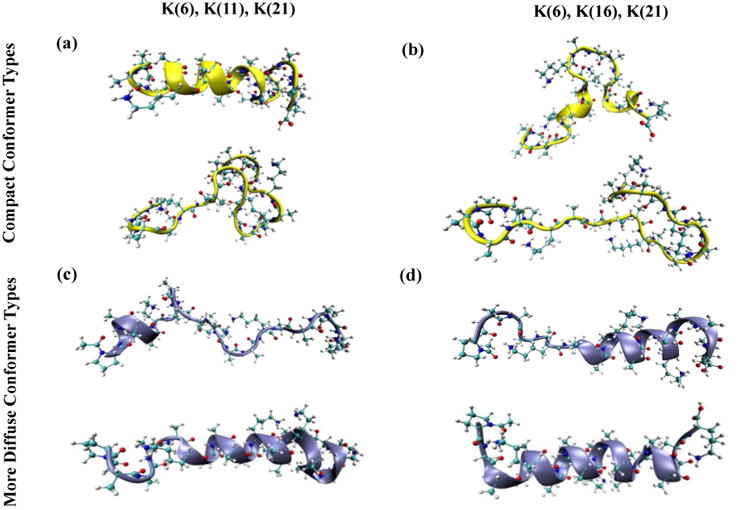
Several in-silico structures (annealed) with matching CCS values to experimentally determined CCS values for compact (top panels) and diffuse [M+3H+]3+ ions (bottom panels) of the model peptide Acetyl-PAAAAKAAAAKAAAAKAAAAK. The left panels show structures with protonation sites of K(6), K(11), K(21), and the right panels show those with protonation sites of K(6), K(16), K(21). The structure were obtained from the higher-energy and thermodynamically-stable pool of in-silico data. The CCS comparisons were performed between experimentally-obtained CCS values and the calculated Ωtotal values for trajectories at 300 K and originating from the annealed structures.
A major aim of this study has been to find the best structure (or structures) with significant similarity to the gas-phase conformer types. Figure 6 demonstrates that another criterion for filtering candidate structures is necessary. It may be argued that potential energy values can be utilized to find the most stable gas-phase structure and thus be presented as the best match. This argument would be correct if the ions presented equilibrated gas-phase structures, and, as mentioned above, some studies provide evidence contradicting this assumption [7, 19, 23]. In addition to this challenge, the reliability of the comparison to CCS values alone cannot be evaluated. That is, the method results with an in-silico structure with no further provision to check the accuracy of the match. It can also be argued that the structures sampled by the MD procedure may not contain species resembling the actual gas-phase conformer type produced in the experiment; that is, there is no guarantee that conformational space sampling produces all types of structures.
To begin addressing these issues, gas-phase HDX has been introduced as a second criterion for structural characterization [27-29, 61, 62]. In the second installment of this work, comparisons of the experimental deuterium uptake values and the hypothetical values (obtained from a modified algorithm assessing the accessibility of hydrogens on candidate structures) are used to improve conformer selection and to assign relative population values along a MD trajectory.
Conclusions
CCS measurements coupled with MD simulations can serve as a tool for biomolecule structure investigations. Using this approach, a model peptide is employed to develop an advanced protocol for MD simulations. Extensive parameter optimization and method validation are utilized to perform comprehensive sampling of higher-energy and more thermodynamically-stable structures which exhibited an extended range of structural variety. Therefore, the sampled structures accounted for a wide range of structure types that may be produced by electrospray ionization (Supplementary Figure 7).
MD simulations at 300 K have been carried out to monitor gas-phase ion dynamics. CCS calculations reveal that no single structure is representative of the variety of conformers accessed by structural fluctuations. However, careful clustering and data mining can be used to obtain accurate CCS values. Although, as shown here, the data mining with clustering that employs the closest structure to the centroid as a representative structure provides an answer to this problem, the number of clusters plays an important role in the accuracy of the calculated CCS values. Here, it is proposed to use cluster numbers associated with the elbow-point criterion for improved accuracy. CCS values calculated using the optimized parameters exhibit < 0.1 % error compared to the accurate reference (Ω*) values.
Experimental CCS values are used to filter the sampled structures and result in more than 300 nominal structures. A wide variety of structures, many with completely different secondary structural aspects, meet the CCS filtering criterion. From the experimental data, there is no preference for selection among these structure or to assign relative population numbers for these species. Gas-phase HDX is proposed to serve as a second criterion to begin addressing this problem. Upcoming work will show the application of HDX filtering for assigning the populations of structures from different structural types. Hydrogen accessibility modeling will be utilized to produce a hypothetical deuterium uptake pattern for each in-silico structure from which a population number can be allotted to structure types.
Supplementary Material
Acknowledgments
We are grateful for financial support from the National Institutes of Health (R01GM114494). We also are grateful to Mr. Chitrak Gupta for helpful discussions regarding the secondary structure analysis.
References
- 1.Jarrold MF. Mobcal, A program to calculate mobilities. 2/10/2014 2/18/2016. [Accessed 1 June 2014]; Available from: http://www.indiana.edu/∼nano/software.html.
- 2.Marx D, Tuckerman ME, Hutter J, Parrinello M. The nature of the hydrated excess proton in water. Nature. 1999;397:601–604. [Google Scholar]
- 3.Shin JW, Hammer NI, Diken EG, Johnson MA, Walters RS, Jaeger TD, et al. Infrared signature of structures associated with the H+(H2O)(n) (n=6 to 27) clusters. Science. 2004;304:1137–1140. doi: 10.1126/science.1096466. [DOI] [PubMed] [Google Scholar]
- 4.McAllister RG, Konermann L. Challenges in the Interpretation of Protein H/D Exchange Data: A Molecular Dynamics Simulation Perspective. Biochemistry. 2015;54:2683–2692. doi: 10.1021/acs.biochem.5b00215. [DOI] [PubMed] [Google Scholar]
- 5.Skinner JJ, Lim WK, Bedard S, Black BE, Englander SW. Protein hydrogen exchange: Testing current models. Protein Science. 2012;21:987–995. doi: 10.1002/pro.2082. [DOI] [PMC free article] [PubMed] [Google Scholar]
- 6.Hoaglund-Hyzer CS, Counterman AE, Clemmer DE. Anhydrous protein ions. Chemical Reviews. 1999;99:3037–3079. doi: 10.1021/cr980139g. [DOI] [PubMed] [Google Scholar]
- 7.Fort KL, Silveira JA, Pierson NA, Servage KA, Clemmer DE, Russell DH. From Solution to the Gas Phase: Factors That Influence Kinetic Trapping of Substance P in the Gas Phase. Journal of Physical Chemistry B. 2014;118:14336–14344. doi: 10.1021/jp5103687. [DOI] [PubMed] [Google Scholar]
- 8.Pepin R, Laszlo KJ, Marek A, Peng B, Bush MF, Lavanant H, et al. Journal of The American Society for Mass Spectrometry. 2016. Toward a Rational Design of Highly Folded Peptide Cation Conformations 3D Gas-Phase Ion Structures and Ion Mobility Characterization; pp. 1–14. [DOI] [PMC free article] [PubMed] [Google Scholar]
- 9.Fernandez-Lima FA, Wei H, Gao YQ, Russell DH. On the Structure Elucidation Using Ion Mobility Spectrometry and Molecular Dynamics. Journal of Physical Chemistry A. 2009;113:8221–8234. doi: 10.1021/jp811150q. [DOI] [PubMed] [Google Scholar]
- 10.Kohtani M, Jones TC, Sudha R, Jarrold MF. Proton transfer-induced conformational changes and melting in designed peptides in the gas phase. Journal of the American Chemical Society. 2006;128:7193–7197. doi: 10.1021/ja056745s. [DOI] [PubMed] [Google Scholar]
- 11.Mason EA, Mcdaniel EW. Transport properties of ions in gases. JohnWiley & sons; Hoboken: 1988. [Google Scholar]
- 12.Clemmer DE, Hudgins RR, Jarrold MF. Naked Protein Conformations - Cytochrome-C in the Gas-Phase. Journal of the American Chemical Society. 1995;117:10141–10142. [Google Scholar]
- 13.Shvartsburg AA, Jarrold MF. An exact hard-spheres scattering model for the mobilities of polyatomic ions. Chemical Physics Letters. 1996;261:86–91. [Google Scholar]
- 14.Shvartsburg AA, Schatz GC, Jarrold MF. Mobilities of carbon cluster ions: Critical importance of the molecular attractive potential. Journal of Chemical Physics. 1998;108:2416–2423. [Google Scholar]
- 15.Shelimov KB, Clemmer DE, Hudgins RR, Jarrold MF. Protein structure in vacuo: Gas-phase confirmations of BPTI and cytochrome c. Journal of the American Chemical Society. 1997;119:2240–2248. [Google Scholar]
- 16.Wyttenbach T, Bowers MT. Structural Stability from Solution to the Gas Phase: Native Solution Structure of Ubiquitin Survives Analysis in a Solvent-Free Ion Mobility-Mass Spectrometry Environment. Journal of Physical Chemistry B. 2011;115:12266–12275. doi: 10.1021/jp206867a. [DOI] [PubMed] [Google Scholar]
- 17.Chen SH, Russell DH. How Closely Related Are Conformations of Protein Ions Sampled by IM-MS to Native Solution Structures? Journal of the American Society for Mass Spectrometry. 2015;26:1433–1443. doi: 10.1007/s13361-015-1191-1. [DOI] [PubMed] [Google Scholar]
- 18.Gidden J, Bowers MT. Gas-phase conformational and energetic properties of deprotonated dinucleotides. European Physical Journal D. 2002;20:409–419. [Google Scholar]
- 19.Pierson NA, Valentine SJ, Clemmer DE. Evidence for a Quasi-Equilibrium Distribution of States for Bradykinin M+3H (3+) Ions in the Gas Phase. Journal of Physical Chemistry B. 2010;114:7777–7783. doi: 10.1021/jp102478k. [DOI] [PMC free article] [PubMed] [Google Scholar]
- 20.Heck AJR, van den Heuvel RHH. Investigation of intact protein complexes by mass spectrometry. Mass Spectrometry Reviews. 2004;23:368–389. doi: 10.1002/mas.10081. [DOI] [PubMed] [Google Scholar]
- 21.Heck AJR. Native mass spectrometry: a bridge between interactomics and structural biology. Nature Methods. 2008;5:927–933. doi: 10.1038/nmeth.1265. [DOI] [PubMed] [Google Scholar]
- 22.Ruotolo BT, Giles K, Campuzano I, Sandercock AM, Bateman RH, Robinson CV. Evidence for macromolecular protein rings in the absence of bulk water. Science. 2005;310:1658–1661. doi: 10.1126/science.1120177. [DOI] [PubMed] [Google Scholar]
- 23.Silveira JA, Fort KL, Kim D, Servage KA, Pierson NA, Clemmer DE, et al. From Solution to the Gas Phase: Stepwise Dehydration and Kinetic Trapping of Substance P Reveals the Origin of Peptide Conformations. Journal of the American Chemical Society. 2013;135:19147–19153. doi: 10.1021/ja4114193. [DOI] [PubMed] [Google Scholar]
- 24.Pierson NA, Chen LX, Valentine SJ, Russell DH, Clemmer DE. Number of Solution States of Bradykinin from Ion Mobility and Mass Spectrometry Measurements. Journal of the American Chemical Society. 2011;133:13810–13813. doi: 10.1021/ja203895j. [DOI] [PMC free article] [PubMed] [Google Scholar]
- 25.Hudgins RR, Woenckhaus J, Jarrold MF. High resolution ion mobility measurements for gas phase proteins: correlation between solution phase and gas phase conformations. International Journal of Mass Spectrometry. 1997;165:497–507. [Google Scholar]
- 26.Shi HL, Clemmer DE. Evidence for Two New Solution States of Ubiquitin by IMS-MS Analysis. Journal of Physical Chemistry B. 2014;118:3498–3506. doi: 10.1021/jp4097327. [DOI] [PMC free article] [PubMed] [Google Scholar]
- 27.Khakinejad M, Kondalaji S, Tafreshian A, Valentine S. Gas-Phase Hydrogen-Deuterium Exchange Labeling of Select Peptide Ion Conformer Types: a Per-Residue Kinetics Analysis. Journal of The American Society for Mass Spectrometry. 2015;26:1115–1127. doi: 10.1007/s13361-015-1127-9. [DOI] [PubMed] [Google Scholar]
- 28.Khakinejad M, Kondalaji SG, Donohoe GC, Valentine SJ. Ion Mobility Spectrometry-Hydrogen Deuterium Exchange Mass Spectrometry of Anions: Part 2. Assessing Charge Site Location and Isotope Scrambling. Journal of the American Society for Mass Spectrometry. 2016;27:451–461. doi: 10.1007/s13361-015-1304-x. [DOI] [PMC free article] [PubMed] [Google Scholar]
- 29.Khakinejad M, Kondalaji SG, Maleki H, Arndt JR, Donohoe GC, Valentine SJ. Combining Ion Mobility Spectrometry with Hydrogen-Deuterium Exchange and Top-Down MS for Peptide Ion Structure Analysis. Journal of the American Society for Mass Spectrometry. 2014;25:2103–2115. doi: 10.1007/s13361-014-0990-0. [DOI] [PubMed] [Google Scholar]
- 30.Mesleh MF, Hunter JM, Shvartsburg AA, Schatz GC, Jarrold MF. Structural information from ion mobility measurements: Effects of the long-range potential. Journal of Physical Chemistry. 1996;100:16082–16086. [Google Scholar]
- 31.Wyttenbach T, Pierson NA, Clemmer DE, Bowers MT. In: Ion Mobility Analysis of Molecular Dynamics. Johnson MA, Martinez TJ, editors. 2014. [DOI] [PubMed] [Google Scholar]
- 32.Breuker K, McLafferty FW. Stepwise evolution of protein native structure with electrospray into the gas phase, 10(-12) to 10(2) S. Proceedings of the National Academy of Sciences of the United States of America. 2008;105:18145–18152. doi: 10.1073/pnas.0807005105. [DOI] [PMC free article] [PubMed] [Google Scholar]
- 33.Konermann L, Ahadi E, Rodriguez AD, Vahidi S. Unraveling the Mechanism of Electrospray Ionization. Analytical Chemistry. 2013;85:2–9. doi: 10.1021/ac302789c. [DOI] [PubMed] [Google Scholar]
- 34.Konermann L, McAllister RG, Metwally H. Molecular Dynamics Simulations of the Electrospray Process: Formation of NaCI Clusters via the Charged Residue Mechanism. Journal of Physical Chemistry B. 2014;118:12025–12033. doi: 10.1021/jp507635y. [DOI] [PubMed] [Google Scholar]
- 35.Yue XF, Vahidi S, Konermann L. Insights into the Mechanism of Protein Electrospray Ionization From Salt Adduction Measurements. Journal of the American Society for Mass Spectrometry. 2014;25:1322–1331. doi: 10.1007/s13361-014-0905-0. [DOI] [PubMed] [Google Scholar]
- 36.Hogan CJ, Carroll JA, Rohrs HW, Biswas P, Gross ML. Combined Charged Residue-Field Emission Model of Macromolecular Electrospray Ionization. Analytical Chemistry. 2009;81:369–377. doi: 10.1021/ac8016532. [DOI] [PMC free article] [PubMed] [Google Scholar]
- 37.Donohoe GC, Maleki H, Arndt JR, Khakinejad M, Yi J, McBride C, et al. A New Ion Mobility-Linear Ion Trap Instrument for Complex Mixture Analysis. Analytical Chemistry. 2014;86:8121–8128. doi: 10.1021/ac501527y. [DOI] [PMC free article] [PubMed] [Google Scholar]
- 38.Case DA, Darden TA, Cheatham ITE, Simmerling CL, Wang J, Duke RE, Luo R, Walker RC, Zhang W, Merz KM, Roberts B, Hayik S, Roitberg A, Seabra G, Swails J, Goetz AW, Kolossváry I, Wong KF, Paesani F, Vanicek J, Wolf RM, Liu J, Wu X, Brozell SR, Steinbrecher T, Gohlke HQC, Ye X, Wang J, Hsieh MJ, Cui G, Roe DR, Mathews DH, Seetin MG, Salomon-Ferrer R, Sagui C, Babin V, Luchko T, Gusarov S, Kovalenko A, Kollman PA. AMBER 12. San Francisco: University of California; 2012. [Google Scholar]
- 39.Schmidt MW, Baldridge KK, Boatz JA, Elbert ST, Gordon MS, Jensen JH, et al. General Atomic and Molecular Electronic-Structure System. Journal of Computational Chemistry. 1993;14:1347–1363. [Google Scholar]
- 40.Gordon MS, Schmidt MW. Advances in electronic structure theory: GAMESS a decade later. Theory and Applications of Computational Chemistry: The First Forty Years. 2005:1167–1189. [Google Scholar]
- 41.Vanquelef E, Simon S, Marquant G, Garcia E, Klimerak G, Delepine JC, et al. RED Server: a web service for deriving RESP and ESP charges and building force field libraries for new molecules and molecular fragments. Nucleic Acids Research. 2011;39:W511–W517. doi: 10.1093/nar/gkr288. [DOI] [PMC free article] [PubMed] [Google Scholar]
- 42.Wang F, Becker JP, Cieplak P, Dupradeau FY. RED Python: Object oriented programming for Amber force fields. Abstracts of Papers of the American Chemical Society. 2014;247:1. [Google Scholar]
- 43.Dupradeau FY, Pigache A, Zaffran T, Savineau C, Lelong R, Grivel N, et al. The R.ED. tools: advances in RESP and ESP charge derivation and force field library building. Physical Chemistry Chemical Physics. 2010;12:7821–7839. doi: 10.1039/c0cp00111b. [DOI] [PMC free article] [PubMed] [Google Scholar]
- 44.Bayly CI, Cieplak P, Cornell WD, Kollman PA. A Well-Behaved Electrostatic Potential Based Method Using Charge Restraints for Deriving Atomic Charges - the Resp Model. Journal of Physical Chemistry. 1993;97:10269–10280. [Google Scholar]
- 45.Wyttenbach T, von Helden G, Bowers MT. Gas-Phase Conformation of Biological Molecules: Bradykinin. Journal of the American Chemical Society. 1996;118:8355–8364. [Google Scholar]
- 46.Berendsen HJC, Postma JPM, Vangunsteren WF, Dinola A, Haak JR. Molecular-Dynamics with Coupling to an External Bath. Journal of Chemical Physics. 1984;81:3684–3690. [Google Scholar]
- 47.Wu X, Brooks BR. Self-guided Langevin dynamics simulation method. Chemical Physics Letters. 2003;381:512–518. [Google Scholar]
- 48.Uberuaga BP, Anghel M, Voter AF. Synchronization of trajectories in canonical molecular-dynamics simulations: Observation, explanation, and exploitation. Journal of Chemical Physics. 2004;120:6363–6374. doi: 10.1063/1.1667473. [DOI] [PubMed] [Google Scholar]
- 49.Roe DR, Cheatham TE. PTRAJ and CPPTRAJ: Software for Processing and Analysis of Molecular Dynamics Trajectory Data. Journal of Chemical Theory and Computation. 2013;9:3084–3095. doi: 10.1021/ct400341p. [DOI] [PubMed] [Google Scholar]
- 50.Feig M, Karanicolas J, Brooks CL. MMTSB Tool Set: enhanced sampling and multiscale modeling methods for applications in structural biology. J Mol Graph. 2004;22:377–395. doi: 10.1016/j.jmgm.2003.12.005. [DOI] [PubMed] [Google Scholar]
- 51.Bruccoleri RE, Karplus M. Conformational Sampling Using High-Temperature Molecular-Dynamics. Biopolymers. 1990;29:1847–1862. doi: 10.1002/bip.360291415. [DOI] [PubMed] [Google Scholar]
- 52.Levy Y, Becker OM. Energy landscapes of conformationally constrained peptides. The Journal of Chemical Physics. 2001;114:993–1009. [Google Scholar]
- 53.Baysal C, Meirovitch H. Efficiency of simulated annealing for peptides with increasing geometrical restrictions. Journal of Computational Chemistry. 1999;20:1659–1670. [Google Scholar]
- 54.Frishman D, Argos P. Knowledge-based protein secondary structure assignment. Proteins. 1995;23:566–579. doi: 10.1002/prot.340230412. [DOI] [PubMed] [Google Scholar]
- 55.Von Helden G, Wyttenbach T, Bowers MT. Inclusion of a Maldi Ion-Source in the Ion Chromatography Technique - Conformational Information on Polymer and Biomolecular Ions. International Journal of Mass Spectrometry. 1995;146:349–364. [Google Scholar]
- 56.Valentine SJ, Clemmer DE. Temperature-dependent H/D exchange of compact and elongated cytochrome c ions in the gas phase. Journal of the American Society for Mass Spectrometry. 2002;13:506–517. doi: 10.1016/S1044-0305(02)00372-0. [DOI] [PubMed] [Google Scholar]
- 57.Viehland LA, Mason EA. Gaseous Ion Mobility in Electric-Fields of Arbitrary Strength. Annals of Physics. 1975;91:499–533. [Google Scholar]
- 58.Chou KC, Carlacci L. Simulated Annealing Approach to the Study of Protein Structures. Protein Eng. 1991;4:661–667. doi: 10.1093/protein/4.6.661. [DOI] [PubMed] [Google Scholar]
- 59.Wilson SR, Cui W, Moskowitz JW, Schmidt KE. Applications of Simulated Annealing to the Conformational-Analysis of Flexible Molecules. Journal of Computational Chemistry. 1991;12:342–349. [Google Scholar]
- 60.Counterman AE, Clemmer DE. Large anhydrous polyalanine ions: Evidence for extended helices and onset of a more compact state. Journal of the American Chemical Society. 2001;123:1490–1498. doi: 10.1021/ja9940625. [DOI] [PubMed] [Google Scholar]
- 61.Donohoe GC, Khakinejad M, Valentine SJ. Ion Mobility Spectrometry-Hydrogen Deuterium Exchange Mass Spectrometry of Anions: Part 1. Peptides to Proteins. Journal of the American Society for Mass Spectrometry. 2015;26:564–576. doi: 10.1007/s13361-014-1045-2. [DOI] [PubMed] [Google Scholar]
- 62.Khakinejad M, Ghassabi Kondalaji S, Donohoe GC, Valentine SJ. Ion Mobility Spectrometry-Hydrogen Deuterium Exchange Mass Spectrometry of Anions: Part 3. Estimating Surface Area Exposure by Deuterium Uptake. Journal of the American Society for Mass Spectrometry. 2016;27:462–473. doi: 10.1007/s13361-015-1305-9. [DOI] [PMC free article] [PubMed] [Google Scholar]
Associated Data
This section collects any data citations, data availability statements, or supplementary materials included in this article.