

In only rare cases will earthquake early warning systems be able to provide useful warnings for high levels of ground motion.
Abstract
The basic physics of earthquakes is such that strong ground motion cannot be expected from an earthquake unless the earthquake itself is very close or has grown to be very large. We use simple seismological relationships to calculate the minimum time that must elapse before such ground motion can be expected at a distance from the earthquake, assuming that the earthquake magnitude is not predictable. Earthquake early warning (EEW) systems are in operation or development for many regions around the world, with the goal of providing enough warning of incoming ground shaking to allow people and automated systems to take protective actions to mitigate losses. However, the question of how much warning time is physically possible for specified levels of ground motion has not been addressed. We consider a zero-latency EEW system to determine possible warning times a user could receive in an ideal case. In this case, the only limitation on warning time is the time required for the earthquake to evolve and the time for strong ground motion to arrive at a user’s location. We find that users who wish to be alerted at lower ground motion thresholds will receive more robust warnings with longer average warning times than users who receive warnings for higher ground motion thresholds. EEW systems have the greatest potential benefit for users willing to take action at relatively low ground motion thresholds, whereas users who set relatively high thresholds for taking action are less likely to receive timely and actionable information.
INTRODUCTION
Earthquake early warning (EEW) systems rapidly detect and characterize ongoing earthquakes in real time to provide advance warnings of impending ground motion. They use the information contained in the early parts of the typically low-amplitude ground motion waveforms to estimate the ensuing and potentially large-amplitude ground motion. Because EEW alert information can be transmitted faster than seismic wave propagation speed, such ground motion warnings may arrive at a target site before the strong shaking itself, thereby providing invaluable time for both people and automated systems to take actions to mitigate earthquake-related injury and losses. These actions might range from simple procedures like warning people to get themselves to a safe location to complex automated procedures like halting airport takeoffs and landings (1). There are, however, basic seismological principles that provide physical bounds on how quickly an alert can be issued, how early a user can receive a warning before strong shaking arrives, and how accurately the strength of that shaking can be estimated. Here, we address the first two questions to establish the ultimate time performance that a physically realistic EEW system can achieve. This issue of how much advance warning an EEW alert can provide for specific levels of ground motion (that is, timeliness) has not been previously addressed, leaving both user expectations and overall system performance poorly defined.
EEW systems are in operation in many parts of the world to provide warnings to populations at high seismic hazard. Mexico has successfully been operating an EEW system since 1991 (SASMEX) (2) that alerts upon the occurrence of a large earthquake, thereby implying some level of ground motion but without quantitatively predicting it. In contrast, the Japan Meteorological Agency (JMA) EEW system that has been operating since 2007 (3) and the ShakeAlert EEW system being developed for the west coast of the United States (4) estimate the location and magnitude of an earthquake, which are used in a ground motion prediction equation (GMPE) to calculate expected ground shaking; if the expected ground motion is greater than a threshold that some user has specified, that user is alerted. The JMA system provides alerts to a subprefecture whenever ground motions are expected to exceed JMA intensity 4 within that subprefecture; typically, initial alerts are issued to subprefecture(s) closest to the epicenter, and more distant regions are alerted if the area affected grows, as the rupture evolves and magnitude estimates are updated. The JMA system has issued hundreds of alerts, including alerts sent to several million people during the 2011 M9.0 Tohoku earthquake (5).
Existing estimates of the timeliness of EEW alerts are based on the assumption that either the final rupture size and extent is known immediately (6, 7) or the final magnitude of an earthquake can be determined from recordings of just several seconds of the initial P wave (8, 9). However, others have argued that warning time will be limited because the final magnitude of an earthquake is undetermined at the time of nucleation (10–13). This argument is based on theoretical considerations (14) and observational studies suggesting that the earliest phase arrivals of larger earthquakes are indistinguishable from small earthquakes (15–18). More recently, Meier et al. (19) demonstrated that small and large ruptures have indistinguishable onsets by examining recordings from a large data set of shallow crustal earthquakes (4 ≤ M ≤ 8), suggesting that rupture onsets are not diagnostic of final rupture size.
Additional evidence comes from the observed performance of operational EEW systems. Recent large earthquakes (such as the 2011 M9.0 Tohoku, 2016 M7.0 Kumamoto, and 2008 M6.9 Iwate-Miyagi Nairiku, Japan earthquakes) have shown that real-time EEW magnitude estimates increase with time as they track the earthquake moment release (Fig. 1) (20, 21). Thus, here, we assume that EEW systems cannot predict the final rupture size and can only observe the evolving moment release.
Fig. 1. Earthquake magnitude and alert evolution.

Evolution of EEW magnitude estimates for the (A) 2011 M9.0 Tohoku, (B) 2016 M7.0 Kumamoto, and (C) 2008 M6.9 Iwate-Miyagi Nairiku, Japan earthquakes. We compare the time evolution of magnitude estimates from the JMA EEW system (blue) to the inferred actual magnitude evolution based on kinematic rupture modeling (black) (35–37). The JMA estimates have the same shape as the actual source time function (STF) but are time-shifted. This indicates that the EEW magnitude estimates are following the moment release of the earthquake as it evolves with time (with some delay due to system latency) rather than predicting the final magnitude. Note that the JMA EEW magnitude estimate for the Tohoku earthquake saturates near M8 because of limitations in the frequency band used (38).
Here, we focus on the expected performance of a hypothetical EEW system that provides quantitative estimates of ground motion for a user’s location, and develop a framework for estimating the fastest possible warning time that a user can receive, given that the final rupture size is not predictable. “Warning time” (Twarn) here is defined as the time difference between when the user receives an alert [the “alert time” (Talert)] for a given threshold of ground motion and when that threshold of ground motion arrives at that user’s location (Fig. 2, inset). We assume that the early warning system can instantaneously and perfectly estimate the location and current moment release of the rupture. The time to issue an alert is controlled by the user’s ground motion threshold for taking action and the minimum magnitude needed to achieve that threshold at various distances from a (possibly still evolving) earthquake source. To estimate alert times, we use fundamental seismological relationships and observations. First, we use a GMPE that specifies peak ground acceleration (PGA) [or peak ground velocity (PGV); see the Supplementary Materials] as a function of magnitude and distance from the rupture to calculate the minimum magnitude that will yield at least a certain threshold level of shaking at any distance (Fig. 3, A and B). Second, we use the fastest physically plausible source time functions to estimate the earliest time that our system could estimate that the rupture will exceed that minimum magnitude (Fig. 3C). Last, we use an extensive collection of observed threshold arrival times to determine when in the waveform the ground motion thresholds will be exceeded. Because an alert can be issued as soon as the early warning system estimates that the rupture will exceed that minimum magnitude, the time required to issue an alert is independent of the final magnitude or final PGA and is simply dependent on the user distance and ground motion threshold of interest. We first consider a point source rupture and then repeat our theoretical analysis for a finite source whose rupture propagates unilaterally at constant velocity.
Fig. 2. Schematic of Talert, Twarn, and finite rupture design.
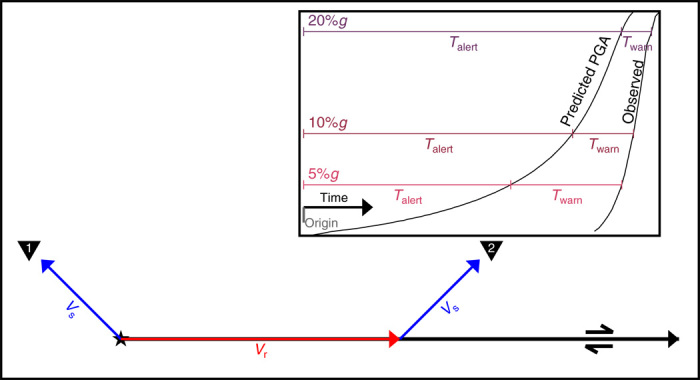
Inset: Schematic of the time required to issue an alert (Talert) and the amount of warning time a user receives (Twarn) for 5, 10, and 20%g thresholds at a given location. Talert is the time from origin until the EEW system can predict that the PGA at the user’s location will exceed the specified threshold. The amount of warning time the user will receive (Twarn) is the time difference between Talert and when the ground motion at the user’s location actually exceeds the given threshold. Main figure: Map view showing fault geometry (black line) in relation to rupture propagation direction (red) and S-wave propagation directions (blue) for two different user locations, relative to the rupture initiation point (star). For the finite fault examples, the rupture is assumed to propagate unilaterally at constant rupture velocity, Vr = 3 km/s. For locations in the backward rupture direction (1) and in the point source examples, the strong ground motion is assumed to be carried by the direct S wave propagating at Vs = 3.5 km/s. In the forward rupture direction, the arrival of strong ground motion is delayed because it is assumed to first propagate along the fault with speed Vr before finally traveling to the observer (2) with speed Vs.
Fig. 3. The interdependence of magnitude and distance on resulting PGA thresholds.

(A) Distance decay of PGA as a function of magnitude and distance, with threshold values noted by horizontal lines. (B) Minimum magnitude necessary to produce the four threshold PGA values of 2, 5, 10, and 20%g as a function of distance. (C) Time evolution of moment release for an M8 earthquake. Red line shows assumed moment release rate, M0 ~ Td3, from a circular crack model (24–26). Red dashed line shows speed at which an EEW system could estimate earthquake magnitude under the circular crack model if it estimated magnitude twice as fast as the actual moment release; this is the model used in the point source analysis. Green line is the moment release from a continental strike-slip earthquake that expands as a circular crack until it fills a maximum seismogenic width of 15 km and then expands unilaterally in the along-strike direction assuming a rupture velocity of 3 km/s and magnitude-log area (M-logA) scaling of Hanks and Bakun (29); this is the model used in the finite fault analysis (see text).
RESULTS
How long does it take to issue a ground motion alert?
The amount of warning time provided by an EEW system is the difference between when an alert is issued for a given ground motion threshold and when that threshold of motion is exceeded at the user’s location (Fig. 2). The alert time, in turn, is the elapsed time between when an earthquake begins and when the alert is issued. Here, we use the ground acceleration threshold values of 2, 5, 10, and 20%g, which correspond roughly to Modified Mercalli Intensity IV (light shaking) through VII (very strong shaking).
Specifying a GMPE establishes the magnitude required at any distance to produce each of the four threshold ground motion values (Fig. 3A); we use the GMPE of Chiou and Youngs (22) because of its fairly smooth dependence on magnitude. For simplicity, we consider only the case of crustal vertical strike-slip earthquakes with a maximum magnitude of 8 (the largest observed for strike-slip events in continental crust) and observers located at rock sites. (In a later example, we consider a finite rupture in the San Francisco Bay Area that includes variable site conditions.) The distance R is measured perpendicular to the rupture, consistent with the definition of rupture distance (Rrup) that is used by Chiou and Youngs (22). For each of the four ground acceleration thresholds, we determine the minimum earthquake magnitude that gives rise to the threshold ground motion for a given distance (Fig. 3B). Thus, given some threshold acceleration at a site R km away requires the (growing) earthquake to reach the calculated minimum magnitude for an alert to be issued. (Note that these ground motions are the median expected ground motion for any magnitude and distance and hence do not include considerable uncertainty inherent in the GMPE or variable site conditions—issues that we address in a future study.)
An alert can be issued as soon as the early warning system estimates that the magnitude of the earthquake rupture will exceed the minimum magnitude for producing the threshold ground motion. Causal physics and common sense tell us that it takes time for an earthquake to grow to a certain size, and the bigger the earthquake, the more time it will take to reach its final magnitude. Thus, the current estimated magnitude reflects the part of the rupture that has already occurred and does not predict the final magnitude. Very recent studies using a data set of moment rate functions from kinematic source models of large (M > 7) subduction zone thrust earthquakes (23), however, have shown that final magnitudes can be estimated from data at about one-half of the final source duration because moment rate evolution is fairly symmetric (19). This makes sense intuitively: Earthquake moment rate functions rise to some maximum and then decay in an approximately symmetric fashion (19, 23). Thus, at any point up to maximum moment release rate, the expectation is that the total source duration will be at least twice the current duration of the rupture so that the final moment must be at least that much larger than the moment released so far. For example, if earthquake rupture has continued for 3 s and the moment release rate is still increasing, then we can assume that it will last for at least 6 s, making the current expected minimum magnitude ~M6.5.
It then follows that the time required to issue an alert is half the source duration of the minimum magnitude earthquake that will produce ground motion exceeding the user’s threshold. Thus, we need to know how long it takes a rupture to release that minimum magnitude. We relate the rupture time to the moment magnitude by assuming that the actual moment release is given by the self-similar source time function for a circular crack (Fig. 3C) [see the study of Hanks and Thatcher (24), following the study of Brune (25, 26)]. Using a stress drop (Δσ) of 5 MPa (27) and shear wave velocity (β) of 3.5 km/s, the source duration (Td) of an earthquake with seismic moment (M0) is (red solid line in Fig. 3C)
| (1) |
where the factor of 8.47 arises from Brune’s (26) constant of 7/16 relating stress drop to moment and r, combined with his relationship r = 2.34β/(2πfc) and Td = 1/fc.
At any time, we then take the minimum earthquake magnitude to be that which has twice the source duration (Td) given in Eq. 1 (red dashed line in Fig. 3C). This assumption halves the alert time (Talert). Because the Brune circular crack model has an exceptionally fast moment release rate, which we then double, this analysis yields an optimistic view of the warning time possible with EEW. Although the Brune circular crack is a very simple source model and likely misses the considerable variability of real earthquakes, it works as a good approximation of observed moment release rates for 115 M ≥ 7 subduction zone earthquakes (23) and also matches corner frequency observations for smaller-magnitude earthquakes (fig. S1). However, large strike-slip earthquakes, whose rupture widths are limited by the width of the seismogenic layer and thus can only grow in the along-strike direction, may have slower moment release rates (green line in Fig. 3C), increasing the time required to issue an alert, Talert (fig. S2).
We then combine the duration-magnitude relation with the GMPE and calculate the minimum magnitude required to issue an alert as a function of distance (Fig. 3B). Assuming that an alert can be issued at half the source duration time (red dashed line in Fig. 3C), we calculate the minimum time required to generate a warning that the expected median ground motion from this earthquake will exceed the user’s threshold for a given distance (Fig. 4A). (Other source time functions and complementary results for PGV are shown in fig. S2.) This is the theoretical limit for how early an EEW system can, on average, issue a warning (Talert) to a user located at a given distance from the source. Note that this is the ideal case of a latency-free system. In practice, there would be system latencies (including data telemetry latency and computational time) that would increase Talert in real-world EEW systems.
Fig. 4. Time required to issue an alert and resulting warning time for a point source.
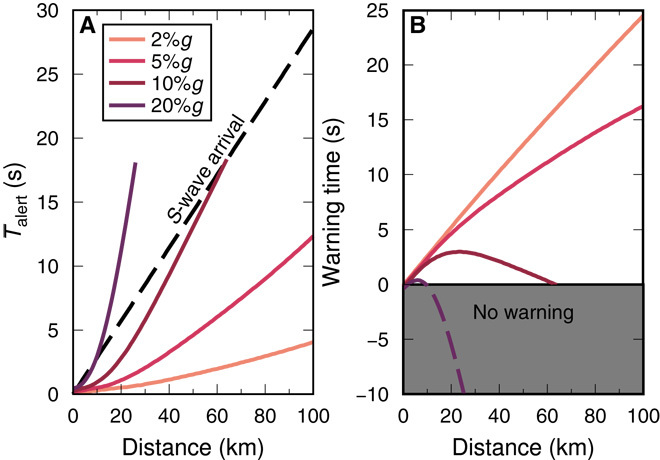
(A) Time required to issue an alert (Talert) as a function of the user’s distance from the rupture for different warning thresholds. The dashed black line is the expected S-wave arrival time. (B) Warning time (Twarn) assuming that the ground motion threshold is exceeded when the S wave arrives at the user’s location, and thus, the user’s warning time is the S-wave arrival time [black dashed line in (A)] minus the time to issue an alert [colored lines in (A)].
At any distance, alerts can be issued more quickly for small ground motion thresholds than for larger thresholds (Fig. 4 and fig. S2). For example, if an M5 takes 1 s to develop and thus we estimate its final magnitude at 0.5 s, we can make a median PGA prediction of ≥2%g for distances less than 25 km and could then issue a warning for 2%g at distances out to 25 km. To issue the same alert to farther distances, say out to 100 km, we would have to wait for the earthquake to grow to become at least a magnitude ~6.7, which would take about 4 s (half of an 8-s total source duration). A higher PGA threshold, say 10%g, would be exceeded by that same M5 event at only very close distances (<7 km). However, to warn a user at 65-km distance that ground motion exceeding 10%g is expected, we would have to wait ~18 s to estimate that an M8 was developing. Larger thresholds and distances thus require more moment release and thus longer times before the earthquake can be identified as one for which the user should be alerted.
How much warning time is there?
If the strong ground motion is carried by the S wave, then the amount of warning time (Twarn) is simply the difference between the S-wave arrival time and the time at which the alert is disseminated (Talert) (Fig. 4). In general, it will not be possible to provide timely EEW alerts for large ground motion thresholds (for example, 20%g) at most distances because the time required to observe enough moment release to predict large ground motions is long compared to the travel time of an S wave (gray area in Fig. 4B).
However, large earthquakes have long shaking durations, and it is possible for strong ground motion to arrive later in the waveform, which would be advantageous as it extends the warning time. To answer the question of when in the wave train the acceleration thresholds are exceeded, we analyzed 48,841 three-component waveforms from 1875 M4 to M8 earthquakes recorded at hypocentral distances less than 100 km. The data set contains all strong motion records available from the Japanese National Research Institute for Earth Science and Disaster Prevention networks (K-NET and KiK-net) with MJMA > 4 and hypocentral depths < 25 km, all available high rate records from the Southern California Seismic Network with catalog magnitudes M > 4 since 1990, and 297 records from the NGA-West1 data set on which the P-wave onset is clearly recorded (see the Supplementary Materials for details).
For each of these recordings, we measured the time at which 2, 5, 10, and 20%g acceleration thresholds are first exceeded on the vector sum of the three-component data, and constructed empirical probability density functions (PDFs) of these arrival times (fig. S7). The strong ground motion is most likely to arrive with the direct S wave, validating our assumption that strong ground motion arrives with the S wave. In only 10 to 20% of cases are the ground motion thresholds exceeded later than the S-wave onset. These ground motion thresholds are often already exceeded within the P wave: 35, 24, 13, and 6% of records exceed 2, 5, 10, and 20%g, respectively, before the S-wave arrival.
Interpreting the point source results
The principal purpose of this paper is to develop a framework for estimating the earliest possible warnings in terms of ground motion thresholds and the minimum magnitudes needed to achieve them at various distances from a (possibly still evolving) source whose location is instantaneously known. By combining a few simple relations, we have computed the earliest possible warnings from an EEW system that calculates ground motion for user locations and thus demonstrated the theoretical and empirical bounds on the timeliness of such a system. These warning times represent theoretical and empirical bounds that actual algorithms can aspire to but never reach. So far, we have ignored the fact that some reaction time is needed to take protective actions (for example, getting under a desk and redirecting airport traffic) and also ignored latencies in actual EEW systems due to data telemetry, analytical computations, alert distribution, and decision analyses (1). Thus, in practice, it is necessary for warning times to be not only nonnegative but also longer than some critical value. For example, if a user requires 3 s to take action and the early warning system requires 2 s for the seismic waves to propagate to the nearest seismometer, have the data telemetered back to the warning center, analyze those data, and distribute an alert, then the effective required minimum warning time for the user is 5 s.
Note that increasing distance from the source does not necessarily result in more warning time (Fig. 4). This is due to the trade-offs between distance and the maximum warnable acceleration, as shown in fig. S3. This inherent inability to provide timely alerts for high ground motion thresholds without also alerting for many earthquakes that ultimately do not produce large ground motion may effectively prevent EEW from being used by end users for whom unnecessary alerts are costly. But for users who are false alert–tolerant and who are willing to be alerted at lower levels of ground motion than that with which they are most concerned, this limitation may be less crucial. For example, train operators may slow their trains on the possibility that an earthquake might grow to produce significant ground motion and then simply resume service if an alert turns out to have been unwarranted in retrospect. In some cases (for example, exercising protective measures such as drop cover and hold on), these low-level alerts might also be part of an effective training regimen, increasing earthquake awareness and preparedness in the event of less frequent damaging earthquakes (28). Thus, users who are only concerned with high levels of ground motion might choose to receive alerts for more moderate earthquakes that might continue to grow, although most of these warnings will turn out to have been false alerts in the sense that they triggered actions that turned out to be unnecessary. (Here, we define a false alert to be when an alert is issued to a user, but the observed ground motions do not reach or exceed that user’s damage threshold.) Except in certain cases, such as an intense aftershock sequence, the rate of moderate earthquakes that would trigger this lower warning level (and thus would be the source of nuisance alerts when these earthquakes fail to grow into larger earthquakes) is low. Therefore, EEW systems may hold the greatest potential for users interested in low-amplitude ground motion thresholds and for those who are concerned with strong ground motion but who are willing to receive many unnecessary alerts in exchange for receiving timely warnings.
Finite rupture effects
To explore the effect of rupture finiteness, we perform the same timeliness analysis for an M8 vertical strike-slip earthquake that ruptures at a constant velocity of 3 km/s. However, given the limited seismogenic width of a continental strike-slip fault, we can no longer justify the assumption that the moment release rate is given by a circular crack. Instead, we use the more physical assumption that the rupture expands circularly until the fault width of 15 km is filled and then continues as a rectangular rupture proceeding unilaterally down the fault. We use the magnitude-log area (M-logA) scaling relationship of Hanks and Bakun (29) to convert this evolving rupture area to evolving moment release (Fig. 3C) and calculate the time to issue an alert as before. In the forward rupture direction, the time to issue an alert is reduced (relative to a point source) because, in each increment of time, the EEW system observes not only that incrementally more moment has been released but also that the rupture has propagated incrementally closer to the user’s location. Because GMPEs scale more strongly with distance than with magnitude, this evolving rupture extent rapidly increases the predicted ground motion intensity at the user’s location (relative to a point source), allowing alerts to be issued earlier (compare Figs. 4 and 5).
Fig. 5. Potential warning time for a finite rupture.

(A) We present a scenario finite rupture (shown by magenta line) that starts at the origin and propagates to the right at 3 km/s until it is an M8 earthquake. The top row shows the time to issue an alert, assuming that the EEW system has no latencies and gives each location an alert as soon as the rupture has propagated close enough or enough moment has been released such that the predicted ground motion at the location exceeds 2, 5, 10, and 20%g (left to right). White regions are areas that do not exceed threshold acceleration level. Middle row shows the time at which strong ground motion arrives at the user’s location, assuming that the strong shaking is carried by the indirect travel path shown in Fig. 2. Bottom row shows the warning time to each location—the difference between the ground motion arrival times in the second row and the time to issue an alert in the top row. Black regions indicate areas that receive negative warning time, that is, the alert arrives after the ground motion threshold has already been exceeded. Note that in the backward rupture direction (negative locations on the x axis), the alert, arrival, and warning times are identical to the point source results, except that the alert times have been slightly increased (and warning times correspondingly decreased) due to the change from a circular crack model to a rupture length scaling moment rate function (compare to Fig. 4 and fig. S2). (B) PDFs of potential warning time calculated from the warning times in the bottom row of (A). The two peaks of the PDF for the 2%g threshold correspond to the forward and backward rupture directions, with longer warning times possible in the forward rupture direction. The PDFs for the other ground motion thresholds are unimodal because strong ground motion is only observed near the earthquake rupture; thus, the size of the backward rupture direction region experiencing ground motion exceeding 5, 10, or 20%g is insignificant. (C) Percentage of locations that could potentially receive a given minimum warning time. These values are obtained by integrating the PDFs in (B). Again, long warning times are not possible for high levels of ground motion: Almost 90% of locations receive at least some warning for 2%g, and 17% of locations receive more than a minute of warning for accelerations exceeding 2%g, but no users are expected to receive more than 7 s of warning for acceleration exceeding 20%g, under a no-latency system.
We further assume that the arrival of strong ground motion is delayed in the forward rupture direction because the strong ground motion first propagates down the fault at a slower rupture velocity before finally propagating to the user at S-wave speed (Fig. 2). The elongated travel path and slower velocity act to significantly delay the arrival of strong ground motion, and can significantly increase warning times. Some areas may receive as much as a minute of warning for 2%g ground motion. However, strong ground motion predictions can only be made when it is known that the earthquake has large magnitude and/or that its rupture has already propagated close to the user’s location. Thus, similar to the point source case, long warning times for high ground motion thresholds are just not possible. Specifically, in this scenario, no locations receive >7-s warning for 20%g. Furthermore, note that the warning times for locations behind the rupture are identical to the point source case because there are no fault finiteness effects behind the rupture.
Northern San Andreas fault rupture scenario
As a specific example of the effects of fault finiteness, we consider the case of an earthquake on the San Andreas fault: It initiates off the northern California coast near the Mendocino triple junction, rupturing south toward the San Francisco Bay Area, eventually becoming a large M8 earthquake. This is the type of scenario that is typically used to illustrate the potential usefulness of EEW: a major earthquake that begins distantly and then ruptures close to a major population center, creating a long delay between rupture initiation and the arrival of strong ground motion in the populous region. The analysis here is the same as the generic finite fault example (Fig. 5), except that the coordinates are rotated onto the strike of the San Andreas, and we include site amplifications using the actual Vs30 at each location on a grid (see Materials and Methods for details). Snapshots of this scenario show the evolution of the expected ground motion at six cities in northern California (Oakland, San Francisco, San Jose, Santa Cruz, Santa Rosa, and Ukiah), assuming that the EEW system perfectly and instantaneously knows the evolving rupture extent and magnitude of the rupture (Fig. 6).
Fig. 6. Northern San Andreas fault rupture scenario.

An example of an M8 finite fault rupture starting far from a major city (off the coast of northern California) and propagating toward a populous region (the San Francisco Bay Area), generally considered the most favorable case for timely EEW. Each subplot shows the accumulated PGA at 4, 20, 38, 54, 67, and 96 s after initiation. Text boxes show the predicted PGA at select cities, given the magnitude and rupture extent observed at that point. Red boxes are locations for which a 10%g warning could be issued at the elapsed times shown. See text and fig. S10 for details of alert and warning times at each city.
Even under this idealized, latency-free EEW system and favorable rupture scenario (of an earthquake starting far from the major cities), warning times are short. Four seconds after rupture initiation, the earthquake is M6, and the only city expecting more than 2%g PGA is the nearby small northern California city of Ukiah. We have chosen a soft rock site in San Francisco that increases predicted ground motions significantly, allowing warnings to be issued faster than in the generic reference site scenario presented in Fig. 5. Nonetheless, at 20 s into the rupture, when the earthquake is M7, the expected PGA in San Francisco is only 2%g. A warning for 20%g could be issued for San Francisco ~67 s into the rupture, providing residents ~8 s of warning before the arrival of strong ground motion. If an alert threshold of 10, 5, or 2%g were chosen instead, then warning times to San Francisco would be 19, 33, or 48 s, respectively (fig. S10).
Thus, even in the most favorable case for our idealized, theoretical EEW system—a major city with strong local site amplification situated near a large earthquake whose rupture propagated unilaterally toward the city from a distant initiation point—long warning times for strong motion (for example, 20%g) are not possible. This perhaps contradicts initial intuition, in which one expects San Francisco to receive very long warning times: That notion would require previous knowledge that the earthquake will indeed propagate past San Francisco. In reality, this event is more likely to simply terminate as a more common, smaller event, rather than becoming a large M8 rupture, in which case we would not necessarily want to warn San Francisco of 20%g when the city is expected to experience <1%g.
DISCUSSION
Although the examples we present in this paper are specific to California earthquakes, the framework we present is general. Here, we have applied our framework to crustal earthquakes in California (with appropriate GMPEs for that region), assumed that the user would like to receive warnings for strong accelerations (as opposed to large ground velocities, displacements, or spectral accelerations at a particular frequency), and mostly used a default (bedrock) site condition. Different input information can be easily used in this framework to adjust the warning time results for a specific region, site, or user tolerance. For example, in the Seattle area of the Pacific Northwest, two distinct sources (deep crustal earthquakes and subduction interface events) with different associated GMPEs need to be considered, along with possibly significant basin amplification and resonance effects. Similarly, in Mexico City, long-period resonance and amplification effects associated with sedimentary basins can amplify ground motions from distant earthquakes and increase warning times for potentially damaging levels of ground motion. For a site-specific application, either the threshold value can be adjusted to account for the site amplification or diminution or the GMPE can be adjusted. For example, a user interested in receiving warnings for 10%g at a location with a factor of 2 site amplification can simply consider the results we computed for 5%g. Likewise, a location in a highly amplifying basin could consider that level of increased ground motion.
Similarly, there is nothing special about PGA (or the four thresholds we consider here) as the ground motion metric for EEW: PGV has long been recognized as a better indicator of structural damage than PGA. The warning time for ground motion exceeding various thresholds of PGA and PGV for different assumed moment rate functions is presented in fig. S2; the results are quite similar for different shaking intensity metrics. Again, our framework easily allows consideration of other ground motion periods, simply by changing the output GMPE. Although specific details would be expected to change, the main results hold regardless of the period: Warning for higher levels of ground motion means that you have to observe more of the earthquake to know that there will be large ensuing ground motion, and an alert can still only be issued when the earthquake is large or close.
Finally, our assumed source time function and the assumption that moment can be estimated twice as fast as it is actually released can be replaced by other physical source models and other assumptions about how quickly moment can be estimated. It should be noted that, for the point source analysis, we have chosen an exceptionally fast moment release rate (the Brune circular crack model) and then doubled that speediness to obtain an estimate for the fastest plausible EEW alerts. If a more physically realistic model of large strike-slip earthquakes were used, for example, M-logA scaling (Fig. 3C) (29), EEW timeliness would probably decrease. For M-logA scaling, even if it were assumed that the final earthquake magnitude could be estimated after just 25% of the rupture had occurred (that is, that moment could be estimated four times as fast as it was actually released), the time to issue an EEW alert for a large-magnitude earthquake would still be longer than what we have presented on the basis of doubling the speed of the Brune model.
We have considered only the case of a theoretical, optimally efficient source parameter–based EEW system that uses sensors near the earthquake rupture to detect an earthquake, estimate its location and magnitude in real time, and issue real-time ground motion early warnings to users. (In addition, in this idealized system, we have assumed that magnitude and location are determined instantaneously and without error, and are updated as the rupture propagates.) This type of source parameter–based EEW system using a network of sensors is how the JMA’s EEW system and the United States’s ShakeAlert EEW system operate (4, 30). We should note that there are several other possible early warning system designs. On-site source parameter EEW systems use seismometers placed at the user’s location to detect earthquakes, determine their location and magnitude, predict ground motion, and issue an alert based on the initial P wave (31). The performance of these systems should be identical to what we have presented in this paper, except that the P-wave source-receiver propagation time should be subtracted from the warning times we have calculated because the on-site system begins estimating magnitude and location at the same instant that seismic waves reach the location of interest. On-site approaches may have shorter detection, transmission, and processing delays and may therefore show better performance in terms of timeliness for near-epicentral sites (31, 32). However, because these systems cannot take advantage of the propagation delay between the source and the user’s location, the theoretical performance of these systems is expected to be poorer than network-based approaches (fig. S9).
There are also both network-based and on-site approaches that attempt to directly predict expected ground motion intensity without first estimating the location and magnitude of the earthquake (32, 33). The behavior of these systems may significantly differ from the source parameter–based warnings studied here because the time to issue an alert is not expected to be directly controlled by the moment release of the earthquake. These approaches may be better able to provide timely warnings for strong ground motion than source parameter–based EEW systems, but quantitative analysis of such systems has not yet been conducted and is beyond the scope of this work.
So far, we have only considered the timeliness of EEW warnings, assuming that the system is optimally fast and the calculated ground motion amplitudes are perfect. In reality, errors in the ground motion prediction will lead to mischaracterization of the expected ground motion relative to the user’s threshold. In general, GMPEs have an SD (1-σ) of about a factor of 2. For example, a smaller event could easily produce ground motions twice that predicted, or a large event could be enervated by a factor of 2. Both situations are regularly observed, and site-to-site variation in recorded ground motion is of the same order. We explore this topic in a companion investigation.
Last, we note that our study is completely independent of the spatial variability or rates of earthquakes and is location agnostic, except that we chose the example of a shallow crustal strike-slip earthquake with a maximum magnitude of 8, and also do not consider basin amplification. We have not posed this problem in any sort of earthquake-predictive sense. We are only modeling the expected warning times, given an observed evolving moment rate function. Incorporation of operational earthquake forecasting, an active aftershock sequence, or characteristic earthquakes (that is, not following the Gutenberg-Richter frequency-magnitude relation) could certainly be layered on top of, and independently from, our analysis. Our framework is consistent with typical EEW systems, in that EEW is not predicting certain characteristic events but only seeking to rapidly determine the current evolving earthquake.
CONCLUSIONS
We consider expected warning times for hypothetical EEW systems that use point source descriptions of the earthquake source to estimate ensuing ground motion, as well as those that recognize the finite extent of faulting. Fault finiteness improves EEW timeliness for users in the forward rupture direction because less time is required to issue an alert if the system identifies that the user’s distance to the rupture is decreasing as the rupture propagates, and thus, the minimum magnitude to issue an alert for a certain ground motion threshold decreases with time. In the backward rupture direction, the performance is the same as in the point source case. However, if we assume that EEW systems can only observe evolving rupture extent and not predict it, then the practical benefits of fault finiteness to the timeliness of warnings are limited: Although long warning times (>1 min) are possible for low ground motion thresholds (for example, 2%g) in certain locations, warning times for strong ground motion (for example, 20%g) are still short (<10 s). It is not possible to provide long warning times for damaging ground motion because strong ground motion only occurs near the rupture of a sufficiently large earthquake, where there is little wave propagation time between the earthquake source and the user location.
Although we have used very simple and idealized models in this study, these models show good correspondence with observed earthquake source behavior and ground motions (for example, the circular crack rupture model fits observed source time functions for M7 and larger earthquakes, and GMPEs are optimized to reproduce observed median ground motions). Thus, we hope that the results presented here can provide useful guidance for the range of warning times we might reasonably expect from operational EEW systems. Notably, EEW systems are capable of producing long warning times for low thresholds of ground motion, but timely warnings for damaging ground motion are rare even for long finite ruptures. The most reliable EEW performance (as measured by the percentage of time that a warning is timely) is for users who have low thresholds of ground motion for taking action and who require little time to act. Alternatively, we may say that long warning times are possible if a user chooses to take action based on an alert for a low level of ground motion, even when most of these earthquakes will not go on to produce strong ground motion at the user’s location.
Although it seems unlikely that the type of EEW system studied in this paper (one that infers the source parameters of an earthquake rupture and inputs that information into a GMPE to warn for expected ground motion) can be relied upon to provide timely warning to many users for strong ground motion, that does not mean that EEW is not useful. Other EEW approaches that use ground motion to directly predict ground motion may not have these same timeliness limitations (32, 33). Even given the timeliness limitations of source parameter–based EEW, false alert–tolerant users could still derive significant benefits from this type of system if they are willing to subscribe to alerts for a low threshold of ground motion and live with the resulting unnecessary alerts when most of these events do not go on to produce strong ground motion. This type of cost-benefit analysis for EEW should be developed in future studies.
MATERIALS AND METHODS
We used the GMPE of Chiou and Youngs (22) because it has a smooth dependence on magnitude—smoother than the other NGA-West2 GMPEs. Continuity of predicted ground motion amplitudes as a function of magnitude is important because we show many of the results as a continuous function of magnitude. Overall, the GMPE of Chiou and Youngs (22) is consistent with the other NGA-West2 GMPEs. The GMPE is run for a global (default) region. For the finite rupture example, depth (specifically, the depth to the top of the rupture) is taken as the median (default) from the model, based on the NGA-West2 database, that is, about 7 km for magnitudes less than 5 and decreasing smoothly to 0 at magnitude ~7.2. For the point source example, we ran the PGA GMPE for a rock site condition with Vs30 = 760 m/s, assuming that the site is not on a hanging wall and that there is no directivity, and took the basin depth term also to be the median (default) for the model. For fig. S2, we used the same conditions but output PGV from the GMPE. In the finite fault San Francisco Bay Area example (Fig. 6), we ran the GMPE for the Vs30 value at each grid point site, using the study of Allen and Wald (34) to determine Vs30 at each location.
The EEW reports for the 2008 Iwate-Miyagi Nairiku earthquake are included in the study of Doi (21); other reports are available from https://anetrt.net/anet/EEW-search/. The 2011 Tohoku earthquake rupture parameters are available in the supplementary materials of Minson et al. (35). The 2016 Kumamoto earthquake source model parameters from Kubo et al. (36) are available at www.kyoshin.bosai.go.jp/kyoshin/inversion/inversion_main_en.shtml. The 2008 Iwate-Miyagi Nairiku earthquake source rupture parameters from Asano and Iwata (37) are available from SRCMOD, http://equake-rc.info/SRCMOD/searchmodels/viewmodel/s2008IWATEx01ASAN/.
Supplementary Material
Acknowledgments
We thank N. Beeler, B. Brooks, M. Hoshiba, A. Thomas, and an anonymous reviewer for reviewing our initial manuscript and the ShakeAlert project group for discussions. Funding: M.-A.M. was funded by the Swiss National Science Foundation and the Gordon and Betty Moore Foundation. Author contributions: S.E.M. ran analysis. M.-A.M. contributed data. A.S.B. and T.C.H. provided GMPE analysis inputs. E.S.C. provided EEW expertise. Competing interests: The authors declare that they have no competing interests. Data and materials availability: All data needed to evaluate the conclusions in the paper are present in the paper and/or the Supplementary Materials, or are available from public sources specified therein. Additional data related to this paper may be requested from the authors.
SUPPLEMENTARY MATERIALS
Supplementary material for this article is available at http://advances.sciencemag.org/cgi/content/full/4/3/eaaq0504/DC1
fig. S1. Observed and theoretical evolution of moment release.
fig. S2. Comparison of alert and warning times for PGA and PGV.
fig. S3. Time evolution of predicted PGA for a point source and maximum warnable acceleration.
fig. S4. Expected shaking duration as a function of distance and magnitude.
fig. S5. Observed PDFs of time at which specified ground motion threshold is exceeded on the basis of inspection of 48,841 records of M ≥ 4 earthquakes.
fig. S6. Observed time of exceeding 2, 5, 10, and 20%g from 48,841 records binned by distance.
fig. S7. Empirical probability of time that ground motion threshold will be exceeded.
fig. S8. Threshold acceleration warning times for earthquakes of different magnitudes.
fig. S9. Percentage of events for which users will receive at least a minimum amount of warning time.
fig. S10. Time required to issue an alert and resulting warning time for the northern San Andreas fault rupture scenario.
data file S1. Description of the 48,841 seismograms used in this study.
movie S1. Evolution of observed and predicted PGA values for finite fault scenario presented in Fig. 5.
REFERENCES AND NOTES
- 1.Wu S., Beck J. L., Heaton T. H., ePAD: Earthquake probability-based automated decision-making framework for earthquake early warning. Comput. Aided Civ. Inf. 28, 737–752 (2013). [Google Scholar]
- 2.Espinosa-Aranda J. M., Cuellar A., Garcia A., Ibarrola G., Islas R., Maldonado S., Rodriguez F. H., Evolution of the Mexican Seismic Alert System (SASMEX). Seismol. Res. Lett. 80, 694–706 (2009). [Google Scholar]
- 3.Hoshiba M., Iwakiri K., Hayashimoto N., Shimoyama T., Hirano K., Yamada Y., Ishigaki Y., Kikuta H., Outline of the 2011 off the Pacific coast of Tohoku Earthquake (Mw 9.0): Earthquake early warning and observed seismic intensity. Earth Planets Space 63, 7 (2011). [Google Scholar]
- 4.Kohler M. D., Cochran E. S., Given D., Guiwits S., Neuhauser D., Henson I., Hartog R., Bodin P., Kress V., Thompson S., Felizardo C., Brody J., Bhadha R., Schwarz S., Earthquake early warning ShakeAlert system: West coast wide production prototype. Seismol. Res. Lett. 89, 99–107 (2017). [Google Scholar]
- 5.Fujinawa Y., Noda Y., Japan’s earthquake early warning system on 11 March 2011: Performance, shortcomings, and changes. Earthquake Spectra 29, S341–S368 (2013). [Google Scholar]
- 6.Heaton T. H., A model for a seismic computerized alert network. Science 228, 987–990 (1985). [DOI] [PubMed] [Google Scholar]
- 7.Meier M.-A., How “good” are real-time ground motion predictions from earthquake early warning systems. J. Geophys. Res. 122, 5561–5577 (2017). [Google Scholar]
- 8.Allen R. M., Probabilistic warning times for earthquake ground shaking in the San Francisco Bay Area. Seismol. Res. Lett. 77, 371–376 (2006). [Google Scholar]
- 9.Zollo A., Lancieri M., Nielsen S., Earthquake magnitude estimation from peak amplitudes of very early seismic signals on strong motion records. Geophys. Res. Lett. 33, L23312 (2006). [Google Scholar]
- 10.Kanamori H., Real-time seismology and earthquake damage mitigation. Annu. Rev. Earth Planet. Sci. 33, 195–214 (2005). [Google Scholar]
- 11.Rydelek P., Horiuchi S., Earth science: Is earthquake rupture deterministic? Nature 442, E5–E6 (2006). [DOI] [PubMed] [Google Scholar]
- 12.Rydelek P., Wu C., Horiuchi S., Comment on “Earthquake magnitude estimation from peak amplitudes of very early seismic signals on strong motion records” by Aldo Zollo, Maria Lancieri, Stefan Nielsen. Geophys. Res. Lett. 34, L20302 (2007). [Google Scholar]
- 13.Yamamoto S., Rydelek P., Horiuchi S., Wu C., Nakamura H., On the estimation of seismic intensity in earthquake early warning systems. Geophys. Res. Lett. 35, L07302 (2008). [Google Scholar]
- 14.Sato T., Kanamori H., Beginning of earthquakes modeled with the Griffith’s fracture criterion. Bull. Seismol. Soc. Am. 89, 80–93 (1999). [Google Scholar]
- 15.Mori J., Kanamori H., Initial rupture of earthquakes in the 1995 Ridgecrest, California sequence. Geophys. Res. Lett. 23, 2437–2440 (1996). [Google Scholar]
- 16.Ellsworth W. L., Beroza G. C., Observation of the seismic nucleation phase in the Ridgecrest, California, earthquake sequence. Geophys. Res. Lett. 25, 401–404 (1998). [Google Scholar]
- 17.Kilb D., Gomberg J., The initial subevent of the 1994 Northridge, California, earthquake: Is earthquake size predictable? J. Seismol. 3, 409–420 (1999). [Google Scholar]
- 18.Uchide T., Ide S., Scaling of earthquake rupture growth in the Parkfield area: Self-similar growth and suppression by the finite seismogenic layer. J. Geophys. Res. 115, B11302 (2010). [Google Scholar]
- 19.Meier M.-A., Ampuero J. P., Heaton T. H., The hidden simplicity of subduction megathrust earthquakes. Science 357, 1277–1281 (2017). [DOI] [PubMed] [Google Scholar]
- 20.Hoshiba M., Iwakiri K., Initial 30 seconds of the 2011 off the Pacific coast of Tohoku Earthquake (Mw 9.0): Amplitude and τc for magnitude estimation for earthquake early warning. Earth Planets Space 63, 8 (2011). [Google Scholar]
- 21.Doi K., The operation and performance of earthquake early warnings by the Japan Meteorological Agency. Soil. Dyn. Earthquake Eng. 31, 119–126 (2011). [Google Scholar]
- 22.Chiou B. S.-J., Youngs R. R., Update of the Chiou and Youngs NGA model for the average horizontal component of peak ground motion and response spectra. Earthquake Spectra 30, 1117–1153 (2014). [Google Scholar]
- 23.Ye L., Lay T., Kanamori H., Rivera L., Rupture characteristics of major and great (Mw ≥ 7) megathrust earthquakes from 1990 to 2015: 1. Source parameter scaling relationships. J. Geophys. Res. 121, 821–844 (2016). [Google Scholar]
- 24.Hanks T. C., Thatcher W., A graphical representation of seismic source parameters. J. Geophys. Res. 77, 4393–4405 (1972). [Google Scholar]
- 25.Brune J. N., Tectonic stress and the spectra of seismic shear waves. J. Geophys. Res. 75, 4997–5009 (1970). [Google Scholar]
- 26.Brune J. N., Correction [to “Tectonic stress and the spectra, of seismic shear waves from earthquakes”]. J. Geophys. Res. 76, 5002 (1971). [Google Scholar]
- 27.Baltay A. S., Hanks T. C., Understanding the magnitude dependence of PGA and PGV in NGA-West 2 data. Bull. Seismol. Soc. Am. 104, 2851–2865 (2014). [Google Scholar]
- 28.Allen R. M., EERI Reconnaissance Team , Quake warnings, seismic culture. Science 358, 1111 (2017). [DOI] [PubMed] [Google Scholar]
- 29.Hanks T. C., Bakun W. H., M–logA models and other curiosities. Bull. Seismol. Soc. Am. 104, 2604–2610 (2014). [Google Scholar]
- 30.Kamigaichi O., Saito M., Doi K., Matsumori T., Tsukada S., Takeda K., Shimoyama T., Nakamura K., Kiyomoto M., Watanabe Y., Earthquake early warning in Japan: Warning the general public and future prospects. Seismol. Res. Lett. 80, 717–726 (2009). [Google Scholar]
- 31.Satriano C., Wu Y.-M., Zollo A., Kanamori H., Earthquake early warning: Concepts, methods and physical grounds. Soil Dyn. Earthquake Eng. 31, 106–118 (2011). [Google Scholar]
- 32.Hsu T.-Y., Wang H.-H., Lin P.-Y., Lin C.-M., Kuo C.-H., Wen K.-L., Performance of the NCREE’s on-site warning system during the 5 February 2016 Mw 6.53 Meinong earthquake. Geophys. Res. Lett. 43, 8954–8959 (2016). [Google Scholar]
- 33.Hoshiba M., Aoki S., Numerical shake prediction for earthquake early warning: Data assimilation, real-time shake mapping, and simulation of wave propagation. Bull. Seismol. Soc. Am. 105, 1324–1338 (2015). [Google Scholar]
- 34.Allen T. I., Wald D. J., On the use of high-resolution topographic data as a proxy for seismic site conditions (VS30). Bull. Seismol. Soc. Am. 99, 935–943 (2009). [Google Scholar]
- 35.Minson S. E., Simons M., Beck J. L., Ortega F., Jiang J., Owen S. E., Moore A. W., Inbal A., Sladen A., Bayesian inversion for finite fault earthquake source models—II: The 2011 great Tohoku-oki, Japan earthquake. Geophys. J. Int. 198, 922–940 (2014). [Google Scholar]
- 36.Kubo H., Suzuki W., Aoi S., Sekiguchi H., Source rupture processes of the 2016 Kumamoto, Japan, earthquakes estimated from strong-motion waveforms. Earth Planets Space 68, 161 (2016). [Google Scholar]
- 37.Asano K., Iwata T., Characterization of stress drops on asperities estimated from the heterogeneous kinematic slip model for strong motion prediction for inland crustal earthquakes in Japan. Pure Appl. Geophys. 168, 105–116 (2011). [Google Scholar]
- 38.M. Hoshiba, T. Ozaki, Earthquake early warning and tsunami warning of the Japan Meteorological Agency, and their performance in the 2011 off the Pacific Coast of Tohoku Earthquake (Mw 9.0), in Early Warning for Geological Disasters: Scientific Methods and Current Practice, F. Wenzel, J. Zschau, Eds. (Springer Berlin Heidelberg, 2014), pp. 1–28. [Google Scholar]
- 39.Allmann B. P., Shearer P. M., Global variations of stress drop for moderate to large earthquakes. J. Geophys. Res. 114, B01310 (2009). [Google Scholar]
- 40.Boore D. M., Thompson E. M., Path durations for use in the stochastic-method simulation of ground motions. Bull. Seismol. Soc. Am. 104, 2541–2552 (2014). [Google Scholar]
Associated Data
This section collects any data citations, data availability statements, or supplementary materials included in this article.
Supplementary Materials
Supplementary material for this article is available at http://advances.sciencemag.org/cgi/content/full/4/3/eaaq0504/DC1
fig. S1. Observed and theoretical evolution of moment release.
fig. S2. Comparison of alert and warning times for PGA and PGV.
fig. S3. Time evolution of predicted PGA for a point source and maximum warnable acceleration.
fig. S4. Expected shaking duration as a function of distance and magnitude.
fig. S5. Observed PDFs of time at which specified ground motion threshold is exceeded on the basis of inspection of 48,841 records of M ≥ 4 earthquakes.
fig. S6. Observed time of exceeding 2, 5, 10, and 20%g from 48,841 records binned by distance.
fig. S7. Empirical probability of time that ground motion threshold will be exceeded.
fig. S8. Threshold acceleration warning times for earthquakes of different magnitudes.
fig. S9. Percentage of events for which users will receive at least a minimum amount of warning time.
fig. S10. Time required to issue an alert and resulting warning time for the northern San Andreas fault rupture scenario.
data file S1. Description of the 48,841 seismograms used in this study.
movie S1. Evolution of observed and predicted PGA values for finite fault scenario presented in Fig. 5.