

Abstract
Objectives
This preclinical study was designed to compare gadolinium (Gd) brain uptake after repeated injections of a macrocyclic Gd-based contrast agent (GBCA) (gadoterate meglumine) or 2 linear GBCAs (L-GBCAs) (gadobenate dimeglumine or gadodiamide) on a translational model of moderate renal impairment in rats.
Methods
The study was carried out in subtotally nephrectomized rats. Animals received 4 intravenous injections per week of GBCA (gadoterate meglumine, gadobenate dimeglumine, or gadodiamide) for 5 weeks, resulting in a cumulative dose of 12 mmol/kg, followed by a 1-month injection-free period. T1 hyperintensity in the deep cerebellar nuclei (DCNs) was investigated, and brain structures were carefully dissected to determine elemental Gd, iron (Fe), copper (Cu), and zinc (Zn) distribution by mass spectrometry. Urinary excretion of endogenous metals was also investigated soon after GBCA administration and several days later in order to assess a potential transmetalation phenomenon.
Results
Unlike gadoterate, repeated injections of L-GBCAs gadobenate and gadodiamide both induced T1 hyperintensity in the DCNs. Fine dissection of cerebral and cerebellar structures demonstrated very low levels or absence of Gd after repeated injections of gadoterate, in contrast to the two L-GBCAs, for which the highest total Gd concentration was demonstrated in the DCNs (Gd concentration in DCNs after 4.5 weeks of injection-free period: 27.1 ± 6.5 nmol/g for gadodiamide [P < 0.01 vs saline and P < 0.05 vs gadoterate]; 12.0 ± 2.6 nmol/g for gadobenate [P < 0.09 vs saline]; compared with 1.4 ± 0.2 nmol/g for gadoterate [ns vs saline]). The distribution of Gd concentration among the various brain structures dissected was also well correlated with the Fe distribution in these structures. No difference in endogenous metal levels in brain structures was observed. However, injection of gadobenate or gadodiamide resulted in an increase in urinary Zn excretion (urinary Zn concentrations: 57.9 ± 20.5 nmol/mL with gadobenate [P < 0.01 vs gadoterate and saline] and 221.6 ± 83.3 nmol/L with gadodiamide [P < 0.0001 vs all other treatments] vs 8.1 ± 2.3 nmol/L with saline and 10.6 ± 4.8 nmol/L with gadoterate]).
Conclusions
In a model of renally impaired rats, only traces of gadoterate meglumine were detected in the brain with no T1 hyperintensity of the DCNs, whereas marked Gd retention was observed in almost all brain areas after injections of the L-GBCAs, gadobenate dimeglumine and gadodiamide. Brain structures with higher Gd uptake corresponded to those structures containing more Fe. Urinary Zn excretion was significantly increased after a single injection of L-GBCAs.
Key Words: cerebellum, endogenous metals, gadobenate dimeglumine, gadodiamide, gadolinium uptake, gadoterate meglumine, magnetic resonance imaging, renal impairment
The recent findings of gadolinium (Gd) accumulation in the brain following repeated injections of Gd-based contrast agents (GBCAs) have raised considerable interest in the scientific community, and this accumulation could potentially represent a major concern for patients. Health authorities, especially the US Food and Drug Administration and the European Medicines Agency, have urged marketing authorization holders to elucidate this phenomenon, which may require reevaluation of the safety of GBCAs in everyday use.
It is generally accepted that Gd accumulation in tissues is much higher with linear GBCAs (L-GBCAs) than macrocyclic agents and is inversely proportional to their thermodynamic conditional stability constant log Kcond, calculated for pH 7.4 and kinetic stabilities for L-GBCAs and driven by the high kinetic stabilities (ie, very low dissociation kinetics) of macrocyclic GBCAs (M-GBCAs),1 as demonstrated in nonclinical models2,3 and in humans.4–10 Gadolinium accumulation in the central nervous system depends on the cumulative dose,7 with heterogeneous cerebral Gd distribution.11,12
The detection of at-risk populations is of critical clinical importance, and recent clinical studies have focused on potentially sensitized populations such as pediatric patients,13–15 newborns after potential exposure by injection to the mother during pregnancy,16–18 or renally impaired subjects.19,20
Almost all preclinical studies are performed in rodent species, which constitute a relevant translational model,21,22 reproducing the T1 effect and Gd accumulation in the deep cerebellar nuclei (DCNs).
A previous study demonstrated that moderate renal impairment induced by subtotal nephrectomy constituted a sensitive model to study brain Gd uptake in the rat. Indeed, it amplified the brain Gd retention and T1 hyperintensity for an identical injected dose of gadodiamide compared with animals with normal renal function.23 Gadolinium uptake was positively correlated with the severity of renal impairment.24 We therefore decided to compare the behavior of different molecular categories of GBCAs in this same model.
This model seems to be translationally and clinically relevant, as the estimated prevalence of chronic kidney disease (CKD) in patients 70 years or older in the United States (estimated with the CKD-EPI equation) is 46.8%,24 and the vast majority of these patients present stage 3 CKD, that is, moderate renal failure (glomerular filtration rate between 30 and 59 mL/min per 1.73 m2).24,25
Older people represent a population of major concern, in which contrast-enhanced magnetic resonance imaging (MRI) examinations are commonly performed. This population of patients may be repeatedly exposed to linear Gd chelates, which are not contraindicated for patients with stage 3 CKD.26,27
The purpose of this study was therefore to compare all categories of GBCAs, that is, a linear ionic GBCA (gadobenate), a linear nonionic GBCA (gadodiamide), and an M-GBCA (gadoterate), in a rat model of moderate renal failure mimicking a substantial population of patients exposed to GBCAs.
MATERIALS AND METHODS
All experimental procedures and animal care were carried out according to French regulations and in compliance with European Directive 2010/63/EU on the protection of animals used for scientific purposes. All experiments (administrations, imaging, image analyses, and total Gd concentration measurements) were carried out blindly.
Animal Model and Administration Protocol
The study was carried out on 5/6th subtotally nephrectomized female Sprague-Dawley rats (SPF/OFA rats; Charles River, L'Arbresle, France) aged 10 weeks and weighing 246 ± 15 g at the beginning of the study. Subtotal nephrectomy was performed at Charles River Laboratories: a first surgical procedure was performed when the rats were 6 weeks old to excise 1 kidney, and a second procedure was performed 1 week later to remove the 2 poles of the remaining kidney. After 2 weeks of recovery and acclimatization, the animals were randomized (n = 10/group, except for the saline group, which included 9 rats). The rats were housed 2 per cage, at an ambient temperature of 22°C ± 2°C, hygrometry of 45% ± 10%, in a room with 12:12-hour light-dark cycles. Rats had access to water and food ad libitum.
The animals received 20 injections of 0.6 mmol Gd/kg per injection (1.2 mL/kg) of meglumine gadoterate (macrocyclic ionic GBCA, Dotarem 500 mmol Gd/L [Guerbet, France], batches 14GD107A and 16GD091A), dimeglumine gadobenate (linear ionic GBCA, MultiHance 500 mmol Gd/L [Bracco, Italy], batch SP6251H), or gadodiamide (linear nonionic GBCA, Omniscan 500 mmol Gd/L [GE Healthcare, Chalfont St Giles, United Kingdom], batch 12965458), and the control group received 0.9% saline solution (CDM Lavoisier, Paris, France) (1.2 mL/kg). Intravenous injections were performed in the tail once a day, 4 days a week for 5 weeks, under isoflurane anesthesia (IsoFlo; Axience, Pantin, France). The 0.6-mmol Gd/kg dose corresponds to the clinical dose (0.1 mmol Gd/kg) adjusted to the body surface area of the rat according to the US Food and Drug Administration guidelines.28 A 4.5-week injection-free period was observed after the last injection. The study protocol is shown in Figure 1.
FIGURE 1.
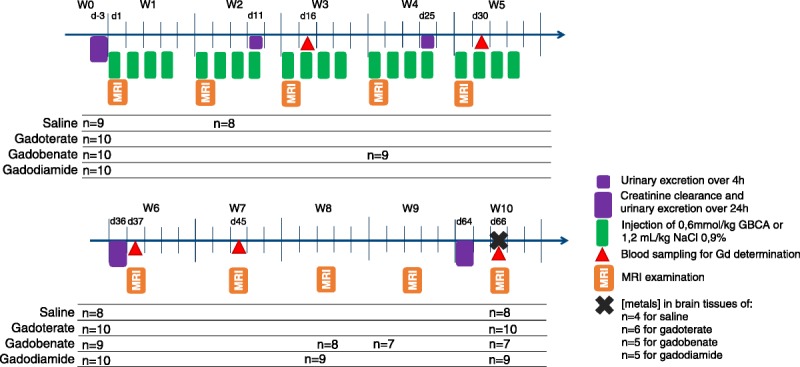
Study protocol. Subtotally nephrectomized rats received 20 injections of 0.6 mmol/kg over 5 weeks (cumulative dose of 12 mmol Gd/kg).
Creatinine Clearance
Endogenous creatinine clearance (CrCl) was determined from plasma and 24-hour urine collected at the beginning (ie, the week before the first administration) of the study, after the administration period (the week after the last administration), and at completion of the study (ie, 4 weeks after the last administration). Plasma and urine creatinine concentrations were assayed by an enzymatic technique on an Abbott Architect ci8200 automated analyzer (Abbott, Rungis, France).
Magnetic Resonance Imaging Protocol
Magnetic resonance imaging procedures were performed once a week, using a dedicated phased-array quadrature head coil in a gradient/shims insert B-GA 12S HP (660 mT/m intensity and 4570 T/m/s maximum slew rate) on a 4.7 T preclinical magnet (Biospec 47/40; Bruker, Ettlingen, Germany). The first MRI was performed before the first injection, and subsequent MRI examinations were performed once a week (just before the first injection of the week, ie, 72 hours after the last injection of the previous week). An MRI examination consisted of a T1-weighted 2-dimensional FLASH (fast low-angle shot) sequence (repetition time/echo time, 50/1.78 milliseconds; 48 averages; in-plane resolution, 164 × 164 μm2; slice thickness, 700 μm; acquisition time 6 minutes 36 seconds), targeted exclusively on the cerebellum (11 slices), and T1 mapping on the slice displaying the DCNs, using a FAIR (flow-sensitive alternating inversion recovery)–RARE (rapid acquisition with relaxation enhancement) sequence with 8 inversion times (0, 100, 200, 400, 600, 800, 1200, 2000 milliseconds; repetition time/effective echo time, 36.9/2079.9 milliseconds; 4 averages; in-plane resolution 164 × 164 μm2; slice thickness, 700 μm; and acquisition time, 11 minutes 5 seconds).
Blood and Tissue Collection
On days 16, 30 (before the daily injection), 37, and 45 (before the weekly MRI examination), rats were anesthetized with isoflurane, and a 600-μL sublingual blood sample was drawn. Plasma was harvested after centrifugation and frozen at −20°C for subsequent determination of Gd concentrations. At completion of the study, on week 10 (day 66), the animals were anesthetized with 5% isoflurane in oxygen. Sublingual venous blood was collected in heparinized tubes, and the rats were subsequently killed by exsanguination via the abdominal aorta. Venous plasma was collected after centrifugation and frozen at −20°C. For 4 to 6 rats per group (Fig. 1) (the other rats were used for other experiments), the forebrain was carefully harvested, and the following structures: cortical forebrain, amygdala, olfactory bulbs, midbrain, hippocampus, hypothalamus, thalamus, and striatum, were dissected.29,30 The frozen cerebellum was sliced using a Brain Slicer Matrix (Stoelting Co, Wood Dale, Ill), and the DCNs, cerebellum except the DCNs (called “cerebellum*”), and brain stem were carefully dissected. The DCNs was clearly distinguishable on 1-mm slices of fresh tissue as shown in Figure 2. Tissues were then frozen at −20°C for determination of total Gd concentrations.
FIGURE 2.
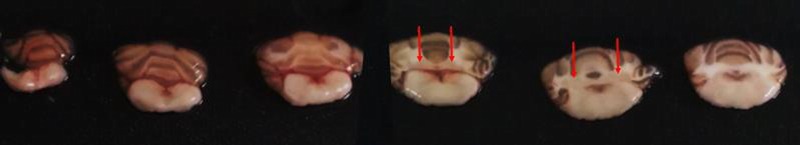
Fresh cerebellar slices of 1 mm, starting (left) from the caudal extremity, obtained with the Brain Slicer Matrix. Coronal plane. Deep cerebellar nuclei (red arrows) appear in light pink, surrounded by white matter.
Image Analysis
All image analyses were performed under blinded (for both test groups and all time points) and randomized conditions. Both qualitative and quantitative evaluations of the DCN T1 signal intensity were performed.
Qualitative Analysis of MRI Scans
Qualitative evaluation of T1 signal enhancement in the DCNs was performed under blinded conditions for the rat, group, and time point. A 3-point scoring scale for the DCNs relative to adjacent areas was applied: a score of 0 was attributed for no enhancement in the DCNs, 1 for doubtful enhancement, and 2 for definite enhancement.
Quantitative Analysis of MRI Scans
Blinded quantitative analysis of signal intensity on randomized images was performed by positioning regions of interest in the various cerebellar structures: cerebellar parenchyma, brain stem, and left and right DCNs. Signal intensity was calculated as the ratio of the DCNs with the highest signal to the brain stem signal (DCNmax-to-brain stem ratio).
R1 Mapping and Determination
R1 mapping was calculated from the FAIR-RARE acquisition on a pixel-by-pixel basis using in-house software written in MATLAB (The Mathworks Inc, Natick, Mass). The same regions of interest as those used for the FLASH sequence were positioned, and the R1 value was extracted.
Determination of Tissue Total Gd, Iron, Copper, and Zinc Concentrations
Total Gd concentrations in the various tissues collected were determined by inductively coupled plasma mass spectrometry (ICP-MS) (7700x; Agilent Technologies, Santa Clara, Calif) after sample mineralization in 65% nitric acid for 8 hours at a temperature of 80°C. The lower limits of quantification (LLOQs) of Gd were 0.02 nmol/mL in plasma, 0.14 nmol/g in DCNs, 0.03 nmol/g in hypothalamus, and 0.02 nmol/g in other brain matrices. The LLOQs in urine were 0.07 nmol/mL for Gd, 8 nmol/mL for iron (Fe), and 7 nmol/mL for copper (Cu) and zinc (Zn).
For calculation of means, SDs, and for statistical tests, values less than the LLOQ were arbitrarily replaced by LLOQ, and values less than the limit of detection were arbitrarily replaced by 0.
Urinary Excretion of Gd and Endogenous Metals
In addition to the 24-hour urine collection performed for determination of CrCl (before any injection [day 3], 4 days [day 36], and 1 month [day 64] after the last injection), rats were also placed in a metabolism cage for 4 hours, starting 1 hour after the daily GBCA injection, at weeks 2 and 4 (days 11 and 25), in order to determine the urinary excretion of endogenous metals (Fe, Zn, Cu) and total Gd following a GBCA injection.
Statistical Analysis
Values are shown as individual data, or mean ± SD. Dixon exclusion test was used to exclude aberrant values at a 5% risk. Normality was verified by the Shapiro-Wilk test.31 A 2-way analysis of variance with repeated measures was performed for CrCl and plasma Gd concentrations. When 1 or several parameters (time or group) were significant, Tukey post hoc tests were applied to compare values for these parameters. Two-way analysis of variance and Tukey post hoc tests were also applied for quantification of T1 signal enhancement in DCNs, R1 mapping, and urinary excretion of metals. Kruskal-Wallis test and Dunn post hoc test, when required, were used for simple comparison of total Gd concentrations in the various brain tissues between groups. Pearson correlation coefficient was calculated for correlations between metals. Graphs present the values for all rats, but repeated-measure statistics were performed only on values from rats that completed the study. A significance level of 5% was adopted.
RESULTS
During the second MRI examination, 1 rat in the saline group died of anesthesia, and 3 rats in the gadobenate group and 1 rat in the gadodiamide group died during the study (2 rats in the gadobenate group lost between 17% and 19% of body weight and were killed for ethical reasons on days 21 and 52; the others were found dead, 1 in the gadodiamide group on day 51 with a body weight loss of 23% and 1 in the gadobenate group on day 57 with a body weight loss of 12%). Consequently, on completion of the study, the numbers of rats per group were 10 for gadoterate, 9 for gadodiamide, 8 for saline, and 7 for gadobenate.
Creatinine Clearance
Subtotal nephrectomy resulted in moderate renal impairment (CrCl of tested rats was 0.21 ± 0.05 mL/min per 100 g prior to administration of the test compounds). A transient improvement in renal function was observed after the injection period (CrCl of 0.31 ± 0.09 mL/min per 100 g), independently of the group (P < 0.0001 for all groups). After the injection-free period, CrCl decreased (P < 0.0001 for all groups vs postinjection), reaching an intermediate value (CrCl of 0.25 ± 0.05 mL/min per 100 g) between the first 2 CrCl measurements. The rats in the gadobenate and gadodiamide groups that died during the study had severely impaired renal function: 0.09, 0.10, and 0.14 mL/min per 100 g for the rats in the gadobenate group and 0.13 mL/min per 100 g for the rat in the gadodiamide group at the last CrCl estimation.
Qualitative Evaluation of T1 Enhancement of DCNs on T1-Weighted MRI Examinations
Typical images at week 10 are shown in Figure 3A. A progressive and lasting increase in T1 enhancement of the DCNs compared with surrounding areas was found in both the gadobenate and gadodiamide groups from week 4, whereas no T1 enhancement was observed with gadoterate or for the control group (score <0.5). The T1 enhancement effect was higher in the gadodiamide group than in the gadobenate group (Fig. 3B).
FIGURE 3.
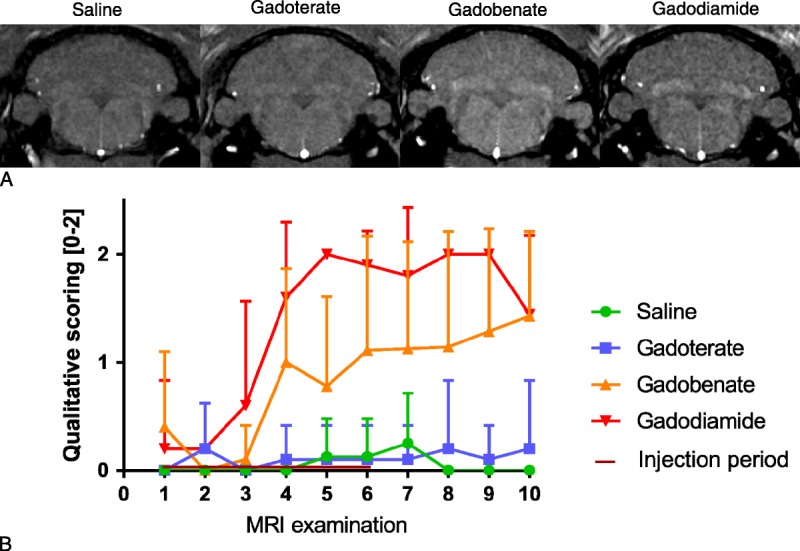
A, Typical T1-weighted MR images (4.7 T) of all treated groups, at study completion (week 10). B, Qualitative scoring of T1 enhancement in DCNs on weekly T1-weighted sequences (blinded). The DCN scores were attributed as follows: 0 = no T1 enhancement, 1 = doubtful T1 enhancement, 2 = definite T1 enhancement. All values are expressed as mean + SD.
Quantitative Evaluation of T1 Enhancement in the DCNs
Quantitatively, significant T1 enhancement was confirmed in the gadodiamide group, from the third week of injections (P < 0.05) until the end of the injection-free period (P < 0.01 vs the control group), compared with the saline and gadoterate groups. The T1 enhancement in the gadobenate group seemed to be intermediate (on completion of the injection-free period, P = 0.074 compared with saline) (Fig. 4).
FIGURE 4.
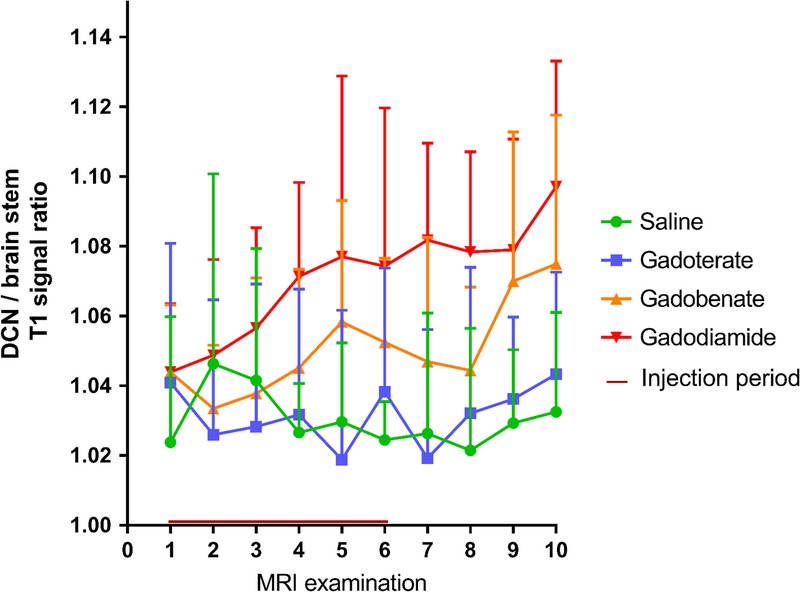
Quantitative follow-up of T1 enhancement in the DCNs on weekly T1-weighted sequences. T1 enhancement is described by the DCN–to–brain stem ratio of T1 signal intensity. First MRI after the injection period is MRI 6. Gadodiamide versus saline and gadodiamide versus gadoterate: P < 0.05 from the fourth MRI examination. All values are expressed as mean + SD.
R1 Mapping
A trend toward an increase in R1 relaxation rate was observed after injections for gadobenate (P = 0.107 vs the control group), and a significant increase in R1 relaxation rate was observed for gadodiamide (P < 0.0001) compared with the control and gadoterate groups, whereas the R1 relaxation rate in DCNs in the gadoterate group remained similar to that of the saline group, regardless of the time point. R1 enhancement was maintained after the injection-free period in the gadodiamide group (P < 0.01 vs saline, P < 0.001 vs gadoterate) (Fig. 5).
FIGURE 5.
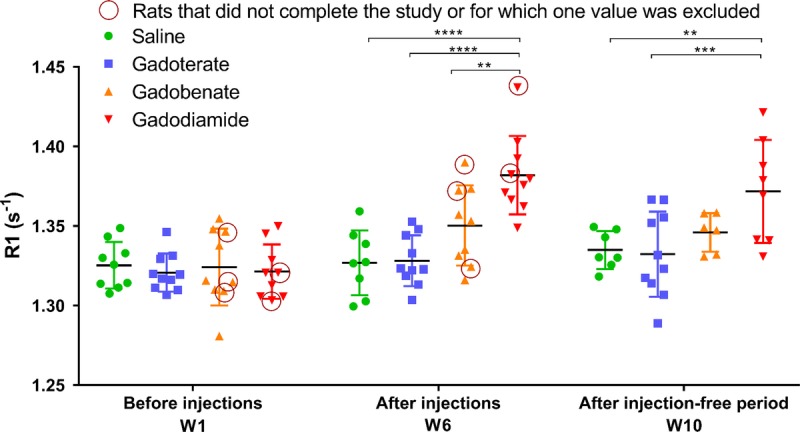
Relaxation rate R1 (s−1) determined in the DCNs from T1 mapping sequences performed at the beginning of the study, after 5 weeks of injections, and at completion of the study (4 weeks after the last injection). Circles: values for rats that did not complete the study. Individual values are given, as well as mean ± SD. According to the Dixon exclusion test at a 5% risk, 1 value in gadobenate and gadodiamide groups at week 1 was excluded, as well as 1 value in saline, gadobenate, and gadodiamide groups at week 10.
Total Gd Concentrations Determined by ICP-MS in the Dissected Brain Areas
The highest total Gd concentrations were observed with gadodiamide in the DCNs, olfactory bulbs, striatum, thalamus, and cerebellar parenchyma (Fig. 6).
FIGURE 6.
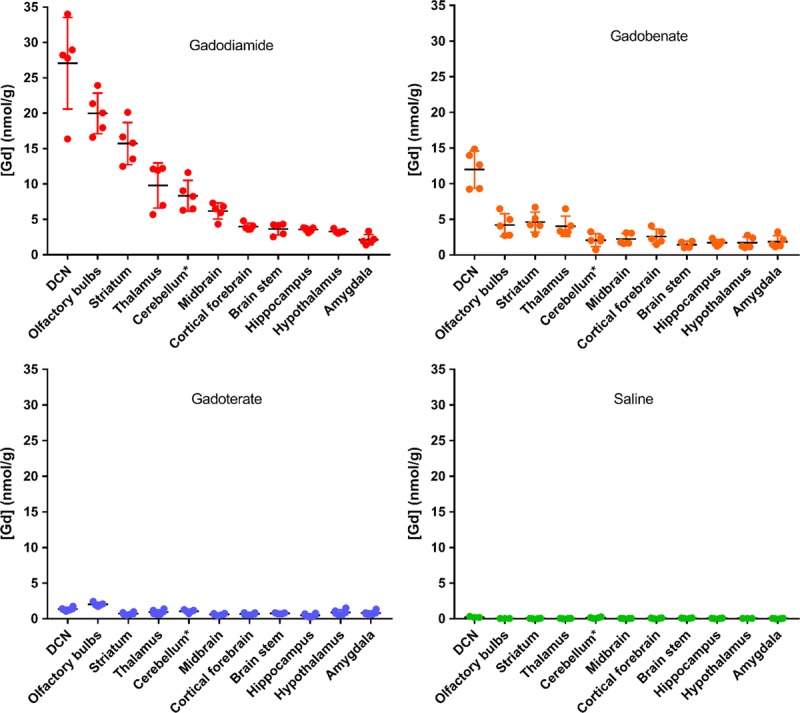
Total Gd concentrations determined by ICP-MS in the various dissected brain areas (cerebellum*: except for DCNs) 4½ weeks after the last injection (20 * 0.6 mmol Gd/kg body weight). Individual values are given, as well as mean ± SD.
Some of the dissected brain areas presented a high total Gd concentration ratio for gadodiamide versus gadoterate (>7) and for gadodiamide versus gadobenate (>3.5), whereas this ratio was close to 2 for the other structures. Statistical analyses comparing the test groups for the structures more prone to store Gd are shown in Figure 7.
FIGURE 7.
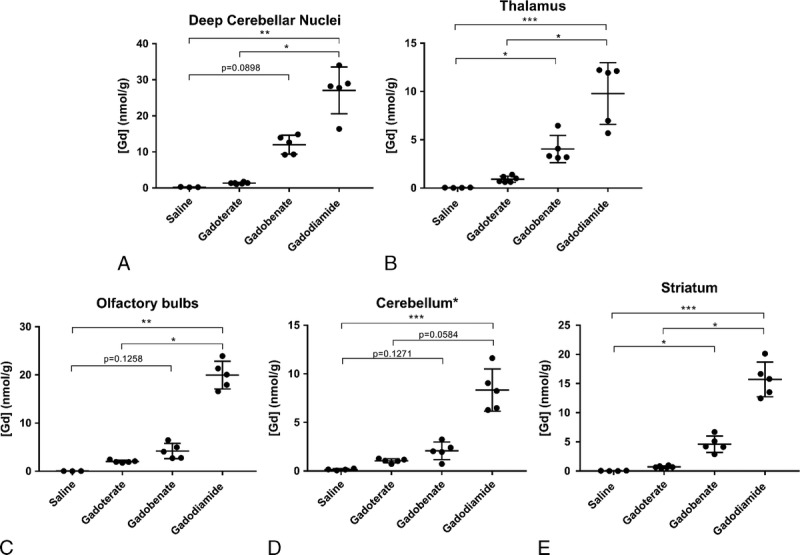
Total Gd concentration in the main brain structures that accumulate Gd (cerebellum*: all parenchyma except for the DCNs). Individual values are given, as well as mean ± SD. According to the Dixon exclusion test at a 5% risk, 1 saline-treated rat was excluded for DCNs, 1 saline and 1 gadoterate-treated rats for olfactory bulbs, and 1 gadoterate-treated rat for the cerebellum* (*P < 0.05; **P < 0.01; ***P < 0.001).
No significant difference in terms of endogenous metal concentrations was observed between the test groups (data not shown). However, a good correlation was observed between tissue total Gd and total Fe concentrations for the gadodiamide and gadobenate groups: higher Fe concentrations in brain structures were correlated with higher total Gd concentrations (Fig. 8, A and B). No correlation was observed between Fe and total Gd concentrations in the gadoterate group (Fig. 8C). Furthermore, total Gd concentration did not correlate with tissue copper or Zn concentrations (Cu-Gd correlation: r = 0.6, r = 0.35, r = 0.53; and Zn-Gd correlation: r = 0.15, r = 0.41, and r = −0.23, for gadodiamide, gadobenate, and gadoterate, respectively).
FIGURE 8.
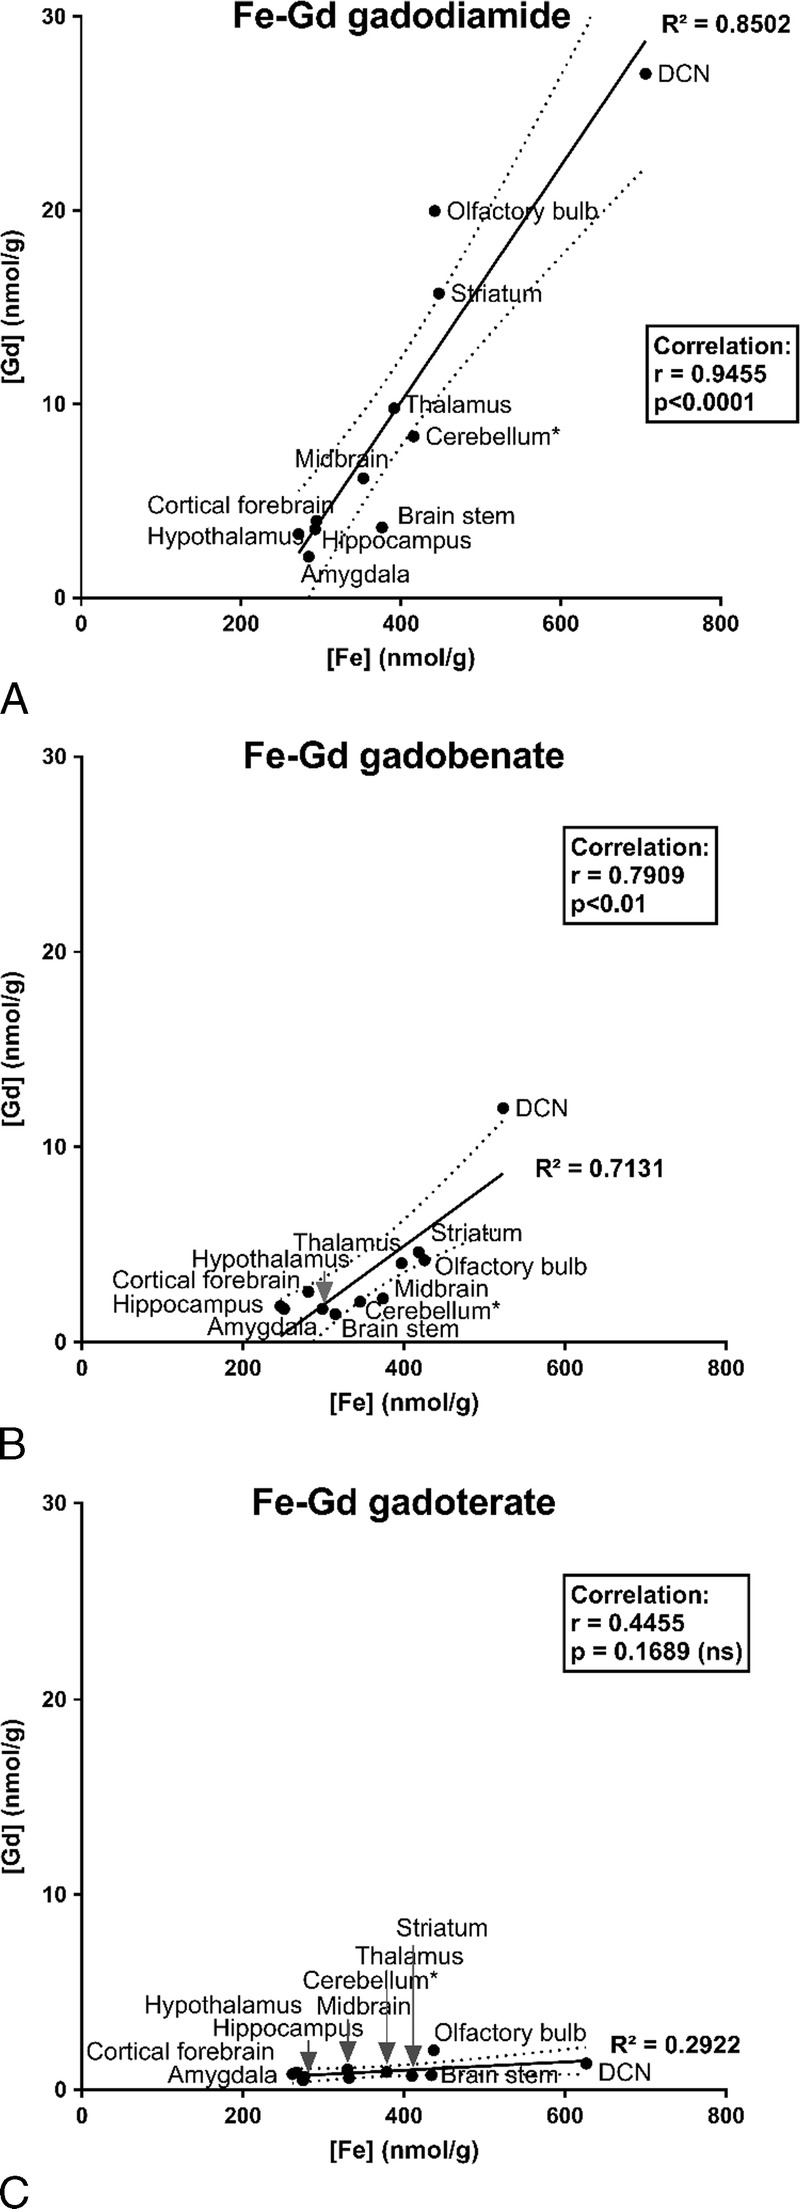
Correlations between mean brain tissue total Gd and Fe concentrations measured in brain areas for the various GBCAs (cerebellum*: all cerebellar parenchyma except for the DCNs). A, Tissue Fe versus total Gd concentrations in gadodiamide-treated rats. B, Tissue Fe versus total Gd concentrations in gadobenate-treated rats. C, Tissue Fe versus total Gd concentrations in gadoterate-treated rats.
Plasma Total Gd Concentrations
After the injection period, plasma total Gd concentrations progressively decreased, but still remained above the lower limit of quantification on day 66, that is, 1 month after the last injection. Overall, plasma Gd curves were similar between gadoterate and gadodiamide. However, plasma total Gd concentrations in the gadobenate group were significantly lower (P < 0.01 until day 30 compared with gadodiamide and P < 0.05 until day 37 compared with gadoterate) (Fig. 9).
FIGURE 9.
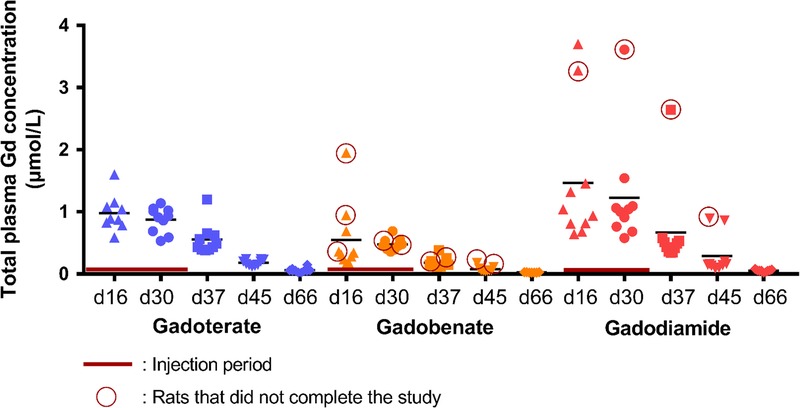
Time course of plasma total Gd concentration over the entire study. During the injection period (days 16 and 30), plasma was collected just before the second injection of the week (24 hours after the 9th injection and 24 hours after the 17th injection).
Urinary Excretion of Gd and Endogenous Metals
Immediately after injection of GBCAs at days 11 and 25 (Fig. 1), the urinary excretion of Gd was significantly increased (P < 0.0001 for all vs saline) (Fig. 10). However, the Gd excretion was reduced by a factor of 3 to 4 in the case of gadobenate compared with the other GBCA-treated groups (P < 0.0001). A nonsignificant increase in endogenous urinary Fe excretion was observed on day 25 in the gadodiamide group compared with the other 3 groups, whereas no difference in endogenous urinary copper excretion was observed between the groups (group effect: P = 0.66) (Fig. 10).
FIGURE 10.
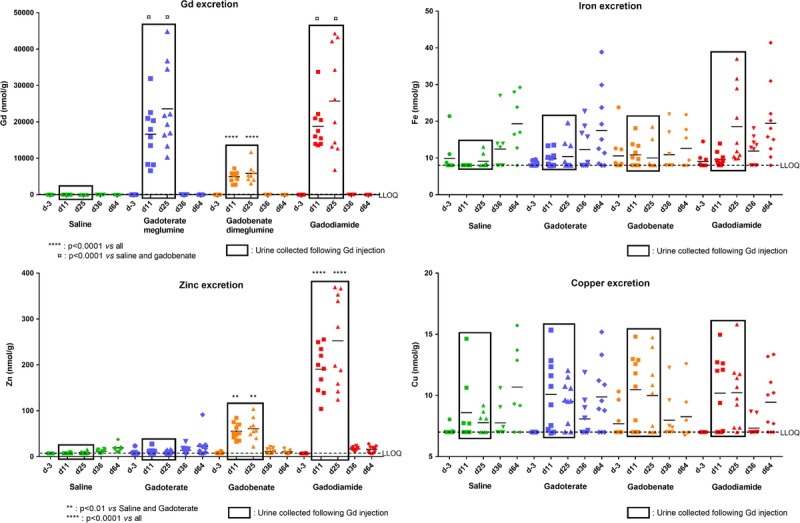
Urinary excretion of endogenous Zn, Fe, and Cu (measured by ICP-MS) at various time points (day −3: before injection period; day 36: after the injection period; day 64: after injection-free period), and 1 to 5 hours after injection of GBCAs (at day 11 and day 25). Individual values are given, as well as mean.
At both days 11 and 25, a substantial increase in endogenous urinary Zn excretion was observed after injection of gadobenate (7-fold increase, P < 0.01 vs saline and gadoterate), and an even greater increase was observed after injection of gadodiamide (27-fold increase, P < 0.0001 vs other groups), whereas urinary Zn excretion after gadoterate was increased only 1.3-fold compared with saline (not statistically significant).
DISCUSSION
Moderate renal impairment has been shown to represent a translational model of potentiation of brain Gd uptake, which is proportional to baseline renal function.23 Baseline CrCl measured at the beginning of the study was 0.21 ± 0.05 mL/min per 100 g, comparable to the value reported by Rasschaert et al23 (0.19 ± 0.06 mL/min per 100 g), corresponding to stage 3 CKD. The use of a nonclinical model of moderate renal impairment would seem to be clinically relevant, because stage 3 CKD is very common in the elderly population, more prone to undergo MRI examinations.24,25
Three rats treated with gadobenate and 1 rat treated with gadodiamide that were killed for ethical reasons or that were found dead presented the lowest CrCl values in their respective groups (CrCl values between 0.09 and 0.15 mL/min per 100 g), suggesting that poor baseline renal function compromises the safety of these L-GBCAs.
Qualitative and Quantitative Assessment of T1 Enhancement in the DCNs
T1 signal enhancement in the DCNs was monitored weekly by T1-weighted MRI sequences on a 4.7 T nonclinical magnet. T1 signal intensity in the DCNs was quantified with respect to brain stem signal intensity, as classically assessed in both clinical and nonclinical studies, although this area also accumulates Gd (total Gd concentrations of 1.4 ± 0.5 nmol/g for gadobenate, 3.6 ± 0.8 nmol/g for gadodiamide, and 0.7 ± 0.09 nmol/g for gadoterate) and may consequently underestimate T1 signal enhancement in the DCNs. Images were scored qualitatively under blinded conditions. Scoring of T1 signal intensity, starting after 3 weeks of injections (ie, a cumulative dose of 7.2 mmol Gd/kg body weight), revealed doubtful T1 signal enhancement in the DCNs after gadobenate administrations and definite T1 signal enhancement after gadodiamide administrations, whereas no effect was observed in the gadoterate group. Analysis of the DCN–to–brain stem ratio clearly distinguished between the group treated with gadodiamide for 3 weeks and the saline and gadoterate groups, and this ratio continued to slightly increase, even during the injection-free period. Regarding the gadobenate-treated group, intermediate T1 signal enhancement was observed in the DCNs (mean, 55% ± 16% increase of the signal ratio compared with the signal ratio observed with gadodiamide). No effects on the T1 signal of the DCNs were demonstrated in the gadoterate group, regardless of the time point.
R1 mapping confirmed T1 signal enhancement in the DCNs with gadobenate and gadodiamide, even after the administration-free period for gadodiamide (ie, at week 10).
Persistence of T1 signal enhancement throughout the study, despite reports that Gd is partially cleared from the tissues,11,32 suggests a change in the form of Gd stored in brain tissues. The total Gd concentration would be expected to be lower on day 66 than on day 45, but the T1 signal ratio actually increased or remained relatively stable, suggesting that residual Gd is transformed into a storage form that enhances the T1 effect, or that Gd is cleared more rapidly from the brain stem than from the DCNs. It can be hypothesized that Gd dissociated from L-GBCAs progressively binds to (yet unidentified) macromolecules, as recently shown.33 Gianolio et al34 suggested that this form of Gd could be responsible for the majority of the T1 signal enhancement.
Total Gd Concentrations in Brain Structures
The highest Gd concentration in the DCNs was observed with the 2 L-GBCAs: 27.1 ± 6.5 nmol/g for gadodiamide and 12.0 ± 2.6 nmol/g for gadobenate, that is, 20- and 9-fold higher than the total Gd concentration measured in the DCNs with gadoterate, respectively. Furthermore, high Gd accumulation in the olfactory bulbs was observed after administration of L-GBCAs (consistent with the results observed in mice),11 and interestingly, the olfactory bulbs are also the major area of storage of manganese after exposure reported in both rodents (oral exposure)35 and humans (respiratory exposure).36
While total Gd concentration ratios for many brain structures (amygdala, cortical forebrain, hippocampus, hypothalamus, brain stem, midbrain) were equal to approximately 2 between gadodiamide and gadobenate and between gadobenate and gadoterate, some structures seemed to store higher proportions of Gd after gadodiamide injections compared with gadobenate injections: olfactory bulb (ratio of 4.8 between gadodiamide and gadobenate), cerebellar cortex (ratio of 4.0), and striatum (ratio of 3.4). As gadodiamide is the GBCA more prone to dissociate in vivo and release free Gd3+,33 we can speculate that these structures are more likely to accumulate Gd in a dissociated form than the other structures.
Total Gd concentrations observed in brain areas in our study were 1.5-2-fold higher than those reported by Kartamihardja et al,11 but with generally the same order of distribution between brain structures. These authors studied the distribution and washout of gadodiamide and gadoterate in renally impaired mice. These discrepancies in total Gd concentration could be explained by differences in the species studied (rat vs mouse), the renal impairment model (subtotal nephrectomy vs electrocoagulation), the washout time in the present study, and the cumulative dose (100 mmol Gd/kg in mice, which would be equivalent to 50 mmol/kg for rats, after adjustment for body surface area, versus 12 mmol Gd/kg in our study).28
Total Gd concentrations observed in the various brain structures after administration of L-GBCAs were correlated with Fe concentration, but not with Zn and Cu concentrations. These results support the possibility of Gd versus Fe transmetalation for L-GBCAs. The thermodynamic constants are much higher for Fe3+ (eg, for Fe-BOPTA: log Kcond = 23.4) than for Cu2+ or Zn2+ (log Kcond of Cu-BOPTA = 17.3 and log Kcond of Zn-BOPTA = 13.9),1 and Fe concentrations are higher. However, it should be noted that only the labile fraction of the Fe pool (mainly in the Fe2+ form) is susceptible to transmetalation. No difference in total endogenous metal concentrations in brain structures was observed between the various groups, which can be explained by the fact that ICP-MS is an elemental technique that does not take into account the labile fraction of the metals. Another possible explanation for the Gd-Fe correlation could be that Gd and Fe access brain areas such as the DCNs, olfactory bulb, or striatum via the same pathways.
Interestingly, it has been reported that the brain areas associated with T1 signal enhancement after more than 35 administrations of L-GBCAs to patients were the posterior thalamus, substantia nigra, red nucleus, cerebellar peduncle, colliculi, dentate nucleus, and globus pallidus,37 that is, the brain structures associated with the highest Fe concentrations.38
Plasma Gd Concentration
A classic pharmacokinetic profile was observed for plasma total Gd concentrations during the study. However, plasma Gd was still detected 1 month after the last injection. Plasma total Gd concentrations were lower following administration of gadobenate at all time points compared with the other GBCA groups, which could be attributed to specific biliary excretion of this GBCA related to its aromatic moiety, especially in the context of renal impairment and in the rat species.39–41 This excretion pattern has been previously described in renally impaired rats.42 In the case of gadobenate, the rat model may underestimate the Gd concentrations, because of a different pharmacokinetics profile and excretion pathway in this species compared with the human species. Indeed, only 3% to 5% of gadobenate is taken up by the hepatocytes in humans, while this phenomenon accounts for approximately 50% of the molecule in the rat with normal renal function.39
Urinary Excretion of Gd and Endogenous Metals
Urinary excretion of Gd and endogenous metals (Fe, Zn, Cu) was determined immediately after GBCA injection, at days 11 and 25 and on days 36 and 64, in a context of tissue Gd retention. As found in the plasma Gd concentrations, Gd urinary excretion was reduced in gadobenate in comparison with gadoterate and gadodiamide, because of the specific hepatic excretion of this molecule. The Gd urinary excretion is reduced by a factor of 3 to 4. In this model, the hepatic excretion would then represent approximately 70% of gadobenate excretion. Regarding endogenous metals, a substantial increase in urinary Zn concentrations was observed immediately after injections of gadodiamide and gadobenate. Urinary Zn excretion occurring immediately after GBCA injection has been described in patients receiving a single administration of the L-GBCA gadodiamide and, to a lesser extent, gadopentetate, but not with gadoterate.43 In the case of gadodiamide, the excess free ligand caldiamide (5% wt/vol) can chelate endogenous metals, and by extrapolating from data in humans, a significant proportion of plasma total and labile Zn could be available for chelation compared with plasma Fe or copper.43–46
The affinity constant (log Ktherm) for Zn-DTPA-BMA is 12.04 versus 7.17 for Ca-DTPA-BMA.37 However, although the pharmaceutical solution of gadobenate does not contain any added free ligand in the pharmaceutical solution,47 it induced a significant increase in urinary excretion of endogenous Zn. Therefore, the most plausible explanation for this phenomenon is a transmetalation phenomenon occurring between Gd3+ and Zn2+, possibly facilitated by the presence of elements capable of binding Gd3+, such as proteins and PO43−, displacing the equilibrium.48–51 Gadolinium versus Zn transmetalation may therefore also be responsible for part of the Zn excretion observed with gadodiamide.
Overall, clinical and nonclinical studies published over recent years have clearly demonstrated that less thermodynamically and kinetically stable GBCAs are associated with higher Gd accumulation in brain and body tissues, with a tropism for certain structures, such as the DCNs. Although all GBCAs enter cerebrospinal fluid and brain tissue via the choroid plexus, M-GBCAs remain chelated and return to the circulation to be subsequently eliminated in urine, whereas less stable L-GBCAs rapidly dissociate in the tissues, and Gd is therefore trapped in the brain. Gianolio et al34 recently showed that, after 22 injections of 0.6 mmol/kg of gadodiamide in the rat, the tissues studied only 3 days after the last injection mostly contained dissociated Gd (<20% of chelated Gd in the cerebellum and 4% in the cerebrum). In contrast, only very low levels of the M-GBCA, gadoteridol, were observed and entirely in its original chelated form. Frenzel et al33 reported fairly similar results, with a decreasing proportion of chelated Gd over time (3-day injection-free period vs 24-day injection-free period).
According to one hypothesis of dechelation, chelated Gd could form a ternary complex with PO43−, which would then allow dechelation of an intermediate state Gd3+ (PO43−) from the ligand.51–53 Once dechelated, Gd either remains in this precipitated form or is immediately bound to macromolecules (thereby leading to T1 hyperintensity), either peptides or proteins.33,54 The coexistence or predominance of these various forms would putatively lead to different levels and forms of toxicity.
In conclusion, in a sensitive translational model of a common at-risk population, only traces of Gd were observed in the brain following injections of gadoterate, in contrast to the linear Gd chelates gadobenate and gadodiamide. Gadolinium brain uptake from L-GBCAs is associated with T1 hyperintensity in the DCNs, which could be due to binding of dissociated and soluble Gd derived from L-GBCAs to macromolecules. Furthermore, the global distribution of Gd after administration of L-GBCAs (but not the macrocyclic gadoterate) in brain areas was correlated with the local tissue distribution of Fe, which supports the possibility of Gd versus Fe transmetalation or is a hint for the same pathway to access the brain. The precise localization of Gd tissue storage and identification of the Gd-binding macromolecules have yet to be documented, as well as long-term putative neurotoxic effects associated with repeated administration of L-GBCAs.
ACKNOWLEDGMENTS
The authors thank Evangeline M'Boumba, MS, for the Gd determination in tissues, and Anthony Saul, PhD, and Hélène Poenaru, for reviewing the English language. The authors also thank Jean-Luc Guerquin-Kern, PhD; Sergio Marco, PhD; and Jean-Pierre Laissy, MD, PhD, for helpful discussions.
REFERENCES
- 1.Port M, Idée JM, Medina C, et al. Efficiency, thermodynamic and kinetic stability of marketed gadolinium chelates and their possible clinical consequences: a critical review. Biometals. 2008;21:469–490. [DOI] [PubMed] [Google Scholar]
- 2.Robert P, Violas X, Grand S, et al. Linear gadolinium-based contrast agents are associated with brain gadolinium retention in healthy rats. Invest Radiol. 2016;51:73–82. [DOI] [PMC free article] [PubMed] [Google Scholar]
- 3.Jost G, Lenhard DC, Sieber MA, et al. Signal increase on unenhanced T1-weighted images in the rat brain after repeated, extended doses of gadolinium-based contrast agents: comparison of linear and macrocyclic agents. Invest Radiol. 2016;51:83–89. [DOI] [PMC free article] [PubMed] [Google Scholar]
- 4.White GW, Gibby WA, Tweedle MF. Comparison of Gd(DTPA-BMA) (Omniscan) versus Gd(HP-DO3A) (ProHance) relative to gadolinium retention in human bone tissue by inductively coupled plasma mass spectroscopy. Invest Radiol. 2006;41:272–278. [DOI] [PubMed] [Google Scholar]
- 5.Errante Y, Cirimele V, Mallio CA, et al. Progressive increase of T1 signal intensity of the dentate nucleus on unenhanced magnetic resonance images is associated with cumulative doses of intravenously administered gadodiamide in patients with normal renal function, suggesting dechelation. Invest Radiol. 2014;49:685–690. [DOI] [PubMed] [Google Scholar]
- 6.Weberling LD, Kieslich PJ, Kickingereder P, et al. Increased signal intensity in the dentate nucleus on unenhanced T1-weighted images after gadobenate dimeglumine administration. Invest Radiol. 2015;50:743–748. [DOI] [PubMed] [Google Scholar]
- 7.McDonald RJ, McDonald JS, Kallmes DF, et al. Intracranial gadolinium deposition after contrast-enhanced MR imaging. Radiology. 2015;275:772–782. [DOI] [PubMed] [Google Scholar]
- 8.Radbruch A, Weberling LD, Kieslich PJ, et al. Gadolinium retention in the dentate nucleus and globus pallidus is dependent on the class of contrast agent. Radiology. 2015;275:783–791. [DOI] [PubMed] [Google Scholar]
- 9.Kanda T, Ishii K, Kawaguchi H, et al. High signal intensity in the dentate nucleus and globus pallidus on unenhanced T1-weighted MR images: relationship with increasing cumulative dose of a gadolinium-based contrast material. Radiology. 2014;270:834–841. [DOI] [PubMed] [Google Scholar]
- 10.Radbruch A, Weberling LD, Kieslich PJ, et al. Intraindividual analysis of signal intensity changes in the dentate nucleus after consecutive serial applications of linear and macrocyclic gadolinium-based contrast agents. Invest Radiol. 2016;51:683–690. [DOI] [PubMed] [Google Scholar]
- 11.Kartamihardja AA, Nakajima T, Kameo S, et al. Distribution and clearance of retained gadolinium in the brain: differences between linear and macrocyclic gadolinium based contrast agents in a mouse model. Br J Radiol. 2016;89:20160509. [DOI] [PMC free article] [PubMed] [Google Scholar]
- 12.Lohrke J, Frisk AL, Frenzel T, et al. Histology and gadolinium distribution in the rodent brain after the administration of cumulative high doses of linear and macrocyclic gadolinium-based contrast agents. Invest Radiol. 2017;52:324–333. [DOI] [PMC free article] [PubMed] [Google Scholar]
- 13.Scala M, Koob M, de Buttet S, et al. A Pharmacokinetics, efficacy, and safety study of gadoterate meglumine in pediatric subjects aged younger than 2 years. Invest Radiol. 2018;53:70–79. [DOI] [PMC free article] [PubMed] [Google Scholar]
- 14.Roberts DR, Chatterjee AR, Yazdani M, et al. Pediatric patients demonstrate progressive T1-weighted hyperintensity in the dentate nucleus following multiple doses of gadolinium-based contrast agent. AJNR Am J Neuroradiol. 2016;37:2340–2347. [DOI] [PMC free article] [PubMed] [Google Scholar]
- 15.Renz DM, Kümpel S, Böttcher J, et al. Comparison of unenhanced T1-weighted signal intensities within the dentate nucleus and the globus pallidus after serial applications of gadopentetate dimeglumine versus gadobutrol in a pediatric population. Invest Radiol. 2018;53:119–127. [DOI] [PubMed] [Google Scholar]
- 16.Prola-Netto J, Woods M, Roberts VHJ, et al. Gadolinium chelate safety in pregnancy: barely detectable gadolinium levels in the juvenile nonhuman primate after in utero exposure. Radiology. 2018;286:122–128. [DOI] [PMC free article] [PubMed] [Google Scholar]
- 17.Erdene K, Nakajima T, Kameo S, et al. Organ retention of gadolinium in mother and pup mice: effect of pregnancy and type of gadolinium-based contrast agents. Jpn J Radiol. 2017;35:568–573. [DOI] [PubMed] [Google Scholar]
- 18.Khairinisa MA, Takatsuru Y, Amano I, et al. The effect of perinatal gadolinium-based contrast agents on adult mice behavior. Invest Radiol. 2018;53:110–118. [DOI] [PubMed] [Google Scholar]
- 19.Barbieri S, Schroeder C, Froehlich JM, et al. High signal intensity in dentate nucleus and globus pallidus on unenhanced T1-weighted MR images in three patients with impaired renal function and vascular calcification. Contrast Media Mol Imaging. 2016;11:245–250. [DOI] [PMC free article] [PubMed] [Google Scholar]
- 20.Cao Y, Zhang Y, Shih G, et al. Effect of renal function on gadolinium-related signal increases on unenhanced T1-weighted brain magnetic resonance imaging. Invest Radiol. 2016;51:677–682. [DOI] [PubMed] [Google Scholar]
- 21.Cenci MA, Whishaw IQ, Schallert T. Animal models of neurological deficits: how relevant is the rat? Nat Rev Neurosci. 2002;3:574–579. [DOI] [PubMed] [Google Scholar]
- 22.Shah A, Garzon-Muvdi T, Mahajan R, et al. Animal models of neurological disease. Adv Exp Med Biol. 2010;671:23–40. [DOI] [PubMed] [Google Scholar]
- 23.Rasschaert M, Idée JM, Robert P, et al. Moderate renal failure accentuates T1 signal enhancement in the deep cerebellar nuclei of gadodiamide-treated rats. Invest Radiol. 2017;52:255–264. [DOI] [PMC free article] [PubMed] [Google Scholar]
- 24.Stevens LA, Viswanathan G, Weiner DE. Chronic kidney disease and end-stage renal disease in the elderly population: current prevalence, future projections, and clinical significance. Adv Chronic Kidney Dis. 2010;17:293–301. [DOI] [PMC free article] [PubMed] [Google Scholar]
- 25.Duru OK, Vargas RB, Kermah D, et al. High prevalence of stage 3 chronic kidney disease in older adults despite normal serum creatinine. J Gen Intern Med. 2009;24:86–92. [DOI] [PMC free article] [PubMed] [Google Scholar]
- 26.European Medicine Agency. Assessment report for gadolinium-containing contrast agents. Procedure No. EMEA/H/A-31/1097. July 1, 2010. Available at: http://www.ema.europa.eu/docs/en_GB/document_library/Referrals_document/gadolinium_31/WC500099538.pdf. Accessed 14 July, 2017.
- 27.Food and Drug Administration. FDA Drug Safety Communication: new warnings for using gadolinium based contrast agents in patients with kidney dysfunction. October 9, 2010. Available at: http://www.fda.gov/Drugs/DrugSafety/ucm223966.htm. Accessed 14 July, 2017.
- 28.Food and Drug Administration. US Department of Health and Human Services. Center for Drug Evaluation and Research. Guidance for Industry. Estimating the maximum safe starting dose in initial clinical trials for therapeutics in adult healthy volunteers. July 6, 2005. Available at: http://www.fda.gov/downloads/Drugs/.../Guidances/UCM078932.pdf. Accessed June 15, 2017.
- 29.Tissue prep and protein assay 2012. Available at: https://fr.scribd.com/document/317128344/Tissue-Prep-and-Protein-Assay-2012. Accessed 5 December, 2017.
- 30.Spijker S. Dissection of rodent brain regions. In: Li KW, ed. Neuroproteomics (Neuromethods, Volume 57). New York, NY: Humana Press; 2011:13–26. [Google Scholar]
- 31.Shapiro SS, Wilk MB. An analysis of variance test for normality (complete samples). Biometrika. 1965;52:591–611. [Google Scholar]
- 32.Smith AP, Marino M, Roberts J, et al. Clearance of gadolinium from the brain with no pathologic effect after repeated administration of gadodiamide in healthy rats: an analytical and histologic study. Radiology. 2017;282:743–751. [DOI] [PubMed] [Google Scholar]
- 33.Frenzel T, Apte C, Jost G, et al. Quantification and assessment of the chemical form of residual gadolinium in the brain after repeated administration of gadolinium-based contrast agents: comparative study in rats. Invest Radiol. 2017;52:396–404. [DOI] [PMC free article] [PubMed] [Google Scholar]
- 34.Gianolio E, Bardini P, Arena F, et al. Gadolinium retention in the rat brain: assessment of the amounts of insoluble gadolinium-containing species and intact gadolinium complexes after repeated administration of gadolinium-based contrast agents. Radiology. 2017;285:839–849. [DOI] [PubMed] [Google Scholar]
- 35.O'Neal SL, Hong L, Fu X, et al. Manganese accumulation in bone following chronic exposure in rats: steady-state concentration and half-life in bone. Toxicol Lett. 2014;229:93–100. [DOI] [PMC free article] [PubMed] [Google Scholar]
- 36.Sen S, Flynn MR, Du G, et al. Manganese accumulation in the olfactory bulbs and other brain regions of “asymptomatic” welders. Toxicol Sci. 2011;121:160–167. [DOI] [PMC free article] [PubMed] [Google Scholar]
- 37.Zhang Y, Cao Y, Shih GL, et al. Extent of signal hyperintensity on unenhanced T1-weighted brain MR images after more than 35 administrations of linear gadolinium-based contrast agents. Radiology. 2017;282:516–525. [DOI] [PubMed] [Google Scholar]
- 38.Hallgren B, Sourander P. The effect of age on the non-haemin iron in the human brain. J Neurochem. 1958;3:41–51. [DOI] [PubMed] [Google Scholar]
- 39.Lorusso V, Arbughi T, Tirone P, et al. Pharmacokinetics and tissue distribution in animals of gadobenate ion, the magnetic resonance imaging contrast enhancing component of gadobenate dimeglumine 0.5 M solution for injection (MultiHance). J Comput Assist Tomogr. 1999;23(suppl 1):S181–S194. [DOI] [PubMed] [Google Scholar]
- 40.Kirchin MA, Lorusso V, Pirovano G. Compensatory biliary and urinary excretion of gadobenate ion after administration of gadobenate dimeglumine (MultiHance(®)) in cases of impaired hepatic or renal function: a mechanism that may aid in the prevention of nephrogenic systemic fibrosis? Br J Radiol. 2015;88:20140526. [DOI] [PMC free article] [PubMed] [Google Scholar]
- 41.Ersoy H, Rybicki FJ. Biochemical safety profiles of gadolinium-based extracellular contrast agents and nephrogenic systemic fibrosis. J Magn Reson Imaging. 2007;26:1190–1197. [DOI] [PMC free article] [PubMed] [Google Scholar]
- 42.Fretellier N, Idée J, Bruneval P, et al. Hyperphosphataemia sensitizes renally impaired rats to the profibrotic effects of gadodiamide. Br J Pharmacol. 2012;165:1151–1162. [DOI] [PMC free article] [PubMed] [Google Scholar]
- 43.Kimura J, Ishiguchi T, Matsuda J, et al. Human comparative study of zinc and copper excretion via urine after administration of magnetic resonance imaging contrast agents. Radiat Med. 2005;23:322–326. [PubMed] [Google Scholar]
- 44.Zalewski P, Truong-Tran A, Lincoln S, et al. Use of a zinc fluorophore to measure labile pools of zinc in body fluids and cell-conditioned media. Biotechniques. 2006;40:509–520. [DOI] [PubMed] [Google Scholar]
- 45.Mills E, Dong XP, Wang F, et al. Mechanisms of brain iron transport: insight into neurodegeneration and CNS disorders [review]. Future Med Chem. 2010;2:51–64. [DOI] [PMC free article] [PubMed] [Google Scholar]
- 46.Cabantchik ZI. Labile iron in cells and body fluids: physiology, pathology, and pharmacology [review]. Front Pharmacol. 2014;5:45. [DOI] [PMC free article] [PubMed] [Google Scholar]
- 47.Idée JM, Port M, Robic C, et al. Role of thermodynamic and kinetic parameters in gadolinium chelate stability. J Magn Reson Imaging. 2009;30:1249–1258. [DOI] [PubMed] [Google Scholar]
- 48.Tweedle MF, Hagan JJ, Kumar K, et al. Reaction of gadolinium chelates with endogenously available ions. Magn Reson Imaging. 1991;9:409–415. [DOI] [PubMed] [Google Scholar]
- 49.Taupitz M, Stolzenburg N, Ebert M, et al. Gadolinium-containing magnetic resonance contrast media: investigation on the possible transchelation of Gd3+ to the glycosaminoglycan heparin. Contrast Media Mol Imaging. 2013;8:108–116. [DOI] [PubMed] [Google Scholar]
- 50.Laurent S, Elst LV, Copoix F, et al. Stability of MRI paramagnetic contrast media: a proton relaxometric protocol for transmetallation assessment. Invest Radiol. 2001;36:115–122. [DOI] [PubMed] [Google Scholar]
- 51.Idée JM, Fretellier N, Robic C, et al. The role of gadolinium chelates in the mechanism of nephrogenic systemic fibrosis: a critical update. Crit Rev Toxicol. 2014;44:895–913. [DOI] [PubMed] [Google Scholar]
- 52.Baranyai Z, Pálinkás Z, Uggeri F, et al. Dissociation kinetics of open-chain and macrocyclic gadolinium(III)-aminopolycarboxylate complexes related to magnetic resonance imaging: catalytic effect of endogenous ligands. Chemistry. 2012;18:16426–16435. [DOI] [PubMed] [Google Scholar]
- 53.Robic C, Catoen S, de Goltstein MC, et al. The role of phosphate on Omniscan(®) dechelation: an in vitro relaxivity study at pH 7. Biometals. 2011;24:759–768. [DOI] [PubMed] [Google Scholar]
- 54.Knoepp F, Bettmer J, Fronius M. Gadolinium released by the linear gadolinium-based contrast-agent Gd-DTPA decreases the activity of human epithelial Na+ channels (ENaCs). Biochim Biophys Acta. 2017;1859:1040–1048. [DOI] [PubMed] [Google Scholar]