Abstract
Ultrasound beamforming relies on models of propagation to convert samples of the backscattered field through time into spatial image samples. The most common model is straight-line propagation of a focused wave, assuming a narrow steered and focused beam that propagates along a selected direction. The reconstructed image suffers from defocusing, reduced signal-to-noise ratio (SNR), and contrast loss away from the focus. “Virtual source” methods coherently combine the recorded data from multiple transmissions to form a synthetic transmit focus by making geometric assumptions about the transmissions. These also include diverging waves (virtual source behind the array) and plane waves (virtual source at infinity). Retrospective encoding for conventional ultrasound sequences (REFoCUS) beamforming has been proposed to instead model transmission as the superposition of the responses of individual transmit elements on the transducer array and to efficiently estimate the “complete data set”—individual element transmit and receive responses. In addition to isolating individual element contributions, the result of this unifying framework is a high-SNR, two-way focused image from focused plane wave or diverging transmissions. No significant differences were observed for either SNR or image quality measured by contrast-to-noise ratio between the appropriate virtual source method and REFoCUS beamforming in simulation and experimental imaging.
I. INTRODUCTION
Conventional ultrasound imaging relies on sampling the spatial field using narrow focused beams. Axial distance is determined based on assumed propagation time, and lateral position is determined based on the geometry of the focused beam—its origin and focus or steering. Electronic delays on each array element allow a beam to be focused on a point in the field such that the pulse from each element arrives at that point in phase. The resulting beam is steered in that direction, narrowing in extent as it approaches the focus. The same process is applied to the received data, focusing the recorded signals by applying time delays to account for the propagation distance from each field point to the array elements.
Dynamic receive beamforming allows a different receive focal point to be selected for each depth along a reconstructed line, optimizing the lateral resolution (the width of the beam) at all depths. However, the transmit focus is fixed based on the geometric configuration selected in transmission. This choice creates a depth of field effect, a small axial region around the focus where the focal quality is optimized. Many classes of solutions have been proposed to extend the depth of field (Thomenius, 1996). It is possible to reduce the frame rate to stitch together multiple images with different focal depths, or to combine multiple focal zones into a single transmission (Hossack, 1996). Non-diffracting transmit beams can also be used to maintain a more constant lateral resolution through depth (Lu and Greenleaf, 1992).
It has been shown that the received echo data contain a nearly constant spatial bandwidth through depth, despite the apparent narrow depth of field over which high lateral resolution is achieved (Zemp and Insana, 2007). It is therefore possible to use spatial and spatiotemporal filters to recover resolution using deconvolution approaches (Freeman et al., 1995; Lingvall et al., 2003; Zemp and Insana, 2007), although these methods are sensitive to modeling of the transducer and imaging system.
Perhaps the most widely used is the synthetic transmit aperture method, commonly referred to simply as synthetic aperture imaging (although this term can describe a broader class of methods; Jensen et al., 2006). By coherently combining the data from multiple transmit events with appropriate delays, a single improved image can be formed as if the transmit focus had been optimized throughout the image (Bae and Jeong, 2000; Frazier and O'Brien, 1998; Hemmsen et al., 2014; Nikolov and Jensen, 2002). This approach also extends to other transmit beam patterns such as diverging and plane waves, which has opened many new pulse sequencing possibilities (Gammelmark and Jensen, 2003; Karaman and O'Donnell, 1995; Montaldo et al., 2009; Tanter and Fink, 2014). However, as will be demonstrated, this class of methods is heavily dependent on the geometry of the transmit beam and susceptible to artifacts if the beam is not carefully modeled.
We have developed a generalized model for synthetic aperture beamforming that avoids the intricacies of the specific geometric beam model. The model is based on discrete array elements and the applied transmit delays. This method has been previously demonstrated for estimation of the individual transmit element responses from focused transmit beams (Bottenus, 2018a). We have named this technique retrospective encoding for conventional ultrasound sequences (REFoCUS) beamforming for its ability to change the effective transmit beam geometry using a decoding process, irrespective of the original focal configuration. It is generalized in this work to other transmit beam geometries and directly compared to conventional synthetic aperture methods.
II. THEORY
A. Virtual source beamforming
The focusing of received echoes across an array relies on accurate assumptions about the geometric path of the propagating wave. For synthetic aperture focusing, the spatial extent of the beam is equally important. The “virtual source” model is the most commonly used set of geometric assumptions and covers several different types of transmit focal configurations. In this model, an effective point source is placed in the field relative to the transmitting array—in front of the array (focused waves), behind the array (diverging waves), or at infinity (plane waves). Time delays for the array elements are determined to remove the path length differences from each element to that point (Bae and Jeong, 2000; Frazier and O'Brien, 1998).
For the case of a focused transmission, the selected focal point with position (xf, zf) is used as the virtual source relative to the array elements at (xn, 0) with an assumed speed of sound c. The time delay τnT for the transmit element T is
| (1) |
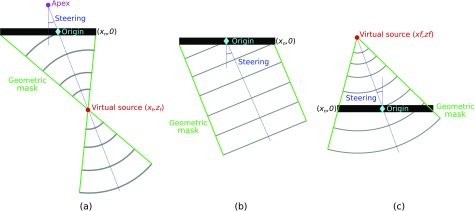
This focal configuration requires a fairly complex beam model, shown in Fig. 1(a). The focal point is often selected based on an apex, steering angle, and focal radius. The assumed propagation of the wave begins when the element located at the origin transmits, even though some elements have not yet transmitted. The wave then converges spherically toward the virtual source and diverges spherically past the virtual source. It is assumed that the propagating wave creates an isochronous contour, where points along a fixed radius from the virtual source (either shallow to or deep to) are excited by the wave simultaneously.
FIG. 1.
(Color online) Assumed geometric models used in virtual source beamforming for three different types of transmitted waves: (a) focused, (b) plane wave, and (c) diverging. The “geometric mask” defines the assumed spatial extent of the wave.
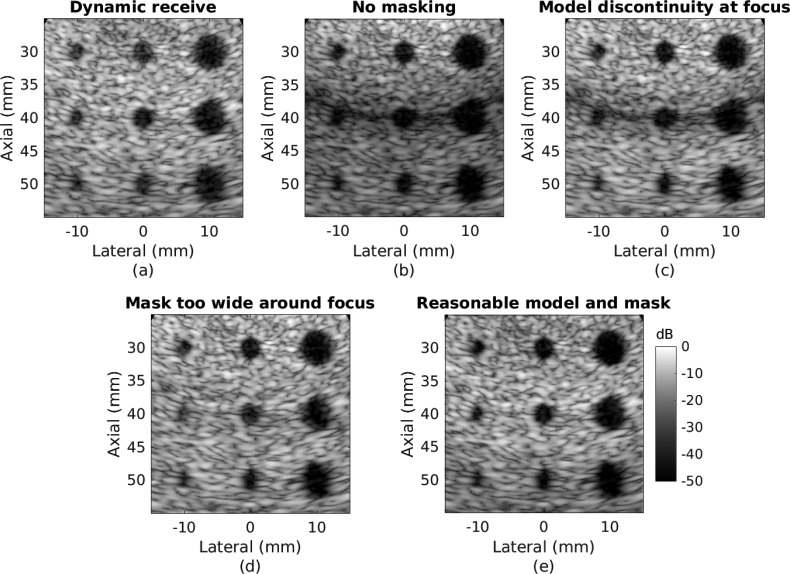
Figure 2(a) shows the dynamic receive image for Field II simulated data (Jensen, 1996; Jensen and Svendsen, 1992) using a single on-axis line reconstructed from each focused transmission. The image shows off-axis scatter and degraded resolution away from the 40 mm focal point that fills in the anechoic lesion targets. Ideal focusing is achieved at the focal depth to visualize the center row of lesions. In virtual source focusing, the finite extent array and converging wavefront implies a geometric masking where the propagating wavefront passed through, commonly an “hourglass” as drawn in Fig. 1(a). Attempting to reconstruct pixels outside this region produces noise, reducing the signal-to-noise ratio (SNR) and adding clutter to the reconstructed image as shown in Fig. 2(b). At the focal depth, it is necessary to widen the hourglass mask to reconstruct pixels between the focal points of neighboring beams. This causes a discontinuity in assumed wave arrival time where the contours shallow to the focal point meet the contours deep to the focal point, as shown in Fig. 2(c). Some studies using the technique have set the focal point outside the imaging depth to avoid having this artifact corrupt the image (Kim et al., 2012). Recently, Nguyen and Prager (2016) developed a model that assumes planar propagation rather than spherical outside the hourglass mask, removing the discontinuity from the image as in Fig. 2(d). Properly adjusting the width of the mask at the focal depth for this scheme, here 1.25λz/D, creates a more uniform image with high resolution at all depths as in Fig. 2(e).
FIG. 2.
Simulated focused transmit data (40 mm focus) with different beamforming methods to show common artifacts. (a) Dynamic receive. (b) Virtual source, no spatial mask. (c) Virtual source with an “hourglass” spatial mask. (d) Virtual source with plane wave transition zone and wide spatial mask. (e) Virtual source with plane wave transition zone and adjusted spatial mask.
Plane wave imaging simplifies the model by effectively moving the virtual source point to an infinite distance away at steering angle θ using a different time delay (Montaldo et al., 2009)
| (2) |
The resulting propagating wavefront is planar, shown in Fig. 1(b). This geometry also simplifies the spatial masking necessary, creating a largely nondiffracting beam in the near field. The spatial mask is approximately the width of the transmitting array, steered in the direction of the beam.
The virtual source can also be placed behind the array to create a diverging wave. While this creates geometrically the same propagating wavefront as a single small element would, transmitting on more elements increases the transmitted pressure and the resulting SNR (Karaman and O'Donnell, 1995). In the extreme case, this method uses all array elements and varies the transmitted beam by moving the source laterally behind the array (i.e., zf < 0)
| (3) |
The geometric mask required for the diverging beam depends on the extent of the diverging wave that is represented by the finite aperture size, as shown in Fig. 1(c).
In all cases, the act of steering the beam (i.e., moving the virtual source) samples unique sections of k-space (Walker and Trahey, 1998) and increases the effective synthetic transmit aperture size. The choice of model largely affects the spatial distribution of the transmit beam energy, trading field of view for SNR within each transmission.
B. REFoCUS beamforming
REFoCUS beamforming was introduced in the context of focused transmit beams (Bottenus, 2018a). Specifically, the method proposed using time shifts of the received echoes to remove the applied transmit delays for each transmitting element in order to estimate the “complete data set”—the signals corresponding to each transmit and receive element pair. For each of M array elements, the delay applied to each of N transmit beams is reversed so that the diverging wave from the selected element is coherently reinforced while the other transmitted signals destructively interfere with each other. The signals in the recovered complete data set can be processed (e.g., weighted, used in coherence estimates, etc.) and beamformed with a standard diverging wave beamformer.
The required time shifts can be efficiently applied in the Fourier domain using complex matrix multiplication. The recorded signals are the linear combination of the individual array element responses , where the elements have been time delayed according to τnT. The linear operator gives the time-delayed sum across elements, where the delays vary by both element and transmit beam steering
| (4) |
| (5) |
Note that the signals and are the backscattered responses from the unknown media being imaged. As in conventional imaging, this model does not take into account a specific target or scatterer structure. The summed response is directly recorded during imaging.
An estimate of the individual transmit element signals is produced by multiplying by the conjugate transpose of this matrix . This is equivalent to removing the applied time shift from each transmit event and coherently summing the signals together
| (6) |
| (7) |
The accuracy of the estimate of the individual element signals depends on how similar is to the identity matrix. It has been previously demonstrated that while the model of Eqs. (5) and (6) does not provide a true identity matrix (i.e., there is incomplete cancellation of other element responses), it is a sufficient approximation for the purpose of imaging (Bottenus, 2018a).
It was previously demonstrated that this decoding method is useful for focused beams described by the τnT of focused beams from Eq. (1). It will be demonstrated that this method also applies to the other expressions for τnT given above in Eqs. (2) and (3) commonly associated with virtual source synthetic aperture beamforming. While this method is presented for use of the entire aperture on every transmission, the Appendix describes the application of REFoCUS to a translating aperture.
Finally, beamforming is performed on the complete data set to account for the assumed time of flight from the element T to the reconstructed pixel P and back to the receiving element R. The final image pixel rP is the weighted (apodized) sum over all transmit and receive element pairs
| (8) |
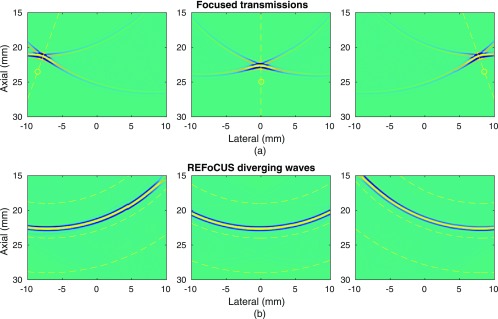
The simulated transmit pressure field for these operations is shown in Fig. 3. Field II (Jensen, 1996; Jensen and Svendsen, 1992) was used to simulate recordings of the time traces at points in the transmit pressure field for transmissions from a 3 MHz, 80% bandwidth, 64 element, λ/2 pitch array focused at 25 mm depth for steering angles from −30° to 30°. A snapshot of these fields at one time after transmit is shown in Fig. 3(a). REFoCUS beamforming recombines the data from these different transmit events to effectively create diverging waves from the different transmitting array elements. Figure 3(b) shows the result of applying the REFoCUS delays to the transmit pressure fields for three different array elements. The backscattered echoes from these effective pressure fields will therefore behave as if they were produced by the individual element diverging waves.
FIG. 3.
(Color online) (a) Field II transmit pressure field simulation for focused transmits with a focal depth of 25 mm and angles between −30° and 30°. The dashed line and circle indicate the steering direction and focal point. (b) Effective diverging waves formed by applying the REFoCUS method to the focused transmit data. Dashed circular lines show circular contours for the selected array element in each case.
C. Comparison of sampling
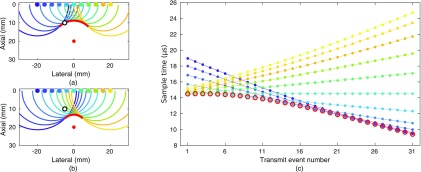
While both virtual source and REFoCUS beamforming coherently combine samples taken across multiple transmit events to from a synthetic transmit aperture, the samples selected for virtual source imaging are a subset of the samples used in REFoCUS. Figure 4(a) illustrates an example transmit wavefield from an array of 11 elements focused at a point at 20 mm depth with 0° steering angle. The individual element transmissions are modeled as circularly diverging waves, while their coherent sum along the leading wavefronts forms the geometric converging wave. The illustration shows the time when this geometric wave intersects a point of interest (black circle). To reconstruct this image point, a single sample would be selected from the recorded data for this transmit event based on this intersection time and combined with the single sample selected from each other steered transmit event. These sample times are plotted as red open circles in Fig. 4(c).
FIG. 4.
(Color online) Comparison of the sampling scheme for focused virtual source beamforming and REFoCUS beamforming. (a) Diagram of the transmit wavefield from 11 elements (upper solid markers) when the wavefront converging toward the focus (central solid marker) intersects the selected spatial point (black circle). Each spherical wave originates from the matching source element. (b) Diagram of the transmit wavefield at a later point in time after the converging wavefront has passed the selected point, which now intersects the trailing waves. (c) The virtual source (open circles) and REFoCUS (filled dots) samples through time required to beamform the signal for a single receive channel and the selected spatial location. The lines connect the samples corresponding to each recovered source element.
REFoCUS beamforming creates an image with a two-step process—estimation of the complete data set and summation across the recovered transmit elements. To estimate the data corresponding to a single transmit element for a point of interest, a single sample is selected from each transmit event just as before. However, this sample is selected using the intersection time of circular diverging wave from the desired element with the point of interest rather than the assumed geometric converging wave of virtual source beamforming. Figure 4(b) shows the wavefield at a later point in time, when the geometric converging wavefront has passed the point of interest. At this time, the diverging wave from one transmit element intersects the point, providing a sample for reconstruction. This process is then repeated for each transmit element and results in M samples taken from the data for each transmit event corresponding to the M elements. The sample times selected for each steered transmit are plotted in Fig. 4(c) and connected with lines to show the contributions of each individual element.
Note that the selected virtual source samples are contained within the set of REFoCUS samples and all additional REFoCUS samples are taken from later in time. The physical explanation for this is that the virtual source model performs beamforming based on the leading edge of the transmit wavefield, while REFoCUS also incorporates coherent contributions from the trailing wavefield as shown in Fig. 4(b). These contributions have been observed as creating “trailing clutter” or a “ghost” after the main backscattered echo, and are often minimized using transmit apodization (Démoré et al., 2009; Sheeran et al., 2012; Udesen et al., 2008). Rather than suppress these components, REFoCUS beamforming demonstrates that they can be properly time-delayed and coherently added to the synthetic aperture model to attempt to recover the complete data set. Both methods still suffer from incomplete suppression of these components that leads to clutter in the final image.
III. METHODS
Field II simulation was performed to generate the complete data set for a 3 MHz, 80% bandwidth, 64 element, λ/2 pitch array. The simulation was run for each transmitting element at 120 MHz sampling and the receive element data were sampled at 20 MHz for processing. The simulated phantom contained anechoic lesions of 1.5, 2, and 3 mm diameter spaced every 10 mm axially in uniform speckle background (uniform amplitude scatterers, random positioning, 20 scatterers per resolution cell). Fifty unique speckle realizations were simulated.
Simulated data from the individual transmit elements were combined using Eq. (4) to synthesize the responses from different transmit focal geometries with time delay equations (1)–(3), assuming linearity of the simulated imaging system. In all cases, the transmissions were steered from −30° to 30° in 0.5° increments. A focused transmit data set was produced with a 40 mm focal depth. A plane wave data set was produced with no additional focusing. A diverging wave data set was produced with a −40 mm focal depth (i.e., behind the transducer).
Experimental imaging was performed using the Verasonics Vantage 256 research scanner (Kirkland, WA). Unfocused channel data were acquired with the P4–2v phased array transducer with a transmit center frequency of 2.98 MHz and a sampling rate of 11.91 MHz. Unlike in the simulated case, data were collected independently for each transmit geometry—focused, plane, and diverging—rather than synthesized. The steering angles and focal geometries were matched to the synthesized simulated data cases. All elements were used in each transmission without apodization and matching data were acquired for the focused wave, plane wave, and diverging wave cases. A line target (0.2 mm diameter monofilament) was imaged in cross section in a water tank using ten sequential frames (averaged before processing) using 1.6 V transmit voltage. Uniform speckle was imaged in a CIRS Zerdine phantom (Norfolk, VA) at ten spatial positions, ten sequential frames each using both a 1.6 V and 9.3 V transmit voltage. Anechoic lesion targets were imaged in an ATS 549 ultrasound phantom (Norfolk, VA) using a 9.3 V transmit voltage.
Appropriate beamforming was applied to each type of scan geometry to reconstruct a polar grid with steering from −30° to 30° and scan converted to a Cartesian grid for display after envelope detection. Dynamic receive beamforming was implemented using a single reconstructed line for each focused transmit beam. Focused virtual source beamforming was implemented using the planar assumption to remove the focal depth discontinuity (Nguyen and Prager, 2016). A spatial mask was applied to the reconstructed data from each transmit event as shown in Fig. 1(a) with the addition of a minimum transverse width of 1.25λz/D around the focal point. Plane wave beamforming was performed and a steered spatial mask with a lateral extent equal to the width of the array was applied as shown in Fig. 1(b). Diverging wave beamforming was performed and a spatial mask was applied as shown in Fig. 1(c). REFoCUS beamforming was performed for each case by using the applied transmit delays to recover the complete data set followed by diverging wave beamforming. Unlike in the virtual source methods, no spatial masking was applied during any step of the beamforming process.
Image quality was measured using contrast-to-noise ratio (CNR) to compare the means μ and variances σ2 inside and outside an anechoic lesion (Smith et al., 1983)
| (9) |
Temporal SNR was quantified using normalized cross-correlation ρ between radio frequency speckle images x and y with N pixels each in sequential frames (Friemel et al., 1998). N pixels corresponded to a mm axial kernel for a single image line
| (10) |
Correlations were calculated between beamformed images from the speckle phantom using all pairs of temporal frames within each spatial position. The Fisher z-transformation (Fisher, 1915) was applied to the correlation values as a variance-stabilizing transform for comparison between the beamforming methods
| (11) |
IV. RESULTS
A. Simulation
The gold standard for delay-and-sum beamforming is the complete data set. Diverging wave beamforming of each individual transmit and receive element pair achieves a two-way focus at every point in the image. In simulation, this scheme is feasible because there is no noise present. Figure 5(a) shows the image formed from the complete data set with a sample lesion region of interest indicated for CNR calculation. Figures 5(b)–5(d) show the results of REFoCUS beamforming with the different transmit focal geometries synthesized from the complete data set. In all cases, the speckle pattern and anechoic lesions are nearly visually identical.
FIG. 5.
(a) Simulated phantom complete data set (all transmit and receive element pairs) for reference, with sample lesion (white) and background (black) regions of interest for CNR calculation circled. (b)–(d) Focused (40 mm focus), plane wave, and diverging transmit (−40 mm focus) configurations with REFoCUS beamforming applied.
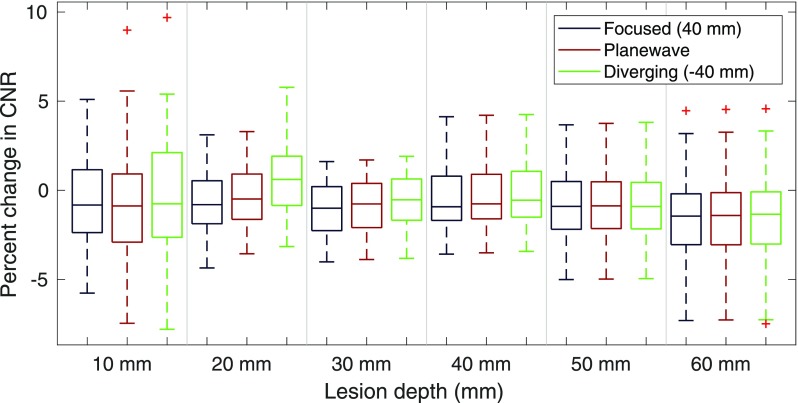
Calculation of the CNR for the central lesions at different depths confirms that no large differences exist between REFoCUS beamforming with different transmit geometries and the gold standard or among the transmit geometries. Figure 6 shows the distributions of percent change for each method relative to the complete data set. The results inherently vary with each speckle realization, leading to high variance within each measurement.
FIG. 6.
(Color online) Percent change in simulated lesion CNR between the images produced with the REFoCUS method and the complete data set. The box and whisker plot shows the distributions from 50 speckle realizations.
B. Experimental
Experimental phantom imaging allows for study of differences in off-axis scattering and temporal SNR between the virtual source methods and REFoCUS using a real transducer and a noisy imaging environment.
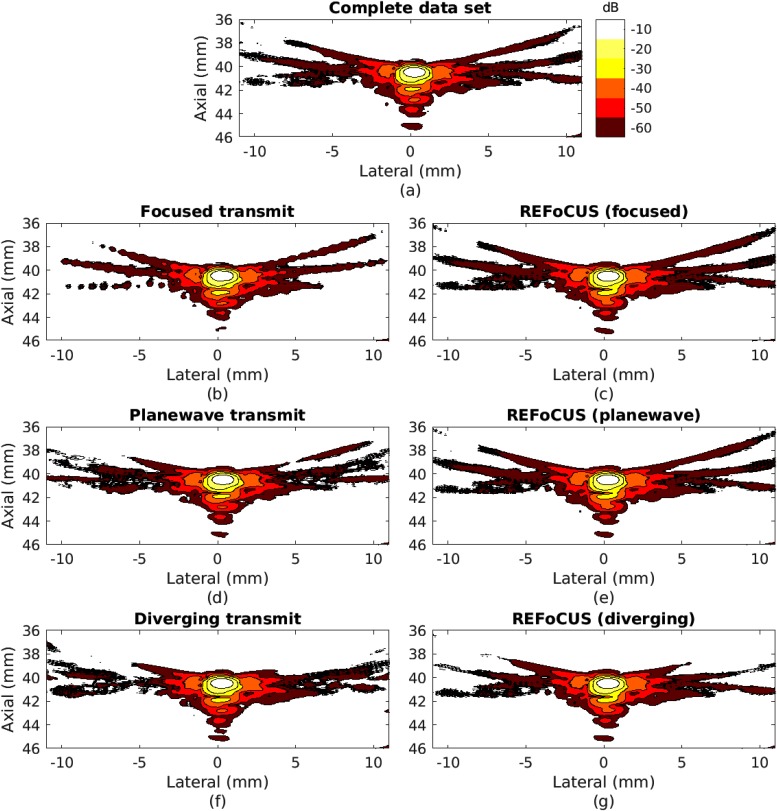
Figure 7 demonstrates the use of REFoCUS to synthetically focus data corresponding to the three tested transmit focal geometries. These point spread functions show that in all cases both the virtual source method and REFoCUS successfully form a transmit focus similar to the complete data set reference. The focused transmit virtual source case in Fig. 7(b) shows some irregularity in the −60 dB side lobes due to the choice of masking function around the focus. All cases show suppression of incompletely canceled signals below −60 dB relative to the peak of the point spread function and demonstrate similar shapes and extents of the side lobes. It has been previously demonstrated through experimental study that the individual element signals estimated by REFoCUS also closely approximate the complete data set responses for individual elements (Bottenus, 2018a).
FIG. 7.
(Color online) Experimental cross-sectional contour plots of line targets with different transmit focal configurations and beamforming methods. (a) Complete data set sampling for reference. (b),(d),(f) Focused, plane, and diverging, respectively, wave transmits processed with conventional virtual source methods and (c),(e),(g) with REFoCUS.
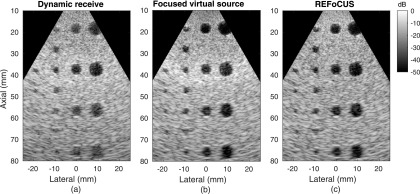
Figure 8 shows the results for imaging an anechoic lesion phantom with focused transmit beams. The conventional dynamic receive image in Fig. 8(a) shows a narrow depth of field around the 40 mm focal depth as expected. The resolution is degraded and off-axis clutter obscures the lesion targets both shallow and deep to this point. A bright horizontal band ∼1 cm wide is also visible at the focal depth due to focal gain that has not been corrected with depth-dependent processing. Figure 8(b) shows the virtual source reconstructed image, which has improved resolution and target detectability away from the focus. A bright band is still visible at the focus where focal gain has not been completely removed by the selected spatial beam mask. The REFoCUS beamformed image in Fig. 8(c) shows qualitatively similar image quality to the virtual source method but with improved image uniformity without applied spatial masking.
FIG. 8.
Experimental phantom data set with a fixed transmit focus (40 mm depth) processed using (a) dynamic receive, (b) focused virtual source, and (c) REFoCUS beamforming.
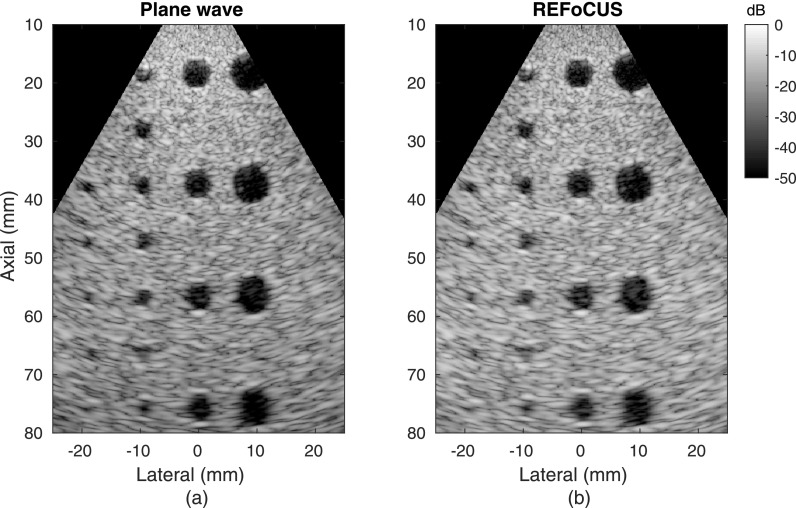
Plane wave imaging in Fig. 9 shows similar results to the focused cases. Both the virtual source and REFoCUS cases produce high-resolution images over the entire depth of field. There is a subtle gain (brightness) difference between the two images, causing slightly more visible clutter in the REFoCUS case on the displayed 50 dB color scale even though it also exists in the virtual source case. Similar to how the focused virtual source method produced some gain at the focal depth due to the selected spatial mask, the mask selected for the plane wave case increases brightness in the near-field, within the first 10–20 mm from the transducer. The rest of the image is then rescaled to be darker, causing an apparent difference from the REFoCUS case where none exists.
FIG. 9.
Experimental phantom data set with steered plane wave transmits processed using (a) conventional plane wave and (b) REFoCUS beamforming.
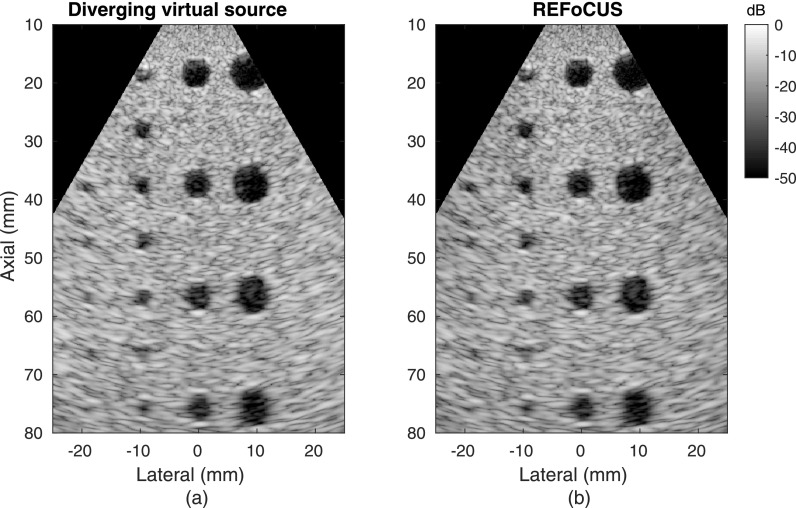
The diverging wave images in Fig. 10 show the most similarity between the virtual source and REFoCUS cases. Both methods produce a spatially uniform image with two-way focusing throughout. The subjective image quality is similar to the previous cases. CNR was not measured in these sample cases due to the small expected effect size and the large measurement variability observed in simulation across speckle realizations.
FIG. 10.
Experimental phantom data set with virtual source (−40 mm) diverging wave transmits processed using (a) diverging virtual source and (b) REFoCUS beamforming.
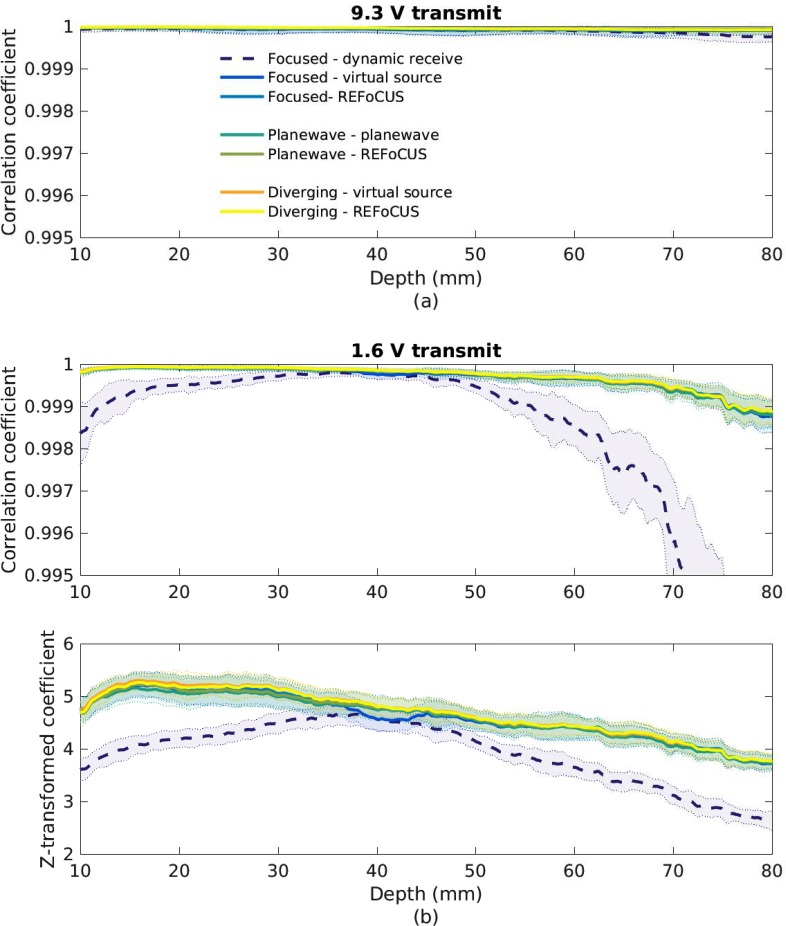
The images produced from the uniform speckle phantom were used to estimate SNR down the central image line using temporal correlation between the frames. Figure 11(a) shows the measured correlations for each transmit geometry and beamforming method for the higher (9.3 V) transmit voltage. In the high-SNR phantom imaging environment, this is sufficient transmit amplitude so as to exceed our ability to distinguish the differences in the resulting signals. All correlations exceeded 0.9995 and further increasing the transmit voltage did not improve correlation.
FIG. 11.
(Color online) Temporal correlation in a speckle phantom for varying transmit and beamforming configurations with (a) 9.3 V and (b) 1.6 V transmit voltages. The shaded error bars indicate the standard deviation over ten temporal frames at each of ten spatial locations. For (b), the Fisher z-transform has been applied to display the correlation values as a normal distribution, increasing the dynamic range of the displayed data.
Lowering the transmit voltage to 1.6 V to mimic a lower-SNR environment removed the problem of signal saturation. Figure 11(b) shows the temporal correlations for the different transmit geometries and methods. The dynamic receive case shows an obvious difference away from the focal depth, but the other cases are indistinguishable on the displayed scale. Applying the Fisher z-transform stabilizes the variance through depth (removing the apparent difference between the variance for higher and lower correlation values) and makes any differences more apparent. It is clear that the virtual source and REFoCUS methods perform equivalently at all depths. There is a small drop in correlation in the focused virtual source case at the focal depth, likely caused by the same model inaccuracy in masking that created a bright band in the image.
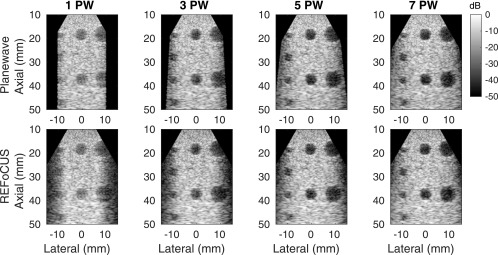
Finally, the plane wave imaging case was used to explore the possibility of reducing the number of transmit events used to produce an image. Figure 12 shows the results of using 1, 3, 5, and 7 steered plane waves separated by 3° angular spacing using both the typical virtual source method and REFoCUS. Aside from the differences in spatial masking, in all cases the two methods produce qualitatively similar results. Improvement is observed in target detectability as the number of plane waves is increased, reducing side lobes and off-axis scattering.
FIG. 12.
(Top) Virtual source and (Bottom) REFoCUS reconstructions of experimental phantom data with varying numbers of steered plane waves (1,3,5,7) with 3° angular spacing.
V. DISCUSSION
It is an interesting finding that, at least for the imaging environment and transmit voltage tested, no significant differences in temporal SNR were observed between the various transmit focal geometries with either virtual source or REFoCUS beamforming. This runs counter to the intuition of trading field of view for temporal SNR by varying the transmit geometry and suggests that proper beamforming can recover enough of the spatially distributed energy for differences to be negligible. Similarly, image quality measured by CNR does not vary between transmit focal geometries even though the spatial distribution of transmit energy is different.
It is also intriguing that even though REFoCUS is described as a decoding process and averages more data samples together for each image point, it does not seem to improve SNR over the corresponding virtual source methods. As can be observed in the transmit pressure field of Fig. 3(a), the individual transmit element components are of low amplitude relative to the coherent geometric wavefront. It is possible that each coherent signal added from the trailing wavefronts as illustrated in Fig. 4(c) carries sufficient incoherent signal to maintain a fixed SNR relative to the virtual source method.
REFoCUS beamforming uniquely provides the ability to perform element-wise transmit processing, as with the complete data set. For example, spatially varying transmit apodization wTP can be applied in post-processing as in Eq. (8). Apodization is only possible as a function of transmit event with the virtual source methods, meaning that the effect is geometry dependent and spatially varying. While the weighting works well for plane wave transmissions (Rodriguez-Molares et al., 2015), the ability is lost entirely at the focal point of focused transmissions (i.e., the spatial point is sampled by only a single transmission).
It was demonstrated that the proposed method is useful even when fewer transmissions are used than there are transmit elements. It is beyond the scope of this work to explore the structure of the “recovered” individual element signals in this case other than to show that the result after beamforming is similar to the virtual source method. This is an important feature for “ultrafast” imaging with broad transmissions (Montaldo et al., 2009), making REFoCUS beamforming applicable to a wider set of imaging tasks.
The targets in this study had no motion during the scan sequence. Just as in virtual source beamforming, REFoCUS would be susceptible to the incoherence of backscattered signals resulting from motion between transmissions. Focused virtual source beamforming should be less susceptible around the focus, where fewer beams are required to coherently combine to form the synthetic transmit aperture. Away from the focus, or in the case of plane or diverging waves, virtual source beamforming still requires combination of many or all beams. Assuming 200 μs for each beam, this study would require coherence within a fraction of a wavelength (λ = 0.5 mm) over a span of 24 ms to combine all beams. Previous work has shown that half the beam density used in this work is sufficient for REFoCUS (Bottenus, 2018a), reducing that span to 12 ms.
The proposed technique is, in some regards, similar to recent work that described delay-encoded transmission and frequency domain inversion (Gong et al., 2015, 2016) and filtered time delay inversion of steered plane waves (Li et al., 2016). The former works required a specially designed Hadamard-like delay matrix, while the latter uses a conventional plane wave delay sequence as REFoCUS does. REFoCUS should be more robust to arbitrary transmit sequences since it is based on time shifts rather than frequency inversion, but may suffer from incomplete recovery of the individual elements. The exploration of the relationship and trade-offs between these methods, as well as optimization of the transmit delay sequence, is left for future work.
VI. CONCLUSION
It has been demonstrated that the element-based model used by REFoCUS imaging produces approximately equivalent results to virtual source methods across common transmit beam geometries. REFoCUS additionally produces improved uniformity in depth-dependent gain and allows access to the individual transmit element responses to enable further post-processing. Performance of the method in vivo in the presence of degrading effects such as reverberation, aberration. and target motion is still to be evaluated.
ACKNOWLEDGMENTS
The author would like to acknowledge Gregg Trahey for his consultation and encouragement in this work. This work is supported by National Institutes of Health (NIH) Grant No. R01-EB017711 from the National Institute of Biomedical Imaging and Bioengineering and the Duke-Coulter Translational Partnership Grant Program.
APPENDIX: REFOCUS BEAMFORMING WITH A TRANSLATING APERTURE
The results in this work were produced with a phased array transducer that is commonly sampled by steering its focused beams using the full aperture extent. Linear and curvilinear arrays often build an image by translating the active aperture across a larger array extent to move the source of the beam. This translation can be accomplished by multiplexing or electronic apodization and is usually performed without additional beam steering (although this is not universally true). Synthetic aperture beamforming can still be applied to these data because the moving beam samples different regions of k-space and therefore provides unique information to form the synthetic transmit aperture. REFoCUS beamforming can similarly be applied to these cases by applying an apodization term a to the encoding matrix H,
| (A1) |
| (A2) |
| (A3) |
where the “∘” symbol represents element-wise multiplication. These expressions simply state that the transmitted beam is the linear combination of a subset of the total array elements. The estimation of individual element responses is correspondingly dependent only on the transmissions where that element was active. The edge elements of the array that were part of fewer transmissions are therefore less uniquely determined and are only partially isolated. This property is reflected in the encoding/decoding matrix . However, this model is still sufficient to produce a high quality synthetically focused image as shown in Fig. 12 of Bottenus (2018b).
Portions of this work were presented in “Recovery of the complete data set from ultrasound sequences with arbitrary transmit delays,” 174th Meeting of the Acoustical Society of America, New Orleans, LA, USA, December 2017.
References
- 1. Bae, M.-H. , and Jeong, M.-K. (2000). “ A study of synthetic-aperture imaging with virtual source elements in B-mode ultrasound imaging systems,” IEEE Trans. Ultrason. Ferroelectr. Freq. Control 47(6), 1510–1519. 10.1109/58.883540 [DOI] [PubMed] [Google Scholar]
- 2. Bottenus, N. (2018a). “ Recovery of the complete data set from focused transmit beams,” IEEE Trans. Ultrason. Ferroelectr. Freq. Control 65(1), 30–38. 10.1109/TUFFC.2017.2773495 [DOI] [PMC free article] [PubMed] [Google Scholar]
- 3. Bottenus, N. (2018b). “ Recovery of the complete data set from ultrasound sequences with arbitrary transmit delays,” Proc. Mtgs. Acoust. 31(1), 020001. 10.1121/2.0000662 [DOI] [Google Scholar]
- 4. Démoré, C. E. M. , Joyce, A. , Wall, K. , and Lockwood, G. (2009). “ Real-time volume imaging using a crossed electrode array,” IEEE Trans. Ultrason. Ferroelectr. Freq. Control 56(6), 1252–1261. 10.1109/TUFFC.2009.1167 [DOI] [PubMed] [Google Scholar]
- 5. Fisher, R. (1915). “ Frequency distribution of the values of the correlation coefficient in samples from an indefinitely large population,” Biometrika 10(4), 507–521. [Google Scholar]
- 6. Frazier, C. H. , and O'Brien, W. D., Jr. (1998). “ Synthetic aperture techniques with a virtual source element,” IEEE Trans. Ultrason. Ferroelectr. Freq. Control 45(1), 196–207. 10.1109/58.646925 [DOI] [PubMed] [Google Scholar]
- 7. Freeman, S. , Li, P. C. , and O'Donnell, M. (1995). “ Retrospective dynamic transmit focusing,” Ultrason. Imaging 17(3), 173–196. 10.1177/016173469501700301 [DOI] [PubMed] [Google Scholar]
- 8. Friemel, B. H. , Bohs, L. N. , Nightingale, K. R. , and Trahey, G. E. (1998). “ Speckle decorrelation due to two-dimensional flow gradients,” IEEE Trans. Ultrason. Ferroelectr. Freq. Control 45(2), 317–327. 10.1109/58.660142 [DOI] [PubMed] [Google Scholar]
- 9. Gammelmark, K. L. , and Jensen, J. A. (2003). “ Multielement synthetic transmit aperture imaging using temporal encoding,” IEEE Trans. Med. Imaging 22(4), 552–563. 10.1109/TMI.2003.809088 [DOI] [PubMed] [Google Scholar]
- 10. Gong, P. , Kolios, M. C. , and Xu, Y. (2015). “ Delay-encoded transmission and image reconstruction method in synthetic transmit aperture imaging,” IEEE Trans. Ultrason. Ferroelectr. Freq. Control 62(10), 1745–1756. 10.1109/TUFFC.2015.007005 [DOI] [PubMed] [Google Scholar]
- 11. Gong, P. , Kolios, M. C. , and Xu, Y. (2016). “ Pseudoinverse decoding process in delay-encoded synthetic transmit aperture imaging,” IEEE Trans. Ultrason. Ferroelectr. Freq. Control 63(9), 1372–1379. 10.1109/TUFFC.2016.2578952 [DOI] [PubMed] [Google Scholar]
- 12. Hemmsen, M. C. , Rasmussen, J. H. , and Jensen, J. R. A. (2014). “ Tissue harmonic synthetic aperture ultrasound imaging,” J. Acoust. Soc. Am. 136(4), 2050–2056. 10.1121/1.4893902 [DOI] [PubMed] [Google Scholar]
- 13. Hossack, J. (1996). “ Extended focal depth imaging for medical ultrasound,” in Proceedings of the 1996 IEEE Ultrasonics Symposium, Vol. 2, pp. 1535–1540. [Google Scholar]
- 14. Jensen, J. A. (1996). “ Field: A program for simulating ultrasound systems,” Med. Biol. Eng. Comput. 34(Suppl. 1, Pt. 1), 351–353. 10.1007/BF02520003 [DOI] [PubMed] [Google Scholar]
- 15. Jensen, J. A. , Nikolov, S. I. , Gammelmark, K. L. , and Pedersen, M. H. (2006). “ Synthetic aperture ultrasound imaging,” Ultrasonics 44, e5–e15. 10.1016/j.ultras.2006.07.017 [DOI] [PubMed] [Google Scholar]
- 16. Jensen, J. A. , and Svendsen, N. B. (1992). “ Calculation of pressure fields from arbitrarily shaped, apodized, and excited ultrasound transducers,” IEEE Trans. Ultrason. Ferroelectr. Freq. Control 39(2), 262–267. 10.1109/58.139123 [DOI] [PubMed] [Google Scholar]
- 17. Karaman, M. , and O'Donnell, M. (1995). “ Synthetic aperture imaging for small scale systems,” IEEE Trans. Ultrason. Ferroelectr. Freq. Control 42(3), 429–442. 10.1109/58.384453 [DOI] [Google Scholar]
- 18. Kim, W. H. , Chang, J. M. , Kim, C. , Park, J. , Yoo, Y. , Moon, W. K. , Cho, N. , and Choi, B. I. (2012). “ Synthetic aperture imaging in breast ultrasound: A preliminary clinical study,” Acad. Radiol. 19(8), 923–929. 10.1016/j.acra.2012.04.005 [DOI] [PubMed] [Google Scholar]
- 19. Li, Y. , Yang, D.-M. , Kolios, M. C. , and Xu, Y. (2016). “ Plane-wave imaging using synthetic aperture imaging reconstruction technique with regularized singular-value decomposition (RSVD),” in Proceedings of the 2016 IEEE International Ultrasonics Symposium, pp. 10–12. [Google Scholar]
- 20. Lingvall, F. , Olofsson, T. , and Stepinski, T. (2003). “ Synthetic aperture imaging using sources with finite aperture: Deconvolution of the spatial impulse response,” J. Acoust. Soc. Am. 114(1), 225–234. 10.1121/1.1575746 [DOI] [PubMed] [Google Scholar]
- 21. Lu, J. Y. , and Greenleaf, J. F. (1992). “ Nondiffracting X waves-exact solutions to free-space scalar wave equation and their finite aperture realizations,” IEEE Trans. Ultrason. Ferroelectr. Freq. Control 39(1), 19–31. 10.1109/58.166806 [DOI] [PubMed] [Google Scholar]
- 22. Montaldo, G. , Tanter, M. , Bercoff, J. , Benech, N. , and Fink, M. (2009). “ Coherent plane-wave compounding for very high frame rate ultrasonography and transient elastography,” IEEE Trans. Ultrason. Ferroelectr. Freq. Control 56(3), 489–506. 10.1109/TUFFC.2009.1067 [DOI] [PubMed] [Google Scholar]
- 23. Nguyen, N. Q. , and Prager, R. W. (2016). “ High-resolution ultrasound imaging with unified pixel-based beamforming,” IEEE Trans. Med. Imaging 35(1), 98–108. 10.1109/TMI.2015.2456982 [DOI] [PubMed] [Google Scholar]
- 24. Nikolov, S. , and Jensen, J. (2002). “ Virtual ultrasound sources in high-resolution ultrasound imaging,” Proc. SPIE 4687, 395–405. 10.1117/12.462178 [DOI] [Google Scholar]
- 25. Rodriguez-Molares, A. , Torp, H. , Denarie, B. , and Lovstakken, L. (2015). “ The angular apodization in coherent plane-wave compounding,” IEEE Trans. Ultrason. Ferroelectr. Freq. Control 62(11), 2018–2023. 10.1109/TUFFC.2015.007183 [DOI] [PubMed] [Google Scholar]
- 26. Sheeran, P. S. , Czernuszewicz, T. J. , Martin, K. H. , and Byram, B. C. (2012). “ Binary apodization schemes for plane wave transmits,” in Proceedings of the 2012 IEEE International Ultrasonics Symposium, pp. 2145–2148. [Google Scholar]
- 27. Smith, S. W. , Wagner, R. F. , Sandrik, J. F. M. F. , and Lopez, H. (1983). “ Low contrast detectability and contrast/detail analysis in medical ultrasound,” IEEE Trans. Sonics Ultrason. 30(3), 164–173. 10.1109/T-SU.1983.31405 [DOI] [Google Scholar]
- 28. Tanter, M. , and Fink, M. (2014). “ Ultrafast imaging in biomedical ultrasound,” IEEE Trans. Ultrason. Ferroelectr. Freq. Control 61(1), 102–119. 10.1109/TUFFC.2014.2882 [DOI] [PubMed] [Google Scholar]
- 29. Thomenius, K. (1996). “ Evolution of ultrasound beamformers,” in Proceedings of the 1996 IEEE Ultrasonics Symposium, Vol. 2, pp. 1615–1622. [Google Scholar]
- 30. Udesen, J. , Gran, F. , Hansen, K. L. , Jensen, J. A. , Thomsen, C. , and Nielsen, M. B. (2008). “ High frame-rate blood vector velocity imaging using plane waves: Simulations and preliminary experiments,” IEEE Trans. Ultrason. Ferroelectr. Freq. Control 55(8), 1729–1743. 10.1109/TUFFC.2008.858 [DOI] [PubMed] [Google Scholar]
- 31. Walker, W. F. , and Trahey, G. E. (1998). “ The application of k-space in pulse echo ultrasound,” IEEE Trans. Ultrason. Ferroelectr. Freq. Control 45(3), 541–558. 10.1109/58.677599 [DOI] [PubMed] [Google Scholar]
- 32. Zemp, R. , and Insana, M. F. (2007). “ Imaging with unfocused regions of focused ultrasound beams,” J. Acoust. Soc. Am. 121(3), 1491–1498. 10.1121/1.2434247 [DOI] [PMC free article] [PubMed] [Google Scholar]


