Abstract
In ultrahigh-field MRI, such as 7 T, the signal-to-noise ratio (SNR) increases while transmit (Tx) field (B1+) can be degraded due to inhomogeneity and elevated specific absorption rate (SAR). By applying new array coil concepts to both Tx and receive (Rx) coils, the B1+ homogeneity and SNR can be improved. In this study, we developed and tested in vivo a new RF coil system for 7 T breast MRI.
An RF coil system composed of an eight-channel Tx-only array based on a tic-tac-toe design (can be combined to operate in single-Tx mode) in conjunction with an eight-channel Rx-only insert was developed. Characterizations of the B1+ field and associated SAR generated by the developed RF coil system were numerically calculated and empirically measured using an anatomically detailed breast model, phantom and human breasts. In vivo comparisons between 3 T (using standard commercial solutions) and 7 T (using the newly developed coil system) breast imaging were made.
At 7 T, about 20% B1+ inhomogeneity (standard deviation over the mean) was measured within the breast tissue for both the RF simulations and 7 T experiments. The addition of the Rx-only array enhances the SNR by a factor of about three. High-quality MR images of human breast were acquired in vivo at 7 T. For the in vivo comparisons between 3 T and 7 T, an approximately fourfold increase of SNR was measured with 7 T imaging.
The B1+ field distributions in the breast model, phantom and in vivo were in reasonable agreement. High-quality 7 T in vivo breast MRI was successfully acquired at 0.6 mm isotropic resolution using the newly developed RF coil system.
Keywords: 7 T, breast, Rx-only array, SNR, Tx-only array
1 | INTRODUCTION
The major advantage provided by high/ultrahigh-field MRI is the increase in signal-to-noise ratio (SNR), which can be used to increase the spatial resolution and/or reduce the acquisition time. However, as the static magnetic field strength increases, obstacles arise, such as the B1+ field (transverse electromagnetic (EM) field responsible for excitation) inhomogeneity caused by the relatively large sample size compared with the short in-tissue wavelength and constructive/destructive EM field interference.1 Overcoming these obstacles to take better advantage of the increased SNR has resulted in the development of multi-channel transmit (Tx)-only array combined with multi-channel receive (Rx)-only array systems.2–6
Preliminary studies have shown that B1+ field inhomogeneity can be observed even at 3 T and that these inhomogeneity artifacts can lead to an inaccuracy of breast evaluation.7–9 It has been shown that the B1+ field inhomogeneity can be alleviated using RF-shimming techniques.1,10–14 In addition, more SNR can be attained through the use of close-fitting multi-channel Rx-only arrays.6,15 In 7 T breast MRI,16–18 B1+ field inhomogeneities (typically observed in head and abdominal studies) can be less apparent due to the: (i) smaller size of the breast; and (ii) lower dielectric constant of breast tissue. Both of these facts lead the breast to have smaller electrical size. This being said, typical 7 T Tx coils used for breast MRI commonly utilize single or double surface coils producing B1+ fields that decay toward the chest wall with potential penetration issues. This need necessitates the development of new types of Tx breast coil with detailed analysis of their B1+ fields and associated specific absorption rate (SAR).
Breast MRI most likely increases the chance of early detection of breast cancer when the examination is accompanied by regular mammograms.19–21 In clinical breast MR examination, a gadolinium contrast enhancement technique is commonly used to detect abnormalities of the signal wash-in/−out pattern in the tissue.8,19,22 Homogeneous excitation is required, as the technique is based on spatial changes of the signal intensity over the entire breast. High-resolution imaging is also needed for accurate assessment and diagnosis of breast disease. For example, detection of a tumor before its diameter reaches 10 mm is one of the most important factors affecting treatment type and survival rate.7,23 T1-weighted fat-suppressed MRI is commonly acquired to differentiate the fibroglandular (FG) tissues from surrounding fat tissues in order to categorize the breast type defined by the American College of Radiology,22,24,25 as patients with dense FG breast tissues result in significant diagnostic challenges using mammograms. For such cases, both high-resolution and homogeneous fat-suppression MRI are required. In addition, fast MRI is preferable, as depiction of fine morphologic details of lesions can be observed only in early post-contrast phase, 60–120 s.7,8,19,22 Therefore, 7 T imaging with its superiority in speed and/or resolution can provide significant advantages for breast applications.15,26,27 All of these characteristics can be improved with a homogenous and multi-Rx (enhances speed and SNR) RF breast coil system.
In this study, we have developed an eight-channel Tx-only array28–31 based on a tic-tac-toe (TTT) design, and combined it with an eight-channel Rx-only array insert for breast MRI at 7 T for higher signal detectability. In order to predict the B1+ field distribution and associated SAR in the breast tissues, RF numerical simulations were carried out using the finite-difference time-domain (FDTD) method.5 The B1+ field generated by the developed RF coil system was also measured utilizing a breast phantom and in vivo. SNR and contrast-to-noise ratio (CNR) were investigated with and without the Rx array insert at 7 T as well as at 3 T under similar imaging conditions and utilizing a commercial array coil. Finally, the developed RF coil system was applied for in vivo three-dimensional (3D) high-resolution MRI of human breast.
2 | METHODS
2.1 | TTT Tx-only array and FDTD modeling
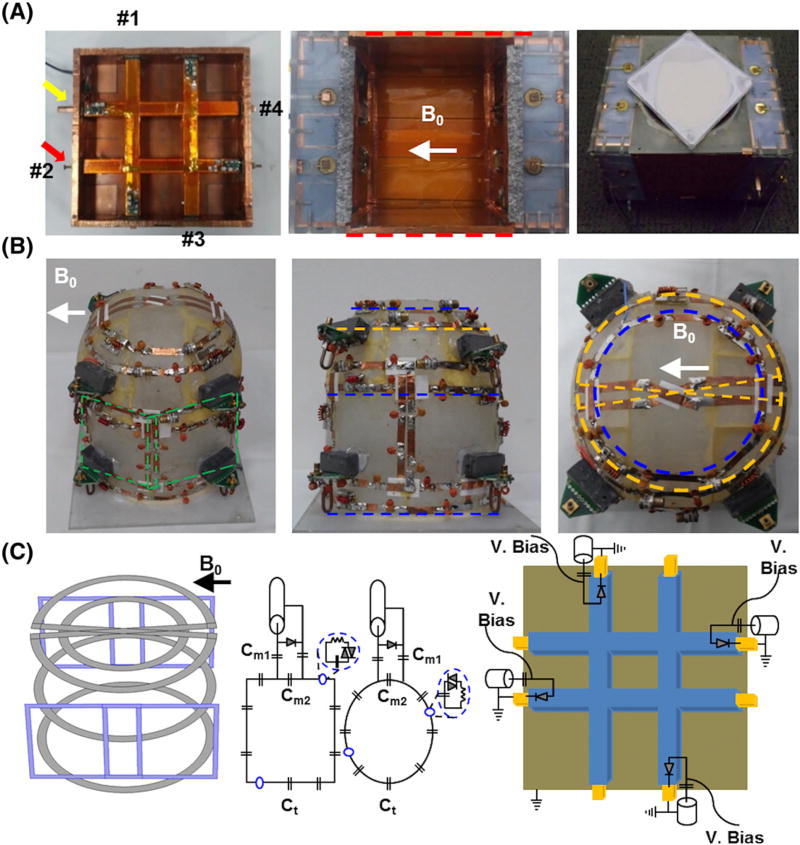
Transmission line elements (16 coaxial solid square-shaped inner copper rods inserted into 16 outer copper struts) were adapted for an RF Tx coil composed of two planar sides of 2 × 2 TTT elements. An outer copper strut is constructed on a 170 × 170 mm2 polycarbonate tube and an inner copper rod is then inserted inside a hollow square-shaped outer copper strut (Figure 1) and assembled with RF shield box dimensions of 127 × 170 × 170 mm3 (red dotted lines in Figure 1A). The outer copper strut is then connected to the RF excitation center pin and the inner rod is electrically connected to the surrounding RF shield (Figure 1C). Detuning of the Tx-only array was accomplished by applying voltage through the PIN diode that electrically connects the outer copper strut to inner copper rod during the MR signal reception (Figure 1C). Each side has four excitation ports, which allow for a total of eight independent RF excitations, and each port can be tuned and matched by pushing/pulling the copper rod inserted into the cavity of the copper strut (Figure 1A,C). This effectively changes the lengths of the associated transmission lines and therefore the resonant frequency of the RF coil. The scattering (i.e. S11, S12, and S13) matrix was measured using a vector network analyzer (HP, Santa Clara, CA) at all eight excitation ports. Considering the sample size (relatively small, 100–130 mm) and lack of real-time SAR monitoring, this study was carried out in a single-Tx system utilizing an eight-way Wilkinson power divider and constant phase shifters in order to produce a pseudo-circularly polarized (CP) mode. Through different cable lengths, four-port quadrature excitation on both sides of the Tx array was utilized. Looking in the B0 direction, the phases of the voltages were rotating clockwise with increments of 90° for one TTT side and counter-clockwise for the other TTT side. Although our experiment was performed in a single-Tx mode, a Tx-only array can be interchangeably used in a parallel Tx system for RF-shimming purposes.
FIGURE 1.
Eight-channel Tx-only array, eight-channel Rx-only array and breast phantom. A, One side of 2 × 2 TTT array showing four excitation ports (red arrow and numbers) with tuning rod (yellow arrow) and assembled Tx-only array with RF shield box (red dotted lines). Tuning and matching can be achieved by pushing/pulling the inner copper rods; this is done once on the phantom and applied for all the human studies. A, right, Complete assembly of the eight-channel Tx-only and eight-channel Rx-only array and breast phantom located at the top of the RF coil. B, Picture of eight-channel Rx-only array in three planes. Four loops were tapered orthogonal to B0; two are showing (green dotted box) and two are tapered on the opposite side of the frame. An additional four loops were tapered in the coronal plane, three loops (blue dotted lines) are located 35 mm apart and a saddle loop (yellow dotted line) was located at the bottom. C, Schematic diagram of Rx-only and Tx-only arrays. The first panel shows the 3D layout of the eight-channel Rx-only array that was tapered in the acrylic frame (first panel in B). The second and third panels show the circuit diagram of the Rx-only array. Capacitors used in the coil loop for resonance frequency tuning (Ct) varied between 8 and 12 pF, whereas capacitors used for 50 Ω matching were 64 pF at Cm1 and 12–18 pF at Cm2. The fourth panel shows Tx-only pin connections and the detuning circuits used for active detuning during signal reception
For the numerical calculations of B1+ field and SAR in the breast tissue, an in-house C++ FDTD package that incorporates true transmission line modeling for excitation and reception1,28,32 was utilized. The mesh of a Tx-only array was developed using MATLAB (MathWorks, Natick, MA, USA). Identical dimensions of the RF coil was created in the computational domain (grid matrix of 162 × 162 × 168 cells, where each cell represents (1.58 mm)3 of volume). Temporal resolution of 3 × 10⁻¹² s was used to satisfy Courant’s stability boundary condition and 32 perfectly matched layers were added on each side to prevent the artificial EM field reflections at the boundaries.33,34
A 3D six-tissue breast model (50–75% FG tissue) developed at the University of Wisconsin Madison (http://uwcem.ece.wisc.edu/phantomRepository.html) was centered in the coronal plane with respect to the RF coil, and the chest wall area was located outside of the RF coil to resemble the experimental environment in vivo. Electric and B1+ fields calculated by exciting each of the eight Tx elements were linearly superimposed in phase and amplitude. The B1+ inhomogeneity index (= standard deviation/mean) was calculated in two regions of interest (ROIs): the first (ROI1) is a tissue volume within the RF coil, and the second (ROI2) is the entire tissue volume including the chest wall region located outside of the RF coil boundaries. SAR over the entire tissue volume was calculated.
Peak SAR (W/kg) was calculated using the following equation and was determined for a 10 g pixel average:
| (1) |
where σ is the conductivity and ρ is the density of tissues in the sample. The density of the breast is determined by the tissue composition ratio of fat to connective tissue. x, y, and z represent locations in the Cartesian coordinate system.
2.2 | Eight-channel Rx-only array
An eight-channel close-fitted Rx-only array was constructed on an acrylic frame that was customized for breast MRI (Figure 1B). Four loops were tapered (first panel in Figure 1C, blue squares) in an orthogonal direction to B0 (green dotted lines in Figure 1B, only two channels are shown), while the other four loops were tapered in a parallel direction to B0 (blue and yellow dotted lines in Figure 1B). Four loops were rectangular in shape and measured 80 mm in height and 80–85 mm in width (green dotted lines in Figure 1B). Another three loops were set about 30 mm apart to minimize the mutual coupling and the eighth element was a saddle coil tapered at the bottom of the frame in order to increase the signal reception depth (yellow dotted line in Figure 1B). We manually adjusted the overlapping distance (~10 mm) to minimize the coupling of the neighboring loops, and additional preamp decoupling was applied to reduce the mutual inductance of the next neighboring and non-overlapping loops. Each loop used seven capacitors (8–12 pF, Ct in Figure 1C) to tune the resonant frequency to 297.2 MHz, and matching capacitors were 64 pF in Cm1 and 12–18 pF in Cm2, respectively (see Figure 1C). Each loop consists of two passive detuning circuits and one active detuning circuit that allows the Rx-only array to appear as an open circuit during the transmission period (see blue dotted circle and PIN diode in Figure 1C). Reflection and transmission coefficients (S11, S12) were measured using a vector network analyzer (HP). To accurately evaluate the decoupling between the Rx elements during the MRI experiment, the noise correlation matrix was measured with the RF amplifier disabled.15,35,36 In addition, we used the sum-of-squares method to combine individual Rx channel signal information.
2.3 | Imaging studies
The study followed our institutional internal review board. Five normal female healthy volunteers (33–40 years old) were recruited and scanned. All MRI studies were performed on a 7 T human scanner (Magnetom: Siemens Medical Systems, Erlangen, Germany), and one of the subjects underwent 3 T (Trio2: Siemens Medical Systems, Erlangen, Germany) imaging for SNR comparison using a body coil as a Tx and a vendor two-channel array breast coil as Rx.
A 7 T gradient recalled echo (GRE) sequence with fat suppression at varying flip angles (FAs) (10°–90° with eight steps) was used to measure the B1+ field in MRI using the breast phantom (i.e. 50% glandular and 50% adipose tissue along with 8–10 cystic masses, volume of 500 cm3 with dimensions of 120 × 100 × 90 mm3) and in vivo. In the breast phantom, the chest wall was not present, thus the B1+ field distribution was measured in the entire phantom volume. For the in vivo study, B1+ field was measured at two ROIs: the first is the tissue region within the RF coil, and the second is the entire volume including the chest wall area located outside of the RF coil enclosure. We applied a fat-suppression RF pulse during B1+ mapping acquisition since homogeneity in the FG tissue region is our primary target. Mean intensity in the fat tissue as a threshold value was measured, and the mean B1+ field distribution was measured only in the threshold non-fat tissue region.
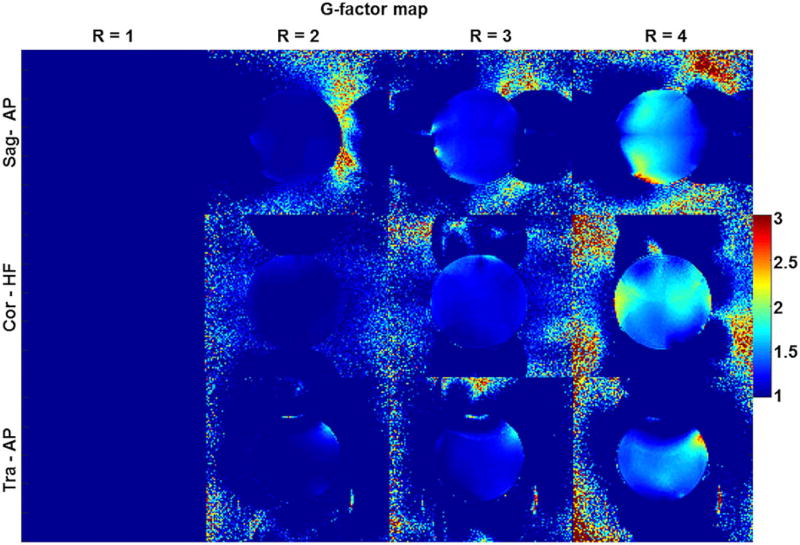
To evaluate the feasibility of parallel MRI, geometry (G) factor maps were acquired in the spherical phantom. An acceleration factor (R) from 1 to 4 was applied with 3D gradient echo in the anterior–posterior (AP) direction in the sagittal and transverse planes and in the head-feet (HF) direction in the coronal plane. Imaging parameters are TR/TE = 4/2 ms, FA = 10°, in-plane resolution =1.25 × 1.25 mm2, and slice thickness = 1.25 mm. A relatively small in-plane field of view (FOV) (160 mm × 160 mm) was used for G-map acquisition due to the high background noise. We purposely did not mask the background of the G maps to show the relative noise increase in the background. The G map was calculated using the following equation:
where SNR(x, y, z) is the SNR map of the MR images, and x, y, and z represent locations in the Cartesian coordinate system.
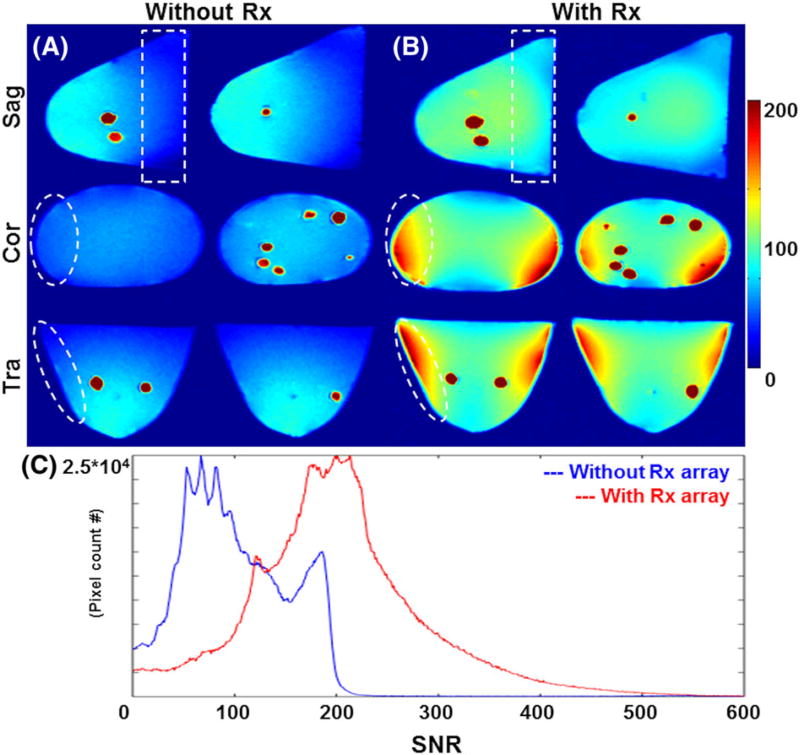
A 7 T 3D dual-echo steady state sequence was used to compare SNR with and without the Rx-only array in the breast phantom; TR/TE = 30/5 ms, FA = 25°, in-plane resolution =0.8 × 0.8 mm2, and slice thickness = 0.8 mm.
For the SNR calculation, four square regions in the coronal plane were selected to calculate the standard deviation of the noise (white dotted boxes in Figure 5A later) and SNR was then calculated by dividing the image intensity, pixel by pixel, by the noise. In addition, CNR was calculated between the FG and fat tissues in order to measure the image quality. Equations used for the SNR and CNR calculation are
where SI is the signal intensity, noise is standard deviation calculated from four corner ROIs, and f is fat tissue in the breast. x, y, and z are the pixel locations in the MR images.
FIGURE 5.
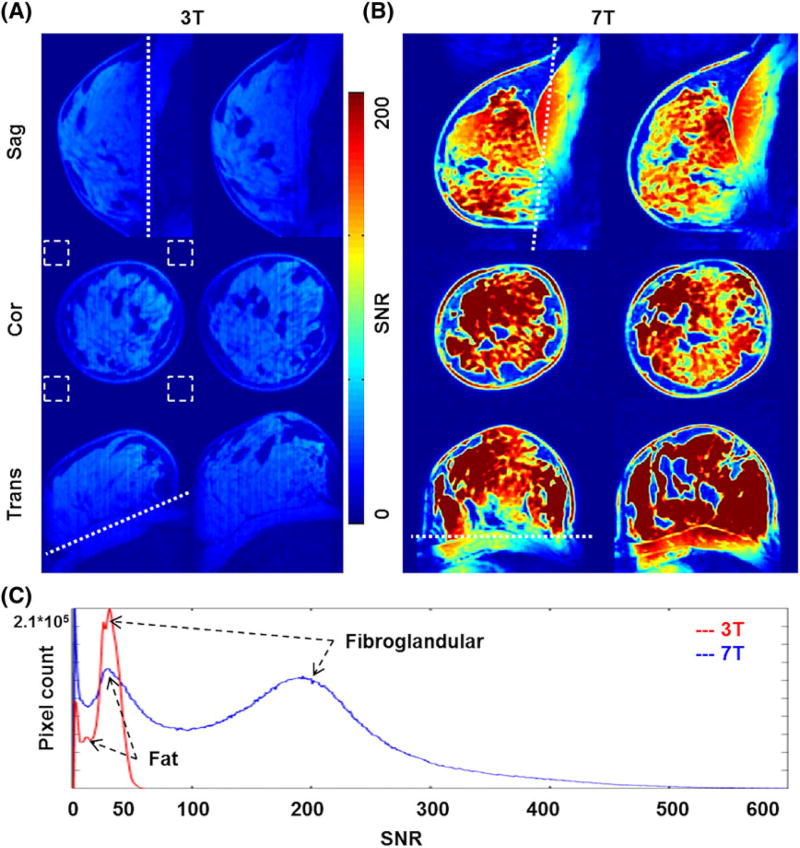
A,B, SNR comparison in 3 T versus 7 T in vivo breast MRI. A, About 50 SNR was measured in the FG tissue regions. B, A mean SNR increase of about fourfold was measured, with clear delineation of FG tissues from fat. C, Quantitative SNR distribution at 3 T and 7 T. Two peaks indicate FG and fat tissues, and an SNR contrast of about 4 was measured at 7 T whereas about 2 was measured at 3 T. Note that the background noise was calculated in the four corners of the coronal images (white dotted boxes) due to the respiratory motion artifact in the sagittal planes
In vivo 3D T1-weighted breast images were acquired at isotropic resolution (0.6 mm) using a GRE sequence with fat saturation at 7 T (with and without Rx-only array) and at 3 T. SNRs were then compared; TR/TE = 21/2.8 ms, FA = 25°, FOV = 150 × 150 mm2, matrix =256 × 256, slice thickness = 0.6 mm, and total scan time = 7 min 40 s.
3 | RESULTS
3.1 | B1+ field distribution and SAR
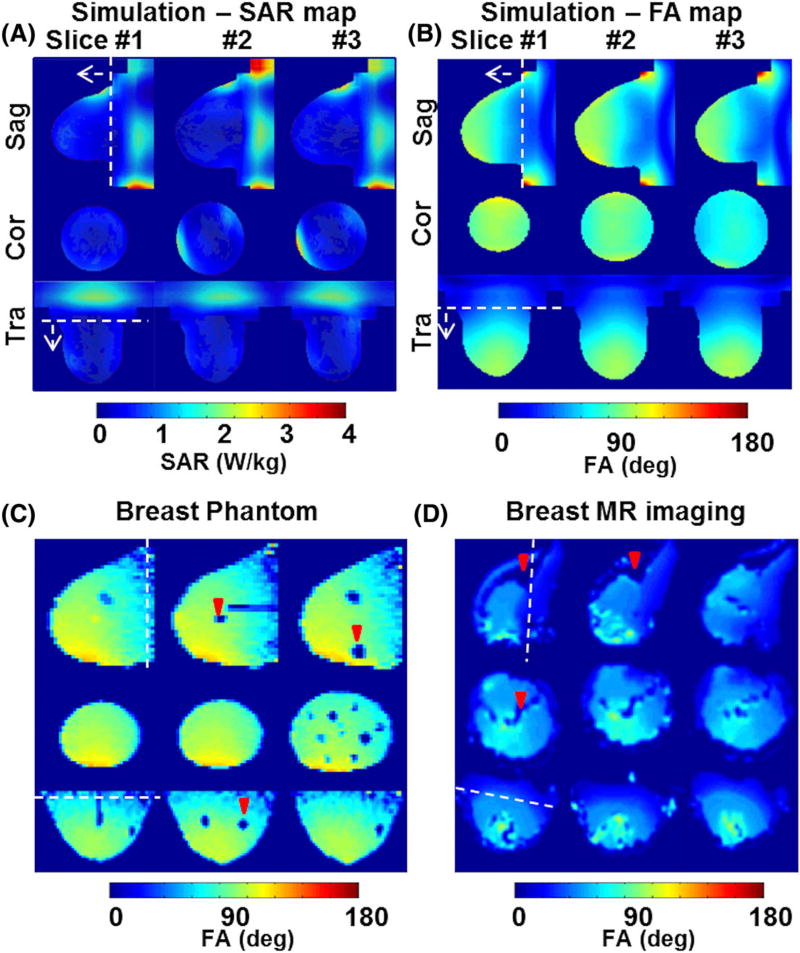
About 20% B1+ field inhomogeneity was calculated using the FDTD numerical simulations in the breast model in ROI1, whereas the inhomogeneity increased to 28% in ROI2 (Figure 2B). The B1+ field inhomogeneity experimentally measured in the entire volume of the breast phantom was about 27% (Figure 2C). Note that the B1+ inhomogeneity measured in the breast phantom was higher than that for the FDTD numerical model, mainly because of the artificially void/inflated B1+ field values in the solid masses (see red arrowheads in Figure 2C). The in vivo B1+ field inhomogeneity was about 22% in ROI1 and increased to about 31% when the chest wall was included (Figure 2D). Mean FA FDTD calculated in the breast model was about 75° (degree/total input of 100 V) and about 70° was measured in the breast phantom whereas about 60° was measured in vivo.
FIGURE 2.
FDTD calculations of SAR and B1+ field distributions in the breast model, and MRI measurements of B1+ field distributions in the breast phantom and in vivo. A, The SAR map calculated in the breast model shows peak SAR near the periphery of the breast, where high-conductivity tissues (muscle and skin) are located, and relatively high SAR was observed in the chest wall area, where muscle is the primary tissue. B, The 3D anatomically detailed breast model shows about 20% inhomogeneity within the RF coil volume where ROI1 was from the white dotted line in the direction of the arrow. ROI2 was set for the entire volume and an inhomogeneity of about 28% was calculated. C, B1+ field distribution experimentally measured for breast phantom at 7 T; cyst-like solid masses (red arrowheads) present artificial voids. D, In vivo B1+ map. Fat tissues were excluded (red arrowheads), and B1+ field inhomogeneity was measured at the same ROIs as set for the simulations. About 22% was measured at ROI1 and about 31% was measured at ROI2. Note that the white dotted line represents the coil end
Breast model peak/average SAR calculated for a continuous mean B1+ field of 2 µT within ROI1 was 2.61/0.39 W/kg/10 g tissue whereas 3.64/0.57 was calculated for a continuous mean B1+ field of 2 µT within ROI2 (Figure 2A). Peak SAR at ROI1 and ROI2 was calculated at the periphery of the breast model, where the skin and chest wall were located. The volume of the breast model that was located outside of the RF coil (included in ROI2) was mostly composed of muscle tissues, thus the average/peak SAR in ROI2 increased.
3.2 | Coupling matrix and noise correlation
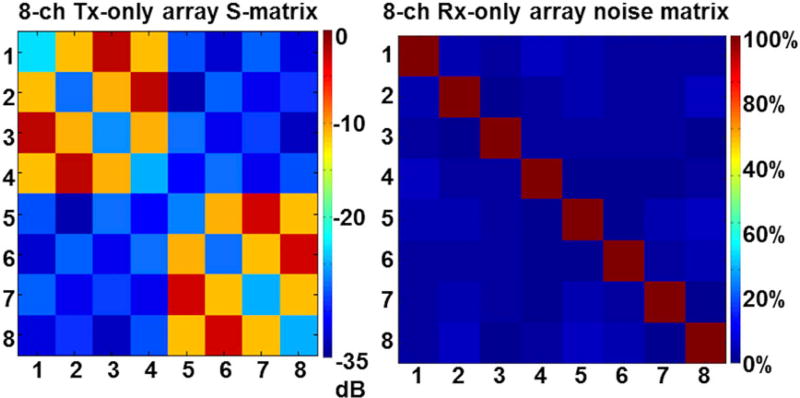
In the eight-channel Tx-only array, a mean S11 (reflection coefficient) of about −24 dB was measured, whereas S12 and S13 (transmission coefficient) values of −8 dB and −3 dB were measured. The design of the Tx-only array necessitates high coupling between opposite elements (i.e. S13), as can be seen in the S matrix shown in the first column of Figure 3.
FIGURE 3.
Tx-only array scattering (S) matrix and Rx-only array noise correlation matrix. Left, A mean reflection coefficient (S11) of about −24 dB was measured for eight excitation ports, and transmission coefficients (S12, S13) of about −8 and about −3 dB were measured using the vector network analyzer. Right, A mean noise correlation between the Rx channels of about 4 ± 3% was measured in all Rx elements
The noise correlation matrix measured in the eight-channel Rx-only array shows minimal interaction (3%) between the Rx elements, implying that good decoupling (overlapping and preamplifier) was achieved (second column in Figure 3). In addition, the measured mean S11 and S12 in all eight Rx loops were about −20 dB and about −15 dB, respectively.
3.3 | G-factor map acquisition
The mean G factor increased in all three planes as R increased, and the mean G factor calculated at R = 2, 3, and 4 in sagittal/coronal/transverse planes was 1.06/1.03/1.01, 1.21/1.17/1.13, and 1.52/1.55/1.36, respectively. The peak G factor was measured at R = 4 in each plane (sagittal/coronal/transverse) and was 2.8/2.3/2.7 (Figure 4).
FIGURE 4.
Measured G-factor map in three planes. The maps were calculated using a 3D gradient echo sequence with varying acceleration (R) factor from R = 1 to 4 in the AP direction for the sagittal and transverse planes and the HF direction in the coronal plane
3.4 | SNR/CNR comparison: 3 T versus 7 T MRI
Figure 5A,B shows SNR maps of in vivo breast MR images at 0.6 mm isotropic resolution at 3 T and 7 T, respectively. The SNR measured in the FG tissue region was about four times higher at 7 T (~50 versus ~200, as shown in Figure 5C). CNR measured with fat and FG tissues increased about twofold at 7 T (~0.35 versus 0.63, as shown in Figure 5C). The increased SNR at 7 T in conjunction with the developed RF breast coil system provides clear differentiation of the FG from fat (see Figure 5B).
3.5 | SNR comparison: with versus without Rx-only array
When the Tx-only array was used for Tx/Rx (i.e. transceiver array without Rx-only set-up), SNR decay toward the chest wall was observed, as shown in Figure 6A. With the Rx-only array set-up, an SNR increase of about threefold was measured (Figure 6C). Significant increase of SNR was measured at the phantom periphery and toward the chest wall area due to the increased Rx sensitivity (white dotted contours in Figure 6A,B). As a result of combining the eight-channel Rx-only array with the Tx-only array, significant improvement in the SNR was achieved (Figure 6).
FIGURE 6.
SNR evaluation with and without Rx-only array at 7 T using breast phantom. A, SNR map of breast phantom without Rx-only array. Noise voltage was high due to the increased volume of reception and SNR was about 80 (Tx-only array was used as Tx/Rx). B, The Tx-only array combined with the Rx-only array shows significant increase of SNR at the phantom periphery and toward the coil end, successfully reducing the noise voltage (white dotted circle and box). C, SNR distribution measured in the breast phantom. Without the Rx-only array, a mean SNR of about 80 was measured; however, when the Tx-only array was combined with the Rx-only array set-up, the SNR of the phantom increased to about 200. The breast phantom does not have different tissues, thus differentiating fat and FG was not feasible
3.6 | In vivo MRI
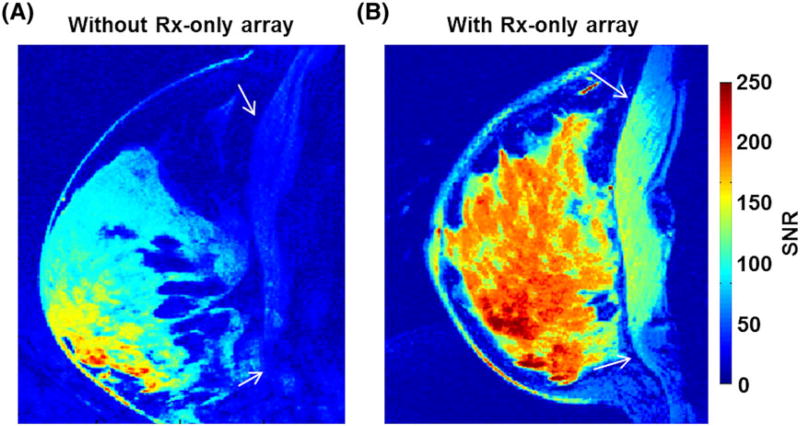
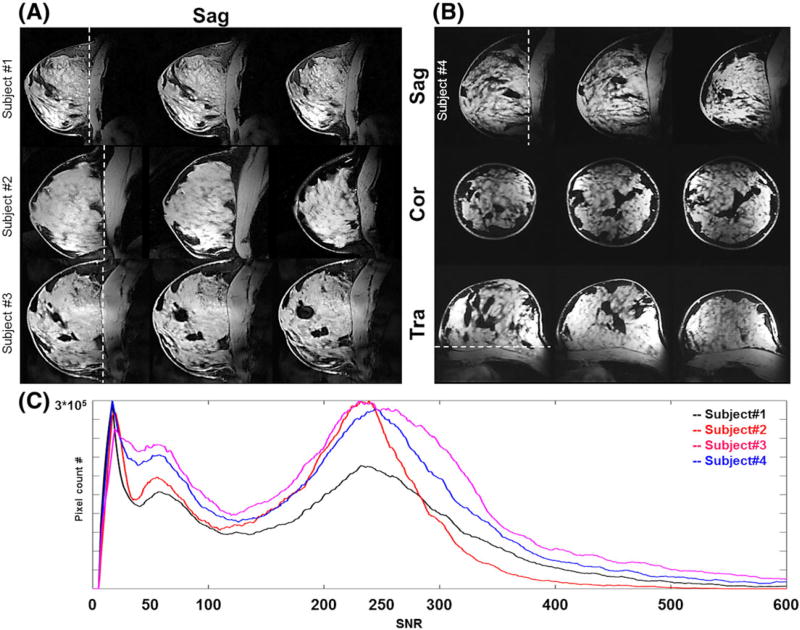
High-resolution breast MR images with 3D T1-weighted fat-suppression at 0.6 mm isotropic resolution were acquired, with clear demarcation of the FG tissues from surrounding fat tissues and chest wall (see white arrows in Figure 7) when the Tx-only array and Rx-only array were combined (Figure 7B). The breast RF coil system composed of the eight-channel Tx-only TTT array combined with the close-fitted eight-channel Rx-only array demonstrates homogenous and high-SNR breast MRI at 7 T. Figure 8 shows high-resolution (0.6 mm3) in vivo breast MRI of four subjects (one subject was involved during the sequence parameter optimization and the image quality was not appropriate to evaluate.) Fat suppression was homogeneously applied and an SNR difference of about fourfold was measured between FG tissues and fat tissues (Figure 8C). Subject 1 had the smallest breast size and the pixel count in the entire breast volume was the smallest. SNR distributions in all four subjects were similar, with the background peak observed at about 10–15. The mean SNR for FG tissues was about 220, whereas that of suppressed fat tissues was about 50.
FIGURE 7.
In vivo 7 T SNR comparison with/without Rx-only array. With the Rx-only array set-up (right) there is an SNR increase of about 2.5 and homogeneous Rx sensitivity in the breast region. Clear differentiation of breast tissues from the chest wall (white arrows) was achievable with the Rx-only array
FIGURE 8.
In vivo 7 T 0.6 mm3 isotropic T1-weighted with fat-suppression MR images. A, Sagittal view of breast MRI for three different subjects showing high SNR/contrast between the FG and fat tissues. B, Breast MR images of one subject showing three different planes: sagittal, coronal, and transverse. C, SNR distribution from four subjects showing good inter-subject reproducibility with about fourfold SNR difference between FG tissues and fat tissues.
4 | DISCUSSION
A new Tx-only and Rx-only array RF coil system for breast MRI at 7 T has been developed. Although the breast model, experimental phantom, and in vivo subjects were not identical in terms of tissue composition, dimensions, and geometry, the B1+ field variation and distribution were in relatively good agreement and showed reasonable B1+ homogeneity in the breast and improved SNR compared with 3 T. Due to the unique experimental setting for breast MRI, where the breast tissues are pulled by gravity for separation of breast tissues from the chest wall, the chest wall is located outside of the Tx-only array sweet spot and decay of the B1+ field is expected. Combination of the Tx-only array with the close-fitting Rx-only array successfully gains Rx sensitivity (although with some decrease in the B1− homogeneity) in the low-B1+ area. Peak SAR was calculated in the periphery of the breast tissues due to the presence of high-conductivity tissues (skin and muscle) (Figure 2A), and relatively high SAR was calculated in the chest wall region, where muscle tissues are located.
In vivo breast MRI acquired at 3 T and 7 T was qualitatively compared by an experienced breast radiologist with over 20 years of experience, who confirmed that, compared with 3 T, 7 T showed: (i) still homogeneous fat suppression; (ii) higher SNR; and (iii) clearer differentiation of the chest wall from the breast tissues with sufficient SNR. While SNR increased about fourfold at 7 T, CNR also increased. Figure 5C shows that CNR (FG/fat) of about 2 (~46/22) was measured at 3 T whereas about 4 (~200/44) was measured at 7 T. Moreover, SNR distribution between the subjects shown in Figure 8C demonstrated reproducibility of the developed RF array coil. In addition to SNR, quantitative CNR measurements demonstrate that breast MRI at 7 T provides high contrast between two major tissues in the breast. The measured noise matrix showed good isolations between the Rx-only array channels and the acquired G-factor map showed the feasibility of parallel imaging with the developed RF array system. However, with the limited number of Rx-only array channels, an acceleration (R) factor higher than R = 3 is not desired with our RF array. High-resolution 3D MRI of breast in vivo using the developed RF array system at 7 T detailed the anatomical structures in the breast.
Our study shows SNR of about 220 in FG tissues and about 50 for the fat tissues with fat suppression applied in T1-weighted MR images, whereas Korteweg et al. show a mean SNR of about 150 in the center of the breast at 7 T.37 Total acquisition time and sequence parameters are different, and the studies are not directly comparable since the SNR measurement was made in the proton density map. Brown et al. demonstrated the advantage of breast MRI at 7 T compared with 3 T and claimed that a fivefold SNR increase17 was observed, while our study shows about a fourfold SNR increase. Moreover, that same study17 reports that about 27% of inhomogeneity is measured in the FG tissue regions only, whereas our study shows about 22% of inhomogeneity within the entire breast tissues and about 30% when the chest wall is included. This being said, it is quite intricate, especially for breast imaging, to directly compare SNR increase and homogeneity variation between different studies.
5 | CONCLUSION
In this study, we have developed an RF array system with an eight-channel Tx-only TTT array combined with an eight-channel Rx-only array for breast MRI at 7 T. B1+ field distributions (FDTD calculated from anatomically detailed human breast model and measured in a breast phantom and in vivo) were in reasonable agreement. While the RF coils utilized were different at 3 T and 7 T, in vivo measured SNR of breast MRI at 7 T increases by about fourfold compared with 3 T and by about threefold with the Rx-only array utilized compared with the Tx-only coil utilized as a transceiver. 3D T1-weighted fat suppression in in vivo breast MRI was successfully acquired with high isotropic spatial resolution of 0.6 mm.
Acknowledgments
We thank Dr Chan Hong Moon and Dr Jeffery Barker for idea sharing and thoughtful comments.
References
- 1.Ibrahim TS, Hue Y-K, Tang L. Understanding and manipulating the RF fields at high field MRI. NMR Biomed. 2009;22(9):927–936. doi: 10.1002/nbm.1406. [DOI] [PMC free article] [PubMed] [Google Scholar]
- 2.Zhu Y. Parallel excitation with an array of transmit coils. Magn Reson Med. 2004;51(4):775–784. doi: 10.1002/mrm.20011. [DOI] [PubMed] [Google Scholar]
- 3.Zhu Y, Hardy CJ, Sodickson DK, et al. Highly parallel volumetric imaging with a 32-element RF coil array. Magn Reson Med. 2004;52(4):869–877. doi: 10.1002/mrm.20209. [DOI] [PMC free article] [PubMed] [Google Scholar]
- 4.McDougall MP, Cheshkov S, Rispoli J, Malloy C, Dimitrov I, Wright SM. Quadrature transmit coil for breast imaging at 7 tesla using forced current excitation for improved homogeneity. J Magn Reson Imaging. 2014;40(5):1165–1173. doi: 10.1002/jmri.24473. [DOI] [PMC free article] [PubMed] [Google Scholar]
- 5.Krishnamurthy N, Zhao T, Ibrahim TS. Effects of receive-only inserts on specific absorption rate, B1+ field, and Tx coil performance. J Magn Reson Imaging. 2014;39(2):475–484. doi: 10.1002/jmri.24152. [DOI] [PMC free article] [PubMed] [Google Scholar]
- 6.By S, Rispoli JV, Cheshkov S, et al. A 16-channel receive, forced current excitation dual-transmit coil for breast imaging at 7 T. PLoS One. 2014;9(11):e113969. doi: 10.1371/journal.pone.0113969. [DOI] [PMC free article] [PubMed] [Google Scholar]
- 7.Kinkel K, Hylton NM. Challenges to interpretation of breast MRI. J Magn Reson Imaging. 2001;13(6):821–829. doi: 10.1002/jmri.1117. [DOI] [PubMed] [Google Scholar]
- 8.Kuhl CK, Mielcareck P, Klaschik S, et al. Dynamic breast MR imaging: are signal intensity time course data useful for differential diagnosis of enhancing lesions? Radiology. 1999;211(1):101–110. doi: 10.1148/radiology.211.1.r99ap38101. [DOI] [PubMed] [Google Scholar]
- 9.Kuhl C. The current status of breast MR imaging part I. Choice of technique, image interpretation, diagnostic accuracy, and transfer to clinical practice. Radiology. 2007;244(2):356–378. doi: 10.1148/radiol.2442051620. [DOI] [PubMed] [Google Scholar]
- 10.Katscher U, Börnert P. Parallel RF transmission in MRI. NMR Biomed. 2006;19(3):393–400. doi: 10.1002/nbm.1049. [DOI] [PubMed] [Google Scholar]
- 11.Mao W, Smith MB, Collins CM. Exploring the limits of RF shimming for high-field MRI of the human head. Magn Reson Med. 2006;56(4):918–922. doi: 10.1002/mrm.21013. [DOI] [PMC free article] [PubMed] [Google Scholar]
- 12.van den Bergen B, Van den Berg CA, Bartels LW, Lagendijk JJ. 7 T body MRI: B1 shimming with simultaneous SAR reduction. Phys Med Biol. 2007;52(17):5429. doi: 10.1088/0031-9155/52/17/022. [DOI] [PubMed] [Google Scholar]
- 13.van den Bergen B, van den Berg CA, Klomp DW, Lagendijk JJ. SAR and power implications of different RF shimming strategies in the pelvis for 7 T MRI. J Magn Reson Imaging. 2009;30(1):194–202. doi: 10.1002/jmri.21806. [DOI] [PubMed] [Google Scholar]
- 14.Abraham R, Ibrahim TS. Proposed radiofrequency phased-array excitation scheme for homogenous and localized 7-Tesla whole-body imaging based on full-wave numerical simulations. Magn Reson Med. 2007;57(2):235–242. doi: 10.1002/mrm.21139. [DOI] [PubMed] [Google Scholar]
- 15.van de Bank BL, Voogt IJ, Italiaander M, et al. Ultra high spatial and temporal resolution breast imaging at 7 T. NMR Biomed. 2013;26(4):367–375. doi: 10.1002/nbm.2868. [DOI] [PubMed] [Google Scholar]
- 16.Umutlu L, Maderwald S, Kraff O, et al. Dynamic contrast-enhanced breast MRI at 7 Tesla utilizing a single-loop coil: a feasibility trial. Acad Radiol. 2010;17(8):1050–1056. doi: 10.1016/j.acra.2010.03.017. [DOI] [PubMed] [Google Scholar]
- 17.Brown R, Storey P, Geppert C, et al. Breast MRI at 7 Tesla with a bilateral coil and robust fat suppression. J Magn Reson Imaging. 2014;39(3):540–549. doi: 10.1002/jmri.24205. [DOI] [PMC free article] [PubMed] [Google Scholar]
- 18.van der Velden TA, Italiaander M, van der Kemp WJ, et al. Radiofrequency configuration to facilitate bilateral breast 31P MR spectroscopic imaging and high-resolution MRI at 7 Tesla. Magn Reson Med. 2015;74(6):1803–1810. doi: 10.1002/mrm.25573. [DOI] [PubMed] [Google Scholar]
- 19.Bazzocchi M, Zuiani C, Panizza P, et al. Contrast-enhanced breast MRI in patients with suspicious microcalcifications on mammography: results of a multicenter trial. Am J Roentgenol. 2006;186(6):1723–1732. doi: 10.2214/AJR.04.1898. [DOI] [PubMed] [Google Scholar]
- 20.Kriege M, Brekelmans CT, Boetes C, et al. Efficacy of MRI and mammography for breast-cancer screening in women with a familial or genetic predisposition. N Engl J Med. 2004;351(5):427–437. doi: 10.1056/NEJMoa031759. [DOI] [PubMed] [Google Scholar]
- 21.Saslow D, Boetes C, Burke W, et al. American Cancer Society guidelines for breast screening with MRI as an adjunct to mammography. CA. 2007;57(2):75–89. doi: 10.3322/canjclin.57.2.75. [DOI] [PubMed] [Google Scholar]
- 22.Kuhl CK, Schild HH. Dynamic image interpretation of MRI of the breast. J Magn Reson Imaging. 2000;12(6):965–974. doi: 10.1002/1522-2586(200012)12:6<965::aid-jmri23>3.0.co;2-1. [DOI] [PubMed] [Google Scholar]
- 23.Morris EA, Liberman L, Ballon DJ, et al. MRI of occult breast carcinoma in a high-risk population. Am J Roentgenol. 2003;181(3):619–626. doi: 10.2214/ajr.181.3.1810619. [DOI] [PubMed] [Google Scholar]
- 24.American College of Radiology. BI-RADS Committee. ACR BI-RADS Breast Imaging and Reporting Data System: Breast Imaging Atlas. American College of Radiology; Reston, VA, USA: 2003. [Google Scholar]
- 25.Kinoshita T, Yashiro N, Yoshigi J, Ihara N, Narita M. Fat necrosis of breast: a potential pitfall in breast MRI. Clin Imaging. 2002;26(4):250–253. doi: 10.1016/s0899-7071(02)00426-6. [DOI] [PubMed] [Google Scholar]
- 26.Gruber S, Pinker K, Zaric O, et al. Dynamic contrast-enhanced magnetic resonance imaging of breast tumors at 3 and 7 T: a comparison. Invest Radiol. 2014;49(5):354–362. doi: 10.1097/RLI.0000000000000034. [DOI] [PubMed] [Google Scholar]
- 27.Pinker K, Bogner W, Baltzer P, et al. Clinical application of bilateral high temporal and spatial resolution dynamic contrast-enhanced magnetic resonance imaging of the breast at 7 T. Eur Radiol. 2014;24(4):913–920. doi: 10.1007/s00330-013-3075-8. [DOI] [PubMed] [Google Scholar]
- 28.Zhao Y, Zhao T, Raval SB, et al. Dual optimization method of radiofrequency and quasistatic field simulations for reduction of eddy currents generated on 7 T radiofrequency coil shielding. Magn Reson Med. 2015;74(5):1461–1469. doi: 10.1002/mrm.25424. [DOI] [PMC free article] [PubMed] [Google Scholar]
- 29.Kim J, Zhao Y, Krishnamurthy N, Zhao T, Bae K. High temporal and spatial resolution breast MR imaging at 7 T; feasibility study using 8-to-1 channel Tx-only array combined with 8 channel Rx-only insert. Proc Int Soc Magn Reson Med. 2013 [Google Scholar]
- 30.Kim J, Krishnamurthy N, Zhao Y, Zhao T, Bae K, Ibrahim T. B1+, SAR, and temperature distributions in the breast with different tissue ratio: FDTD simulations and experimental RF field and temperature measurements at 7 T. Proc Int Soc Magn Reson Med. 2015:1799. [Google Scholar]
- 31.Kim J, Krishnamurthy N, Santini T, et al. Experimental and numerical analysis of B1+ field and SAR with a new transmit array design for 7 T breast MRI. J Magn Reson. 2016;269:55–64. doi: 10.1016/j.jmr.2016.04.012. [DOI] [PMC free article] [PubMed] [Google Scholar]
- 32.Hue Y-K, Ibrahim TS, Zhao T, Boada FE, Qian Y. A complete modeling system with experimental validation for calculating the transmit and receive fields, total power deposition, input impedance, and coupling between coil elements. Proc Int Soc Magn Reson Med. 2008:0438. [Google Scholar]
- 33.Taflove A, Hagness SC. Computational Electrodynamics: the Finite-Difference Time-Domain Method. Third. Artech; Norwood, MA: 2005. [Google Scholar]
- 34.Hand J. Modelling the interaction of electromagnetic fields (10 MHz-10 GHz) with the human body: methods and applications. Phys Med Biol. 2008;53(16):R243. doi: 10.1088/0031-9155/53/16/R01. [DOI] [PubMed] [Google Scholar]
- 35.Wiggins G, Triantafyllou C, Potthast A, Reykowski A, Nittka M, Wald L. 32-channel 3 tesla receive-only phased-array head coil with soccer-ball element geometry. Magn Reson Med. 2006;56(1):216–223. doi: 10.1002/mrm.20925. [DOI] [PubMed] [Google Scholar]
- 36.Adriany G, Van de Moortele P-F, Ritter J, et al. A geometrically adjustable 16-channel transmit/receive transmission line array for improved RF efficiency and parallel imaging performance at 7 Tesla. Magn Reson Med. 2008;59(3):590–597. doi: 10.1002/mrm.21488. [DOI] [PubMed] [Google Scholar]
- 37.Korteweg MA, Veldhuis WB, Visser F, et al. Feasibility of 7 Tesla breast magnetic resonance imaging determination of intrinsic sensitivity and high-resolution magnetic resonance imaging, diffusion-weighted imaging, and 1H-magnetic resonance spectroscopy of breast cancer patients receiving neoadjuvant therapy. Invest Radiol. 2011;46(6):370–376. doi: 10.1097/RLI.0b013e31820df706. [DOI] [PubMed] [Google Scholar]


