Abstract
We found similarities between the effects of low night temperatures (5°C–10°C) and slowly imposed water stress on photosynthesis in grapevine (Vitis vinifera L.) leaves. Exposure of plants growing outdoors to successive chilling nights caused light- and CO2-saturated photosynthetic O2 evolution to decline to zero within 5 d. Plants recovered after four warm nights. These photosynthetic responses were confirmed in potted plants, even when roots were heated. The inhibitory effects of chilling were greater after a period of illumination, probably because transpiration induced higher water deficit. Stomatal closure only accounted for part of the inhibition of photosynthesis. Fluorescence measurements showed no evidence of photoinhibition, but nonphotochemical quenching increased in stressed plants. The most characteristic response to both stresses was an increase in the ratio of electron transport to net O2 evolution, even at high external CO2 concentrations. Oxygen isotope exchange revealed that this imbalance was due to increased O2 uptake, which probably has two components: photorespiration and the Mehler reaction. Chilling- and drought-induced water stress enhanced both O2 uptake processes, and both processes maintained relatively high rates of electron flow as CO2 exchange approached zero in stressed leaves. Presumably, high electron transport associated with O2 uptake processes also maintained a high ΔpH, thus affording photoprotection.
Water stress and chilling temperatures are two environmental constraints that limit grapevine (Vitis vinifera L.) photosynthesis and distribution. The former has been shown to inhibit grapevine photosynthesis, plant growth, and fruit size and yield (Liu et al., 1978; Schultz and Matthews, 1988a, 1993; Winkel and Rambal, 1993; Greenspan et al., 1994; Delgado et al., 1995; Flexas et al., 1998, 1999; Escalona et al., 1999). There is evidence that, even at high light intensities, the effects of water stress on grapevine photosynthesis are mainly related to stomatal closure, although effects on Calvin-Benson cycle enzymes and PSII efficiency have been also reported (Correia et al., 1995; Chaumont et al., 1997; Escalona et al., 1999; Flexas et al., 1998, 1999). Low temperatures also severely limit grapevine distribution, and this crop is only sustainable between annual mean temperature isotherms of 10°C and 20°C (Jackson and Schuster, 1994). Although cool-climate wine areas such as those in the Canberra region (S.E. Australia) have an annual mean temperature of 14°C, they experience average minimum temperatures above 10°C only 4 months a year, with an annual average below 6°C. Thus, it is possible that low temperatures at night may constrain grapevine physiology at the beginning and end of the growing season.
Some similarities have been reported between the effects of water stress on photosynthesis and plant function and those caused to sensitive plants by chilling in the dark. Root function and water transport are decreased by low soil water temperatures because hydraulic resistance, stomatal conductance, and leaf transpiration are decreased (Hällgren and Öquist, 1990). Leaf water potential in grapevines decreased as a result of chilling (Báló et al., 1991), but little is known about the effects of chilling on photosynthetic metabolism in these leaves.
Photosynthesis is one of the first processes to be affected when chilling-sensitive plants are exposed to low temperatures. Even though molecular mechanisms of chilling damage are still not clear, lipid composition affecting cell membrane stability and function is thought to be the main cause (Berry and Björkman, 1980; Hällgren and Öquist, 1990; Nishida and Murata, 1996). It is necessary to distinguish the effects of chilling in light or in darkness. Chilling in darkness causes reductions in the light-saturated rate of CO2 assimilation and PSII-associated electron transport at room temperature in tomato (Hällgren and Öquist, 1990). Kingston-Smith et al. (1997) reported decreases in the CO2 assimilation rate after chilling maize leaves in low light, and Fryer et al. (1998) observed the same effects, without effects on PSII activity, in field-grown maize during periods of low temperature. Chilling in the light may impair activation of the carbon reduction cycle (Sassenrath et al., 1990; Hällgren and Öquist, 1990) and lead to photoinhibition (Öquist and Huner, 1991; Terashima et al., 1993; Jung and Steffen, 1997). Long-term exposure to combined high light and low temperatures is needed to photoinhibit grapevines; short-term exposure (less than 6 h) does not affect photochemical yields (Gamon and Pearcy, 1990; Báló et al., 1991; Chaumont et al., 1995; Chaumont et al., 1997). Increases in the ratio of electron transport to CO2 assimilation in leaves have been reported to occur under chilling conditions (Fryer et al., 1998) and under drought conditions (Flexas et al., 1998, 1999).
We compared the effects of night chilling and slowly applied water stress on photosynthesis in grapevine leaves. Night chilling followed by brief illumination led to water stress, with both stomatal and non-stomatal effects on photosynthesis. The non-stomatal responses involved increased O2 uptake relative to CO2 fixation in the light. Two components were observed: a CO2-sensitive component present both in control and stressed leaves and thought to be due to RuBP oxygenase, and a CO2-insensitive component present only in stressed leaves and sometimes accounting for about 30% of total electron flow, which may represent a Mehler reaction.
MATERIALS AND METHODS
Plant Material
Leaves from mature plants of Vitis riparia Michaux (V. lupina L.) growing in soil outdoors in a sunny environment (usual midday PPFD of 1,800 μmol photons m−2 s−1) without irrigation were examined. In addition, fully developed leaves on rootlings of three cultivars of Vitis vinifera L. (cv Chardonnay, cv Riesling, and cv Gordot) were grown in 20-L pots of soil with slow-release fertilizer inside a greenhouse during October to December, 1997, in the Research School of Biological Sciences, Canberra. The daily irradiance inside the greenhouse was about 1,200 μmol photons m−2 s−1; RH was maintained at 40% to 60%, with an average minimum temperature of 20°C and a maximum temperature of 30°C to 35°C. The plants were irrigated to field capacity three times a week.
Chilling and Water Stress Treatments
Fully expanded leaves of V. riparia were exposed to chilling night temperatures (8°C–11°C) outdoors in the first week of November, 1997. Artificial cold night treatments were done in a cold room (5°C). Potted plants of V. vinifera (as well as stems of V. riparia cut under water) were placed inside the cold room in darkness for 10 to 12 h. Leaves were sampled the following morning (cold-dark treatment, CD). Alternatively, after the cold night, plants were transferred to a shaded area (150–200 μmol photons m−2 s−1) for 30 min, then exposed to direct sunlight for 60 min before sampling (cold-light treatment, CL). An additional experiment was performed with V. vinifera cv Riesling to examine the effects of low temperature on the root system. Some pots of plants were placed inside the cold room in a water bath with a heater that maintained the soil and roots at about 30°C.
Water stress was imposed slowly in the three cultivars of V. vinifera in soil by withholding water over 10 to 12 d. Because V. riparia plants were cultivated outdoors, it was impossible to control the local soil water status. This material was thus used for drastic water stress treatments applied by allowing cut shoots to wilt at room temperature in the laboratory.
Leaf water deficit was estimated in leaf discs similar to those used for photosynthetic measurements by measuring fresh weight and the weight at full turgor after 24 h in distilled water, as follows:
 |
Photosynthetic Measurements
Three types of gas-exchange measurements were performed: In the first type, light response curves of O2 evolution at saturating CO2 were measured with a leaf-disc oxygen electrode (Hansatech, Kings Lynn, Norfolk, UK) as previously described (Walker and Osmond, 1986). After taking discs from a leaf, they were left in darkness for at least 30 min. Before starting the measurements a 10- to 15-min pretreatment at 240 μmol photons m−2 s−1 was made to allow photosynthetic induction. In the second type of measurement, light response curves of net CO2 assimilation and stomatal conductance on intact leaves in normal air were performed outdoors or in the greenhouse using an open-circuit gas-exchange system (Li-6400, LI-COR, Lincoln, NE) equipped with a halogen lamp. Response curves of gross O2 evolution, CO2 assimilation, and O2 uptake at saturating light (1,000 μmol photons m−2 s−1) were measured using leaf discs during a draw-down experiment, starting with 3% CO2 in air in a purpose-built, closed cuvette coupled to a mass spectrometer (model MM6, VG, Winsford, UK). Experiments began after injection of 18O2, as described previously (Maxwell et al., 1998).
Chlorophyll Fluorescence
Chlorophyll fluorescence was measured using a modulated system (PAM 101, Walz, Effeltrich, Germany) connected to the gas-exchange systems via a light guide to allow simultaneous measurements. Dark-adapted Fv/Fm was recorded, and ΔF/Fm′ was estimated under actinic light according to the method of Genty et al. (1989). The electron transport rate (ETR) was estimated as:
 |
assuming equal distribution of excitation between PSI and PSII (Krall and Edwards, 1992), and that leaf absorptance was the same as in a wide range of grapevines surveyed by Schultz (1996). Nonphotochemical quenching (NPQ) was calculated as:
 |
RESULTS
Effects of Low Night Temperatures in Field-Grown Plants at the Beginning of the Summer Season
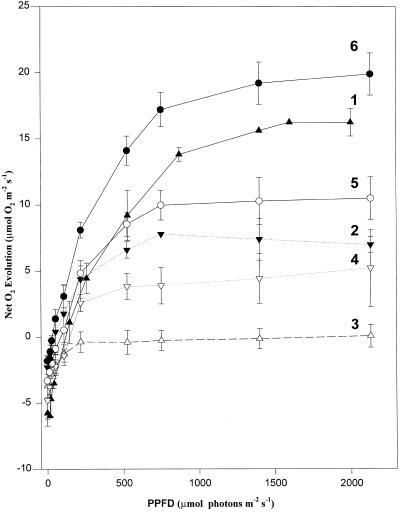
Figure 1 shows the effects of low night temperature on photosynthesis at saturating CO2 in leaf discs from V. riparia plants grown outdoors at the beginning of the summer season. The days before measurement had been hot (average temperature 25°C) and sunny, with night temperatures above 10°C. Discs were taken pre-dawn and measurements were made at 25°C on October 31 (d 1, curve 1). After 3 d with a mean temperature between 15°C and 20°C and night temperatures of 8°C to 9°C, drastic reductions in light-saturated rates were observed (d 3, curve 2). After another 2 d with a mean temperature of 18°C to 18.5°C and night temperatures of 9.5°C, the net O2 evolution was reduced to zero (d 5, curve 3). Curves 4 and 5 show recovery over the following 2 d (d 6 and 7), during which time the mean temperature was about 25°C and the minimum night temperatures were 10°C to 11°C. Total recovery of photosynthetic O2 evolution was observed after 9 d (curve 6). Quantum yield of O2 evolution was also depressed during the decrease of the light-saturated rates, but no effect was observed on the ratio Fv/Fm (Fig. 1).
Figure 1.
Light response curves of net O2 evolution at 2.5% CO2 for V. riparia leaves at the beginning of the growing season. Values are average ± ses of three to five replicates. Curve 1 was measured October 31 (after several days with mean temperatures above 25°C and minimum night temperatures above 10°C). Curve 2 was measured November 3 (mean temperature previous days, 17°C; minimum night temperature, 8°C–9°C). Curve 3 was measured November 5 (mean temperature, 18°C; minimum night temperature, 9°C). Curves 4 to 6 were measured on November 6, 7, and 9, when the mean temperature increased to 25°C and minimum night temperatures were 11°C. Values of the quantum yield of O2 evolution (average ± se): curve 1, 0.074 ± 0.009; curve 2, not measured; curve 3, 0.038 ± 0.013; curve 4, 0.038 ± 0.002; curve 5, 0.047 ± 0.013; curve 6, 0.099 ± 0.014. Corresponding values of dark-adapted Fv/Fm (average ± se) were; curve 1, 0.809 ± 0.010; curve 2, not measured; curve 3, 0.812 ± 0.005; curve 4, 0.822 ± 0.003; curve 5, 0.818 ± 0.04; and curve 6, 0.821 ± 0.003.
These effects were only detected in leaves from intact, rooted plants. When shoots of V. riparia, similar to those sampled on d 9, were cut under water and left for several days inside a cold room in darkness, the light-response curves of O2 evolution did not show any effect of chilling on the maximum rates or on the quantum yield (data not shown). Moreover, leaves on cut shoots of chilling-affected plants (curve 4, Fig. 1) recovered to some extent after 3 d inside the cold room (maximum photosynthesis increased from 5.2 ± 2.9 to 16.6 ± 1.5, and the quantum yield increased from 0.038 ± 0.002 to 0.076 ± 0.009).
Effects of Low Night Temperatures on Potted Plants with Different Root Temperatures
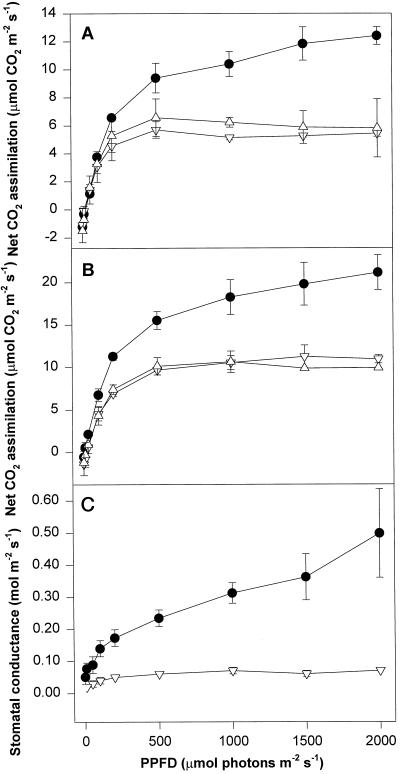
Figure 2 compares the light-response curves of control plants inside the greenhouse and plants chilled to 5°C in a cold room, and shows that CO2 assimilation in normal air (360 μmol mol−1 CO2) in the controls was about double that in cold-treated plants. No difference was observed between plants with cold roots and those with heated roots. When CO2 assimilation was measured at 900 μmol mol−1 CO2 (Fig. 2), the rates were almost double in both control and chilled plants, but compared with controls, maximum photosynthesis remained depressed in cold-treated plants. Again, no difference was observed between plants with cold roots and those with heated roots. The stomatal conductance of chilled plants was only about 10% of controls, showing that stomatal closure was an important response to cold night treatments.
Figure 2.
Net CO2 assimilation in air, 360 ppm CO2 (A), net CO2 assimilation at 900 ppm CO2 (B), and stomatal conductance in air (C) of leaves of V. vinifera cv Riesling. This figure compares controls (●), CL leaves (▵), and CL leaves with the roots heated at 30°C during the night (▿).
Effects of Night Chilling before and after Illumination and Water Stress on Photosynthesis and Leaf Water Relations: Comparison of Different Species and Cultivars
Figure 3 shows the light-response curves of net O2 evolution (corrected for dark respiration rates) of chilled leaves before and after exposure to light. Dark-chilled leaves of V. riparia behaved as control leaves, but showed a large reduction in photosynthesis after illumination for 90 min. In contrast, in the three cultivars of V. vinifera, there was a clear reduction in photosynthetic O2 evolution following CD treatments, the extent of which varied between cultivars. Further reductions in O2 evolution of chilled leaves were observed after illumination, except in cv Chardonnay, in which O2 evolution was similar under both CD and CL treatments.
Figure 3.
Light response curve of net O2 evolution (corrected for respiration rates) at 2.5% CO2 for different species and cultivars of grape. The treatments are: controls (●), CD (▴), and CL (▵).
Table I summarizes the responses of control, chilled, and water-stressed leaves from different species and cultivars. In all cases, CO2 assimilation and stomatal conductance in normal air were reduced after night chilling, as was the light-saturated rate of O2 evolution. Leaf water deficit was higher in chilled leaves than in controls. Interestingly, leaf water deficit before illumination in V. riparia was equal to that of control plants, whereas in the three cultivars of V. vinifera it was higher.
Table I.
Leaf water deficit, stomatal conductance, net CO2 assimilation at 360 ppm CO2, and light- and CO2-saturated rate of gross oxygen evolution for control leaves, chilled leaves in CL treatment, and water-stressed leaves
| Species and cv | Water Deficit
|
Stomatal Conductance
|
Net CO2 Assimilation
|
Saturated Rate of Gross O2
|
||||||||
|---|---|---|---|---|---|---|---|---|---|---|---|---|
| Cont. | Cold stress | Water stress | Cont. | Cold stress | Water stress | Cont. | Cold stress | Water stress | Cont. | Cold stress | Water stress | |
| % | mmol m−2 s−1 | μmol m−2 s−1 | μmol m−2 s−1 | |||||||||
| V. riparia | 5.2 (0.8) | 6.3 (0.8) | 16.2 (0.4) | 0.117 (0.016) | 0.037 (0.011) | 0.0001 (0.0022) | 8.3 (0.5) | 2.4 (0.8) | −1.2 (0.9) | 21.7 (1.6) | 4.0 (0.1) | 4.1 (*) |
| V. vinifera cv Gordot | 1.7 (0.6) | 16.3 (3.7) | 6.7 (1.0) | 0.111 (0.023) | 0.016 (0.006) | 0.0028 (0.0004) | 5.9 (0.8) | −0.05 (0.40) | 0.6 (0.1) | 22.1 (0.4) | 7.5 (0.1) | 11.4 (1.4) |
| V. vinifera cv Riestling | 2.9 (0.8) | 5.0 (0.4) | 8.9 (1.7) | 0.312 (0.032) | 0.070 (0.001) | 0.046 (0.010) | 10.4 (0.9) | 6.2 (0.3) | 4.2 (0.9) | 18.3 (1.5) | 10.9 (1.1) | 14.6 (0.9) |
| V. vinifera cv Chardonnay | 3.5 (1.6) | 21.3 (1.3) | 6.7 (1.0) | 0.342 (0.166) | 0.035 (0.003) | 0.0031 (0.0005) | 11.4 (2.0) | 0.5 (0.4) | 0.3 (0.1) | 27.3 (2.7) | 17.4 (1.1) | 3.8 (0.8) |
Means of three to five replicates ± se (in parentheses).
Table I shows that, irrespective of whether water stress was applied drastically (cut shoots of V. riparia) or slowly, the effects on gas exchange were similar to those of chilling. Thus, the most severe water deficit in V. riparia (16.2%) was similar to the most extreme water deficit following chilling (CL treatment of V. vinifera cv Gordot, 16.3%) and in both cases CO2 fixation in air was negative.
In V. riparia and V. vinifera cv Riesling the extent of water deficit was higher in water-stressed plants, whereas cv Gordot and cv Chardonnay showed the opposite pattern. In general, water stress caused a greater reduction in stomatal conductance, but the reduction in CO2 assimilation and O2 evolution was similar in chilled and water-stressed leaves (except O2 evolution in cv Chardonnay, which was more affected by water stress).
Relationship between ETR and Net O2 Evolution
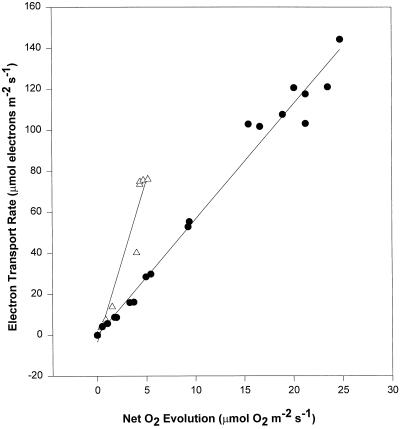
Figure 4 shows the relationship between the calculated ETR and the net O2 evolution (values corrected for respiration) in V. riparia leaves. The plots are from data gathered from plants growing outdoors in soil (Fig. 1) for the control plants (curves 1 and 6) and the more stressed plants (curve 3). Data for the other days of the same period lie between these two extremes (not shown). It is clear that ETR was reduced by less than 50% by chilling, whereas O2 evolution was reduced by about 80%. This results in a considerable change in the slope of the relationship of ETR to O2 evolution (from 5.6–15.7).
Figure 4.
The relationship between ETR and net O2 evolution (corrected for respiration rates) from curves 1 and 6 (●) and curve 3 (▵) of Figure 1. The slopes of these relationships are 5.6 for controls and 15.7 for stressed leaves. The relationships for the other curves lie between these two curves (not shown).
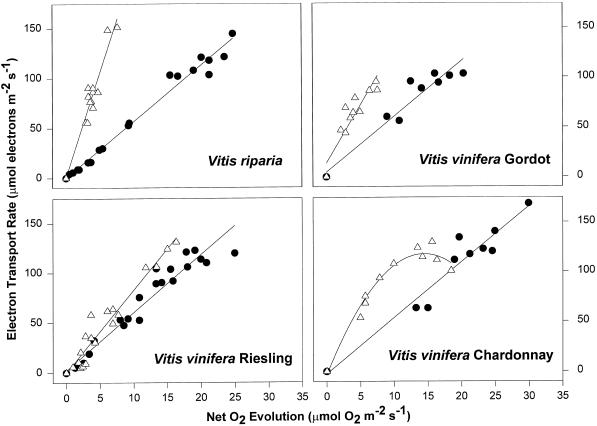
The same effect was observed in chamber-chilled leaves for all of the tested species and cultivars (Fig. 5), although the extent of the slope change was species- and cultivar-dependent. The slope of the ETR to O2 evolution relationships were similar in all controls (5.5), and close to that expected in the absence of photorespiration (about 4; Krall and Edwards, 1992). The slope increased in response to chilling in all V. vinifera cultivars, and a further increase was observed in CL treatments (the values for V. vinifera cv Chardonnay are the initial slopes of the curvilinear relationships). The slope of this relationship in the CD treatment was intermediate except for V. riparia leaves, in which it was similar to that of controls (not shown). The reductions in ETR in this experiment were relatively small, and the change in the slope was mainly due to decreases in O2 evolution. Increases in NPQ as a result of chilling were greatest at about 1,500 μmol photon m−2 s−1 in all three cultivars of V. vinifera (not shown), but at 2,000 μmol photon m−2 s−1, NPQ was similar in leaves of control and chilled plants. The increase in NPQ accounted for the decrease in the calculated ETR.
Figure 5.
The relationship between ETR and net O2 evolution (corrected for respiration rates) from data in Figure 3. The treatments shown are controls (●) and CL (▵). The data from CD treatments lie between these curves, except for V. riparia (not shown). The slopes of the relationships are: V. riparia control, 5.6; CD, 5.5; CL, 20.7; V. vinifera cv Riesling control, 5.8; CD, 6.7; CL, 8.3; V. vinifera cv Gordot control, 5.6; CD, 7.1; CL, 11.6; and V. vinifera cv Chardonnay control, 5.6; CD, 12.7; CL, 16.7.
Gross O2 Evolution, Net CO2 Assimilation, and O2 Uptake: Effects of Chilling and Water Stress
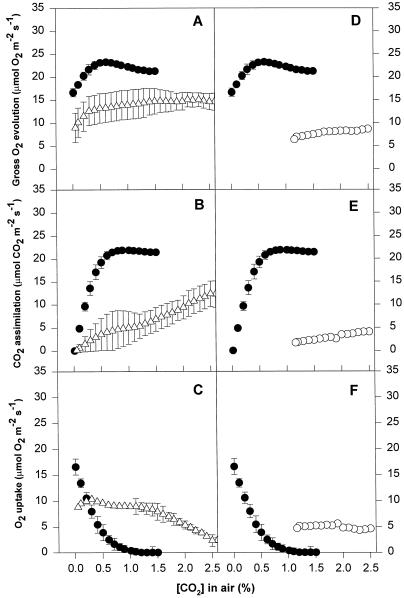
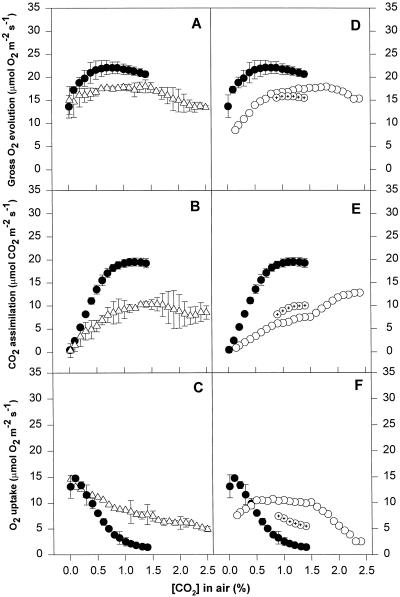
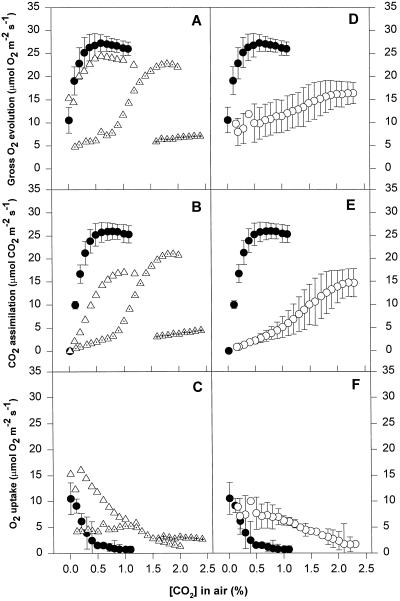
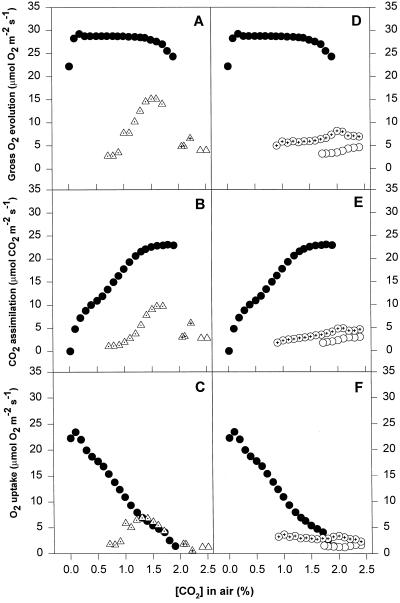
Control leaves maintained almost constant high rates of gross O2 evolution at high CO2 concentrations, from about 1.5% CO2 to about 0.5%, when rates started to decrease (in V. vinifera cv Chardonnay the rate remained constant until about 0.2% CO2). Curves of net CO2 assimilation almost matched those of gross O2 evolution at high CO2 concentrations, and O2 uptake was near zero in V. riparia and V. vinifera cv Riesling and very low (2 μmol m−2 s−1) in V. vinifera cv Chardonnay and cv Gordot. When gross O2 evolution began to decrease slightly, a drastic reduction of net CO2 assimilation was observed, which was paralleled by an increase in O2 uptake (Figs. 6, 7, and 8). Leaves of V. vinifera cv Chardonnay followed a slightly different pattern. Although high rates of gross O2 evolution were maintained through a wide range of CO2 concentrations, the net CO2 assimilation started to decrease earlier (at about 1.5% CO2) and O2 uptake increased continuously through the whole range of CO2 concentrations (Fig. 9). The O2 uptake rates in control cv Chardonnay plants were the highest measured during these experiments.
Figure 6.
Patterns of gas exchange as a function of CO2 concentration in leaf discs of V. riparia. All measurements were made at an incident PPFD of 1,000 μmol photons m−2 s−1. The CO2 concentration within the closed gas exchange system was approximately 3.0% at the beginning of the experiment and was allowed to deplete to a steady-state value as a consequence of CO2 assimilation. Values obtained during photosynthetic induction at high CO2 have been omitted. Data are provided for simultaneous gross O2 evolution, net CO2 uptake, and net O2 evolution. The controls (●) are shown for both CL experiments (left column graphs, ▵) and water-stress experiments (right column graphs, ○). Means of three replicates ± se are shown.
Figure 7.
Patterns of gas exchange as a function of CO2 concentration in leaf discs of V. vinifera cv Gordot. Replicates not considered for averaging are depicted separately and differentiated with inner symbols. Major symbols as in Figure 7. Means of three replicates ± se are shown.
Figure 8.
Patterns of gas exchange as a function of CO2 concentration in leaf discs of V. vinifera cv Riesling. Replicates not considered for averaging are depicted separately and differentiated with inner symbols. Major symbols as in Figure 7. Means of three replicates ± se are shown.
Figure 9.
Patterns of gas exchange as a function of CO2 concentration in leaf discs of V. vinifera cv Chardonnay. Replicates not considered for averaging are depicted separately and are differentiated with inner symbols. Major symbols are as in Figure 7. Means of three replicates ± se are shown.
Chilled and water-stressed leaves followed similar patterns for CO2-response curves. All of the stressed leaves showed some reduction in gross O2 evolution, even at very high CO2 concentrations (2.5%). The extent of this reduction differed depending on the species and cultivar, but was similar in chilled and water-stressed leaves. Net CO2 assimilation in chilling and water stress treatments also declined at high CO2 concentrations, to a greater extent that gross O2 evolution, which implies a high rate of O2 uptake even at these high CO2 concentrations. The rates of O2 uptake at high CO2 concentrations were between 2 and 6 μmol O2 m−2 s−1 and seemed to be CO2 independent until the CO2 concentration dropped below 2.0% (Figs. 6, 7, 8, and 9). When the CO2 concentration decreased, the rate of net CO2 assimilation decreased to zero, which was accompanied by an increase in O2 uptake. Gross O2 evolution remained almost constant or dropped, depending on the species and cultivar.
DISCUSSION
Our experiments, like those of Báló et al. (1991), show that leaves of grapevines growing outdoors and in greenhouses show large decreases in photosynthesis following night chilling and brief subsequent exposure to bright light. Similar effects have been observed in field measurements after chilling nights (H. Schultz, personal communication). Differences in these responses were evident between cultivars, but need to be explored in further experiments. It is well known that leaf transpiration is reduced in chilled leaves of chilling-sensitive plants (Hällgren and Öquist, 1990). Stomatal conductance in grapevine leaves in normal air was reduced to 10% to 25% of control values by night chilling, and this presumably accounted for part of the depression in photosynthesis. The observed reduction in stomatal conductance was associated with an increase in leaf water deficit in our experiments, especially in CL treatments, in which chilled plants were subsequently exposed to light.
Water stress is a characteristic response to chilling (Hällgren and Öquist, 1990; Boese et al., 1997), and is thought to be caused by a combination of two factors: an increase of water viscosity due to increased hydrogen bonding that reduces water flow through xylem vessels, and increased hydraulic resistance in the roots due to reduced permeability of root cells to water at low temperature (Kramer, 1983; Hällgren and Öquist, 1990). Chilling-associated inhibition of photosynthesis in grapevine was present even when roots were heated, so the response in grapevine may be dominated by hydraulic properties of the stem xylem system, as is found during water stress (Schultz and Matthews, 1988b; Salleo and Lo Gullo, 1989; Lovisolo and Schubert, 1998).
Photosynthesis in leaves of chilled grapevine plants remained far below that of controls, even when CO2 concentration was increased to 900 μmol mol−1, a concentration that should overcome stomatal limitations to CO2 diffusion in these plants (Escalona et al., 1999). Non-stomatal effects on photosynthesis were confirmed by reductions in net O2 evolution at very high CO2 concentrations (about 2%–2.5%) in O2 electrode systems and in a mass spectrometer. Such non-stomatal effects are consistent with recent results from Boese et al. (1997), who observed a reduction of photosynthesis in chilled leaves even when they were chilled inside a chamber at high CO2.
Many processes could be involved in non-stomatal reduction of photosynthesis in chilled, water-stressed leaves. Down-regulation of photochemical reactions has been considered important (Báló et al., 1991; Chaumont et al., 1995; Kingston-Smith et al., 1997; Jung and Steffen, 1997). This is unlikely in our experiments because the morning Fv/Fm was always higher than 0.8, indicating that a sustained reduction in photochemistry had little effect. Although we did not observe photoinhibition during the experiments, NPQ increased slightly in chilled leaves at intermediate light intensities and was accompanied by some reduction of ETR (calculated from fluorescence or measured as gross O2 evolution), as would be expected if photosynthetic CO2 assimilation was impaired. In grapevines, NPQ seems to be almost completely related to the xanthophyll cycle (Chaumont et al., 1995, 1997; J. Flexas and H. Medrano, unpublished results).
We conclude that chilling and water stress may have had direct effects on carbon metabolism through effects on the activity of PCR cycle, perhaps by impairing enzyme activation (Hällgren and Öquist, 1990; Sassenrath et al., 1990). Reduced RuBP regeneration with little or no effect on Rubisco activity has been observed in various water-stressed plants (Giménez et al., 1992; Gunasekera and Berkowitz, 1993; Lawlor, 1995) and grapevine (Escalona et al., 1999). Interestingly, non-stomatal effects appear after only one night of chilling, whereas prolonged water stress is necessary to observe the same effects (Giménez et al., 1992; Gunasekera and Berkowitz, 1993; Lawlor, 1995; Medrano et al., 1997).
Our experiments show reduction in ETR and gross O2 evolution in response to both chilling and drought. However, net CO2 assimilation and net O2 evolution decreased more than the rate of electron transport, which is consistent with the observed increased O2 uptake. In several experiments the relative increase in O2 uptake in response to chilling and drought persisted at high CO2 concentrations (2–6 μmol O2 m−2 s−1 at 2.5% CO2, depending on the species and cultivar) that should have eliminated RuBP oxygenase activity. It is possible that such O2 uptake was due to electron transport to O2, especially if Rubisco activity was reduced by chilling and/or water stress, as observed in other chilling-sensitive species (Hällgren and Öquist, 1990; Kingston-Smith et al., 1998). However, this criterion for distinguishing between O2 uptake via RuBP oxygenase or the Mehler reaction (Canvin et al., 1980; Gerbaud and André, 1980, 1986; Badger, 1985; Stulfauth et al., 1990; Wu et al., 1991; Osmond and Grace, 1995; Tourneux and Peltier, 1995; Biehler and Fock, 1996; Kozaki and Takeba, 1996; Park et al., 1996; Fryer et al., 1998) is uncertain in our detection system and in all of the others used thus far.
The large boundary layer in the unstirred mass spectrometer gas-exchange chamber, and the possibility of extremely tight stomatal closure in response to very high CO2 concentrations therein, could present insuperable barriers to CO2 supply to chloroplasts. That such barriers exist is indicated by the fact that CO2 fixation tended to reach a compensation point at high CO2 concentrations in the chamber. Even in control leaves, the rate of O2 uptake began to increase when the CO2 concentration was still 0.5%, when the ratio of ETR to O2 evolution remained about 5.5, which is close to the theoretical value in the absence of photorespiration. As CO2 concentrations in the chamber decreased, the rate of O2 uptake increased to values of 10 to 20 μmol O2 m−2 s−1, an increase that can be ascribed to O2 uptake by Rubisco, which supports carbon flux through the PCO-PCR cycles.
It is unlikely that mitochondrial respiration and chlororespiration contributed much to CO2-insensitive O2 uptake in the light, because these processes are known to decrease under chilling (Hällgren and Öquist, 1990) and drought (Thorneux and Peltier, 1995; Biehler and Fock, 1996). The rate of CO2-insensitive O2uptake was sometimes as high as 30% of gross O2 evolution, which is similar to that observed by Biehler and Fock (1996) in drought-stressed wheat leaves. The apparently contrary observations of Thorneux and Peltier (1995) may arise from the different methods applied to achieve water stress. Whereas we (and Biehler and Fock [1996]) dehydrated the plants slowly by withholding water, Thorneux and Peltier (1995) dehydrated the plants rapidly by passing a desiccating air flow over the leaf surface, a method that could cause short-term stomatal effects to predominate.
In summary, we show that the large depression of photosynthesis in grape leaves after intact plants have been exposed to chilling nights followed by a brief period in the light is similar to that found in water-stressed leaves. Although stomatal effects can be detected, non-stomatal effects predominate in these treatments, as well as in grapevines exposed to slowly developed water stress. Net photosynthetic CO2 assimilation may approach zero after a few days of night chilling, and under these conditions high rates of O2 uptake in the light are observed. At low CO2 concentrations O2 uptake is presumably due to Rubisco, and linked carbon flux through the PCR-PCO cycles serves as the major sink for photosynthetic electron transport. At the CO2 saturation used to demonstrate residual non-stomatal inhibition of photosynthesis, persistent O2 uptake presumably involves electron flow to O2. Provided mechanisms for the detoxification of reactive oxygen species (Asada and Nakano, 1978; Miyake et al., 1998) remain active under stress, they serve to dissipate excitation through electron transport to O2 as an alternative acceptor to CO2. Chilling- and drought-induced water stress enhance both O2 uptake processes in grape leaves, and both processes sustain relatively high rates of electron flow as CO2 exchange approaches zero in stressed leaves. These high ETRs presumably maintain high ΔpH and high NPQ, dissipating excess light as heat and affording photoprotection to the photosynthetic apparatus (Schreiber and Neubauer, 1990; Neubauer and Yamamoto, 1992; Schreiber et al., 1994; Osmond and Grace, 1995).
ACKNOWLEDGMENTS
We wish to thank Drs. M. Ball and J. Lütze for the use of the gas-exchange analyzer and other instruments. Thanks to Miguel Mansilla, (Education Department, Govern Balear) for administrative support to J.F. during his Prestación Social Sustitutoria.
Footnotes
This work was supported a grant to J.F. by Beca de Investigació Universitat de les Illes Balears, and the work was included in the framework of Comisión Interministerial de Ciencia y Tecnología Projects AGF94–0687 and AGF97–1180 of the Plan Nacional (Spain).
LITERATURE CITED
- Asada K, Nakano Y. Affinity for oxygen in photoreduction of molecular oxygen and scavenging of hydrogen peroxide in spinach chloroplasts. Photochem Photobiol. 1978;28:917–920. [Google Scholar]
- Badger MR. Photosynthetic oxygen exchange. Annu Rev Plant Physiol. 1985;36:27–53. [Google Scholar]
- Báló B, Lajkó F, Garab G. Effects of chilling on photosynthesis of grapevines. Photosynthetica. 1991;25:227–230. [Google Scholar]
- Berry J, Björkman O. Photosynthetic response and adaptation to temperature in higher plants. Annu Rev Plant Physiol. 1980;31:491–543. [Google Scholar]
- Biehler K, Fock H. Evidence for the contribution of the Mehler-peroxidase reaction in dissipating excess electrons in drought-stressed wheat. Plant Physiol. 1996;112:265–272. doi: 10.1104/pp.112.1.265. [DOI] [PMC free article] [PubMed] [Google Scholar]
- Boese SR, Wolfe DW, Melkonian JJ. Elevated CO2 mitigates chilling-induced water stress and photosynthetic reduction during chilling. Plant Cell Environ. 1997;20:625–632. [Google Scholar]
- Canvin DT, Berry JA, Badger MR, Fock H, Osmond CB. Oxygen exchange in leaves in the light. Plant Physiol. 1980;66:302–307. doi: 10.1104/pp.66.2.302. [DOI] [PMC free article] [PubMed] [Google Scholar]
- Chaumont M, Morot-Gaudry J-F, Foyer C. Effects of photoinhibitory treatment on CO2 assimilation, the quantum yield of CO2 assimilation, D1 protein, ascorbate, glutathione and xanthophyll contents and the electron transport in vine leaves. Plant Cell Environ. 1995;18:1358–1366. [Google Scholar]
- Chaumont M, Osório ML, Chaves MM, Vanacker H, Morot-Gaudry J-F, Foyer C. The absence of photoinhibition during the mid-morning depression of photosynthesis in Vitis vinifera grown in semi-arid and temperate climates. J Plant Physiol. 1997;150:743–751. [Google Scholar]
- Correia MJ, Pereira JS, Chaves MM, Rodrigues ML, Pacheco CA. ABA xylem concentrations determine maximum daily leaf conductance of field-grown Vitis vinifera L. plants. Plant Cell Environ. 1995;18:511–521. [Google Scholar]
- Delgado E, Vadell J, Aguiló F, Escalona JM, Medrano H. Irrigation and grapevine photosynthesis. In: Mathis P, editor. Photosynthesis: from Light to Biosphere. IV. Dordrecht, The Netherlands: Kluwer Academic Publishers; 1995. pp. 693–696. [Google Scholar]
- Escalona JM, Flexas J, Medrano H. Stomatal and non-stomatal limitations of photosynthesis under water stress in field-grown grapevines photosynthesis. Aust J Plant Physiol. 1999;26:421–433. [Google Scholar]
- Flexas J, Escalona JM, Medrano H. Down-regulation of photosynthesis by drought under field conditions in grapevine leaves. Aust J Plant Physiol. 1998;25:893–900. [Google Scholar]
- Flexas J, Escalona JM, Medrano H. Water stress induces different levels of photosynthesis and electron transport rate regulations in grapevines. Plant Cell Environ. 1999;22:39–48. [Google Scholar]
- Fryer MJ, Andrews JR, Oxborough K, Blowers DA, Baker NR. Relationship between CO2 assimilation, photosynthetic electron transport, and active O2 metabolism in leaves of maize in the field during periods of low temperature. Plant Physiol. 1998;116:571–580. doi: 10.1104/pp.116.2.571. [DOI] [PMC free article] [PubMed] [Google Scholar]
- Gamon JA, Pearcy RW. Photoinhibition in Vitis californica: interactive effects of sunlight, temperature and water status. Plant Cell Environ. 1990;13:267–275. [Google Scholar]
- Genty B, Briantais J-M, Baker NR. The relationship between the quantum yield of photosynthetic electron transport and quenching of chlorophyll fluorescence. Biochim Biophys Acta. 1989;990:87–92. [Google Scholar]
- Gerbaud A, André M. Effect of CO2, O2, and light on photosynthesis and photorespiration in wheat. Plant Physiol. 1980;66:1032–1036. doi: 10.1104/pp.66.6.1032. [DOI] [PMC free article] [PubMed] [Google Scholar]
- Gerbaud A, André M. An evaluation of the recycling in measurements of photorespiration. Plant Physiol. 1986;83:933–937. doi: 10.1104/pp.83.4.933. [DOI] [PMC free article] [PubMed] [Google Scholar]
- Giménez C, Mitchell VJ, Lawlor D. Regulation of photosynthesis rate of two sunflower hybrids under water stress. Plant Physiol. 1992;98:516–524. doi: 10.1104/pp.98.2.516. [DOI] [PMC free article] [PubMed] [Google Scholar]
- Greenspan MD, Shackel KA, Matthews MA. Developmental changes in the diurnal water budget of the grape berry exposed to water deficits. Plant Cell Environ. 1994;17:811–820. [Google Scholar]
- Gunasekera D, Berkowitz GA. Use of transgenic plants with Rubisco antisense DNA to evaluate the rate limitation of photosynthesis under water stress. Plant Physiol. 1993;103:629–635. doi: 10.1104/pp.103.2.629. [DOI] [PMC free article] [PubMed] [Google Scholar]
- Hällgren J-E, Öquist G. Adaptations to low temperatures. In: Alscher RG, Cumming JR, editors. Stress Responses in Plants: Adaptation and Acclimation Mechanisms. New York: Wiley-Liss; 1990. pp. 265–293. [Google Scholar]
- Jackson D, Schuster D. The Production of Grapes and Wine in Cool Climates. Wellington, New Zealand: Gypsum Press; 1994. [Google Scholar]
- Jung S, Steffen KL. Influence of photosynthetic photon flux densities before and during long-term chilling on xanthophyll cycle and chlorophyll fluorescence quenching in leaves of tomato (Lycopersicon hirsutum) Physiol Plant. 1997;100:958–966. [Google Scholar]
- Kingston-Smith AH, Harbinson J, Williams J, Foyer CH. Effect of chilling on carbon assimilation, enzyme activation, and photosynthetic electron transport in the absence of photoinhibition in maize leaves. Plant Physiol. 1997;114:1039–1046. doi: 10.1104/pp.114.3.1039. [DOI] [PMC free article] [PubMed] [Google Scholar]
- Kozaki A, Takeba G. Photorespiration protects C3 plants from photooxidation. Nature. 1996;384:557–560. [Google Scholar]
- Krall JP, Edwards GE. Relationship between photosystem II activity and CO2 fixation in leaves. Physiol Plant. 1992;86:180–187. [Google Scholar]
- Kramer PJ. Water Relations of Plants. Orlando, FL: Academic Press; 1983. [Google Scholar]
- Lawlor DW. The effects of water deficit on photosynthesis. In: Smirnoff N, editor. Environment and Plant Metabolism. Flexibility and Acclimation. Oxford: Bios Scientific Publishers; 1995. pp. 129–160. [Google Scholar]
- Liu WT, Pool R, Wenkert W, Kriedemann PE. Changes in photosynthesis, stomatal resistance and abscisic acid of Vitis labruscana through drought and irrigation cycles. Am J Enol Vitic. 1978;29:239–246. [Google Scholar]
- Lovisolo C, Schubert A. Effects of water stress on vessel size and xylem hydraulic conductivity in Vitis vinifera L. J Exp Bot. 1998;49:693–700. [Google Scholar]
- Maxwell K, Badger MR, Osmond CB. A comparison of CO2 and O2 exchange patterns and the relationship with chlorophyll fluorescence during photosynthesis in C3 and CAM plants. Aust J Plant Physiol. 1998;25:45–52. [Google Scholar]
- Medrano H, Parry MAJ, Socías X, Lawlor DW. Long term water stress inactivates Rubisco in subterranean clover. Ann Appl Biol. 1997;131:491–501. [Google Scholar]
- Miyake C, Schreiber U, Hormann H, Sano S, Asada K. The FAD-enzyme monodehydroascorbate reductase mediates photoreduction of superoxide radicals in spinach thylakoid membranes. Plant Cell Physiol. 1998;39:821–829. [Google Scholar]
- Neubauer C, Yamamoto HY. Mehler-peroxidase reaction mediates zeaxanthin formation and zeaxanthin-related chlorophyll fluorescence quenching in intact chloroplasts. Plant Physiol. 1992;99:1354–1361. doi: 10.1104/pp.99.4.1354. [DOI] [PMC free article] [PubMed] [Google Scholar]
- Nishida I, Murata N. Chilling sensitivity in plants and cyanobacteria: the crucial contribution of membrane lipids. Annu Rev Plant Physiol Mol Biol. 1996;47:541–568. doi: 10.1146/annurev.arplant.47.1.541. [DOI] [PubMed] [Google Scholar]
- Öquist G, Huner NPA. Effects of cold acclimation on the susceptibility of photosynthesis to photoinhibition in Scots pine and in winter and spring cereals: a fluorescence analysis. Funct Ecol. 1991;5:91–100. [Google Scholar]
- Osmond CB, Grace SC. Perspectives on photoinhibition and photorespiration in the field: quintessential inefficiencies of the light and dark reactions of photosynthesis? J Exp Bot. 1995;46:1415–1422. [Google Scholar]
- Park Y-I, Chow WS, Osmond CB, Anderson JM. Electron transport to oxygen mitigates against the photoinactivation of photosystem II in vivo. Photosynth Res. 1996;50:23–32. doi: 10.1007/BF00018218. [DOI] [PubMed] [Google Scholar]
- Salleo S, Lo Gullo MA. Xylem cavitation in nodes and internodes of Vitis vinifera L. plants subjected to water stress: limits of restoration of water conduction in cavitated xylem conduits. In: Kreeb KH, Richter H, Hinckley TM, editors. Structural and Functional Responses to Environmental Stresses. The Hague, The Netherlands: SPB Academic Publishing; 1989. pp. 33–42. [Google Scholar]
- Sassenrath GF, Ort DR, Portis AR., Jr Impaired reductive activation of stromal bisphosphatases in tomato leaves following high light. Arch Biochem Biophys. 1990;282:302–308. doi: 10.1016/0003-9861(90)90121-e. [DOI] [PubMed] [Google Scholar]
- Schreiber U, Bilger W, Neubauer C. Chlorophyll fluorescence as a nonintrusive indicator for rapid assessment of in vivo photosynthesis. In: Schulze E-D, Caldwell MM, editors. Ecophysiology of Photosynthesis. Berlin: Springer-Verlag; 1994. pp. 49–70. [Google Scholar]
- Schreiber U, Neubauer C. O2-dependent electron flow, membrane energisation and the mechanism of non-photochemical quenching of chlorophyll fluorescence. Photosynth Res. 1990;25:279–293. doi: 10.1007/BF00033169. [DOI] [PubMed] [Google Scholar]
- Schultz HR. Leaf absorptance of visible radiation in Vitis vinifera L.: estimates of age and shade effects with a simple field method. Sci Hortic. 1996;66:93–102. [Google Scholar]
- Schultz HR, Matthews MA. Vegetative growth distribution during water deficits in Vitis vinifera. Aust J Plant Physiol. 1988a;15:641–656. [Google Scholar]
- Schultz HR, Matthews MA. Resistance to water transport in shoots of Vitis vinifera L.: relation to growth at low water potential. Plant Physiol. 1988b;88:718–724. doi: 10.1104/pp.88.3.718. [DOI] [PMC free article] [PubMed] [Google Scholar]
- Schultz HR, Matthews MA. Growth, osmotic adjustment, and cell-wall mechanisms of expanding grape leaves during water deficits. Crop Sci. 1993;33:287–294. [Google Scholar]
- Stuhlfaulth T, Scheuermann R, Fock HP. Light energy dissipation under water stress conditions. Plant Physiol. 1990;92:1053–1061. doi: 10.1104/pp.92.4.1053. [DOI] [PMC free article] [PubMed] [Google Scholar]
- Terashima I, Funayama S, Sonoike K. The site of photoinhibition in leaves of Cucumis sativus L. at low temperatures is photosystem I, not photosystem II. Planta. 1993;193:300–306. [Google Scholar]
- Tourneux C, Peltier G. Effect of water deficit on photosynthetic oxygen exchange measured using 18O2 and mass spectrometry in Solanum tuberosum L. leaf discs. Planta. 1995;195:570–577. [Google Scholar]
- Walker DA, Osmond CB. Measurement of photosynthesis in vivo with a leaf disc electrode: correlations between light dependence of steady-state photosynthetic O2 evolution and chlorophyll a fluorescence transients. Proc R Soc Lond Ser B. 1986;227:267–280. [Google Scholar]
- Winkel T, Rambal S. Influence of water stress on grapevines growing in the field: from leaf to whole-plant response. Aust J Plant Physiol. 1993;20:143–157. [Google Scholar]
- Wu J, Neimanis S, Heber U. Photorespiration is more effective than the Mehler reaction in protecting the photosynthetic apparatus against photoinhibition. Bot Acta. 1991;104:283–291. [Google Scholar]


