

Abstract
The BAFF receptor BR3 plays key roles in B cell activation, maturation, and survival whereas the function of BR3 on T lymphocytes is less well characterized. Previous reports have demonstrated that BR3 co-stimulates human T cell activation in vitro in the presence of high non-physiologic levels of plate-bound BAFF. Here, relying on the soluble and membrane-bound BAFF expressed by T cells themselves, we investigated the function of BR3 on activated primary CD4+ and CD8+ T lymphocytes using a BR3-specific neutralization antibody and shRNA gene down-modulation. Interestingly, the anti-BR3 blocking antibody resulted in significant augmentation of CD25 and IFN-γ expression by both subsets, as did shRNA-mediated down-modulation of BR3. In addition, granzyme B expression was substantially elevated in anti-BR3 treated and BR3-silenced T cells. Anti-BR3 blockade increased the expression of CD25 on cytolytic CRTAM+ T cells. Importantly, anti-BR3 significantly enhanced redirected killing of P-815 cells by both CD4+ and CD8+ cytotoxic T cells (CTLs). Furthermore, anti-BR3 augmented CD4+ T cell mediated killing of class II+ melanoma cell line A375 and cervical cancer cell line HeLa in vitro, increasing the level of granzyme B activity as measured by PARP-1 cleavage and active caspase 3. Together, our data indicate that BR3 neutralization increases the activation and cytolytic function of CD4+ and CD8+ CTLs. Our findings provide a novel strategy for ex vivo T cell activation applicable to T cell immunotherapy platforms such as TIL or CAR-T cell therapeutics.
Introduction
BR3 (BAFF-R) is a member of the TNF-receptor family known for its essential role in B lymphocyte activation, maturation, and survival. BAFF (THANK, TALL-1) is the sole ligand for BR3, and together with its sister ligand APRIL binds TNF-receptors TACI and BCMA1–4. Increases in BAFF expression perturb the homeostatic balance of B lymphocytes and are strongly associated with autoimmunity and antibody-mediated transplant rejection2,5–7. In addition, high BAFF levels in bone marrow have been linked to B lymphocytic malignancies8.
Compared to the extensive studies of the function of BR3 on B cells, its function(s) on T cells are less well defined. It has been demonstrated that human CD4+ and CD8+ T cells express BR3 in resting and activated states4,9–12. In several reports, human CD4+ TH cells stimulated with anti-CD3 in the presence of high non-physiologic concentrations of plate-bound BAFF displayed augmented activation and proliferation11–13. However, in the presence of more physiologic levels of BAFF, the role of BR3 in human T cell activation remains unclear. In addition, there are no detailed reports of the actual function of BR3 on human CTLs.
Many receptors within the TNF-receptor family such as 4-1BB (CD137), OX40 (CD134), and GITR co-stimulate CD4+ and CD8+ T cell activation14,15. These, along with other TNF-R family members, have been shown to play a significant role in augmenting T cell activation for cancer immunotherapies. For example, the signaling domain of 4-1BB is included in many CAR-T cell constructs to enhance the activation of transfected T cells while GITR and OX40 specific agonists have been applied in vivo as co-stimulatory agents14–18. Curiously, studies of receptors within the BAFF/APRIL system have not yet been described in the context of T cell co-activation for cancer immunotherapy.
In this study we investigated the role of BR3 in the activation of human effector T cells. In our system, activated T cells were the sole source of the BAFF ligand and as such BAFF levels were at low pg/ml concentrations. We worked with one of the few commercially available human BR3 blocking antibodies to determine the degree to which BR3 was specifically involved in T cell co-stimulation in vitro. In addition, we down-modulated BR3 in primary human T cells via shRNA gene silencing. Remarkably, results of both methodologies suggest that BR3 inhibition increases the activation of both CD4+ and CD8+ CTLs. Importantly, anti-BR3 mediated neutralization augments the cytolytic function of CD4+ CTLs by promoting the apoptosis of tumor cell lines in vitro.
Materials and Methods
Cell Culture and Purification
Primary human T cells were obtained from leukopheresis products purchased from AllCells, LLC (Alameda, CA) or Key Biologics, LLC (Memphis, TN). Upon arrival, PBLs were isolated via ficoll separation and viably frozen19. Thawed PBLs were subject to T cell subset purification by magnetic bead sorting.
For purification, CD4 or CD8 specific beads from Miltenyi Biotec, Inc. (San Diego, CA) were used according to manufacturer protocol. An AutoMacs sorter (Miltenyi Biotec) was used for bead selection. CD4 and CD8 T cell populations were typically 90–95% pure. All T cell assays were performed in complete RPMI containing 10% FBS, glutamine, HEPES, Na-Pyruvate, NEAA, and Pen/Strep.
The human melanoma line A375 and cervical cancer cell line HeLa were purchased from ATCC (Manassas, VA). A375 and HeLa cells were expanded in complete RPMI containing 10% FBS. P-815 mastocytoma cells were also purchased from ATCC and grown in complete RPMI containing 10% FBS.
Flow Cytometry
All flow cytometry experiments were run on an Accuri C6 (BD Biosciences, Inc.) flow cytometer. Antibodies used were as follows: anti-BR3 PE, clone 11C1, BD Biosciences; anti-TACI APC, clone 165004, and anti-BCMA APC, goat pAb FAB193A, both from RnD Systems; anti-CD25 FITC-Violet and APC, clone 3H3, Miltenyi Biotec; anti-CD69 FITC, clone FN50, eBioscience; anti-IFN-γ APC, clone B27, BD Biosciences; anti-Granzyme B PE, clone GB11, BD Biosciences; anti-CRTAM PE, clone Cr24.1, Biolegend, Inc; anti-BAFF APC, clone 1D6, BD Biosciences; anti-BCMA APC, pAb FAB193A, RnD Systems, Inc; anti-cleaved PARP (Asp214) PE, clone XF21-852, BD Biosciences; anti-active Caspase 3 FITC, clone C92-605, BD Biosciences. For intracellular staining of IFN-γ, cells stimulated with plate-bound anti-CD3/CD28 for 12 hours were cultured in the presence of Brefeldin A for another 4-6 hours. Cells were then fixed and permeabilized using reagents from RnD Systems (FC004 Fixation Buffer, FC005 Permeabilization Buffer) according to manufacturer’s instructions. Analyses were performed using CFlowPlus (BD Biosciences) and/or FlowJo (TreeStar, Inc.) software.
Anti-BR3 Neutralization Assays
BAFF receptor blocking antibodies anti-BR3 (cat# AF1162), anti-TACI (cat# AF174), and anti-BCMA (cat# AF193), were purchased from RnD Systems, Inc (Minneapolis, MN). All three are goat polyclonal antibodies. The goat IgG isotype control (cat# AB-108-C) was also purchased from RnD Systems, Inc. All were received as lyophilized products and resuspended in PBS at the recommended concentrations, aliquoted, and frozen according to manufacturer’s instructions.
For blocking assays, CD4 and CD8 T cell subsets were bead-selected as described above and suspended in complete RPMI (see above) at 1×10e6/ml. Cells were pre-incubated with each neutralizing antibody or normal goat IgG control (cat# AB-108-C) at 10 ug/ml for 30 minutes at 25°C. 2×10e5 cells/well were added to 96-well flat bottom tissue culture treated plates; 4×10e5/ml were added to 48-well plates. Plates were pre-coated with 1ug/ml anti-CD3ε (clone UCHT1, RnD Systems, Inc.) and 0.2ug/ml anti-CD28 (clone 37407, RnD Systems, Inc.) at 25°C overnight with two subsequent PBS washes and a 30 minute block with undiluted FBS. T cells were activated and incubated for 21-24 hours in a 37°C incubator at 5% CO2 after which cells were gently harvested and supernatants collected and stored at −20°C for future ELISA analysis.
BR3 shRNA Down-Modulation
Three shRNA plasmid constructs specific for human BAFF-R were purchased from Dharmacon, Inc. including the GIPZ shRNA control plasmid. 1-2ug of each plasmid was introduced in to 4-7×10e6 CD4 or CD8 T cells using Amaxa-based nucleofection. Amaxa kits specific for human T cell transfection were purchased from Lonza, Inc. Program V-24 was used for electroporation according to manufacturer’s instructions after which cells were rested for 5-6 hours in 12-well plates containing pre-warmed complete RPMI. Cells were then gently harvested and added at 1×10e6 cells/well to 12-well plates pre-coated with anti-CD3/CD28 (1ug/ml and 0.2ug/ml, respectively, as above). Transfected T cells were activated for 21-24 hours. Cells were then harvested and analyzed for BR3, CD25, Granzyme B, and IFN-γ as described above. Sequences for shRNA are as follows: (p685) 334685 mature anti-sense sequence: GCGGCTGCAGCGCCGTCCT. (p835) 404835 anti-sense sequence: GGTCTGTAGTGTCTGTGCT.
Cytotoxicity Assays
Redirected Cytotoxicity Assay
CD4+ and CD8+ cells from Donor 1 were purified and suspended in complete RPMI media containing 3% FBS. P-815 mastocytoma cells were also suspended in complete RPMI with 3% FBS. Anti-huCD3ε (clone UCHT1, RnD Systems, Inc.) was added at 10 ug/ml to P-815 cells. T cells were incubated with goat IgG or anti-BR3 at 20ug/ml for 30 minutes before co-culture. 100,000 T cells were co-cultured with P-815 cells at a 20-1 ratio at 100ul/well in quadruplicate wells. The final concentration of anti-CD3 was 5ug/ml. The final concentration of IgG/anti-BR3 was 10 ug/ml. P-815 cells alone served as a background lysis control while SDS was added to P-815 cells for the total lysis control. T cells without P-815 cells also served as controls. After four hours of incubation, supernatants were analyzed for levels of LDH using the Cyto96 Kit (Promega Corporation, Inc.) according to manufacturer’s instructions. Absorbance was read after a 30 minute incubation period with substrate. Percent lysis was calculated according to manufacturer’s protocol. Data represent five separate experiments.
Cleaved PARP/Caspase 3 Assay
Granzyme B-mediated killing was analyzed by flow cytometry as previously described20–22. Briefly, CD4+ T cells were purified from Donor 1 and Donor 2 via bead selection as above. Tumor cell lines were labeled with CT-Red (Invitrogen, Inc.) according to manufacturer’s instructions. 4×10e5 CD4+ cells at 1×10e6/ml were incubated with 10 ug/ml goat IgG or anti-BR3 for 30 minutes before adding them to wells of a 48-well plate pre-coated with anti-CD3/CD28 as above. Labeled tumor cells were then added at a 25:1 T cell: tumor cell ratio for 18 hours. Cells were harvested, and intracellular flow cytometry was performed using fixation and permeabilization buffers from RnD Systems, Inc. Cells were stained with anti-cleaved PARP PE (BD Biosciences, Inc.) and anti-active caspase 3 FITC, gating on the CT-RED+ tumor cells. Cells were analyzed on C6 and FlowJo software for percent cleaved PARP and active caspase 3 positive cells.
Semi-Quantitative PCR
RNA was isolated from activated T cell subsets treated with or without anti-BR3 for 21-24 hours. Total mRNA was isolated using an RNA Easy kit (Qiagen, Inc.). cDNA was generated using the Verso cDNA Synthesis kit (Thermo Dynamics, Inc.). All primers used to amplify GAPDH, CD25, BAFF, BCMA, BR3, CD69, IFN-γ, IL-2, granzyme B, and perforin were Quantitect Primers from Qiagen, Inc. A SYBR Green-based PCR kit (Applied Biosystems, Inc.) was used to amplify cDNA on a StepOnePlus thermocycler according to previously established protocols.
ELISA
Tissue culture supernatants were harvested after 21-24 hours from assays noted above and frozen at −20°C. Human IFN-γ concentrations in culture supernatants were measured using an ELISA kit from Thermo-Pierce, Inc. Human GranzymeB and BAFF were measured using ELISA (DuoSet) kits from RnD Systems, Inc. Absorbance was read at 450nm on an Epoch microplate reader from BioTek, Inc.
Statistical Analysis
Statistics were performed using GraphPad Prism version 6.0 for Windows OS (GraphPad Software, San Diego, CA). We reported data as mean ± standard error of the mean (SEM). Two-tailed paired t-tests were performed when comparing two groups.
Results
BR3 and BAFF Expression by Resting and Activated T cells
We began our analysis by examining BR3, BCMA, and TACI expression on T cells isolated from five healthy blood donors. Bead-purified CD4+ and CD8+ cells were rested or activated using plate-bound CD3/CD28 specific antibodies for 24 hours. BR3 was expressed on both resting and activated T cell subsets, with significant increases on stimulated T cells (Figure 1A). BCMA was expressed on both resting and activated T cell subsets, albeit lower than BR3 on activated T cells, averaging 6+/−2% (representative overlays for CD8+ T cells, Figure 1B). Semi-quantitative PCR of all three BAFF receptors revealed relatively equal mRNA expression of BR3 and BCMA in activated CD4+ and CD8+ T cells (Figure 1B) whereas TACI gene expression was not observed (data not shown). Cell surface BAFF was detected equally on T cells rested and activated for 24 hours (representative overlay, Figure 1C). Soluble BAFF was detected at 20+/−10 pg/ml in activated T cell supernatants but was undetectable for resting cells (data not shown).
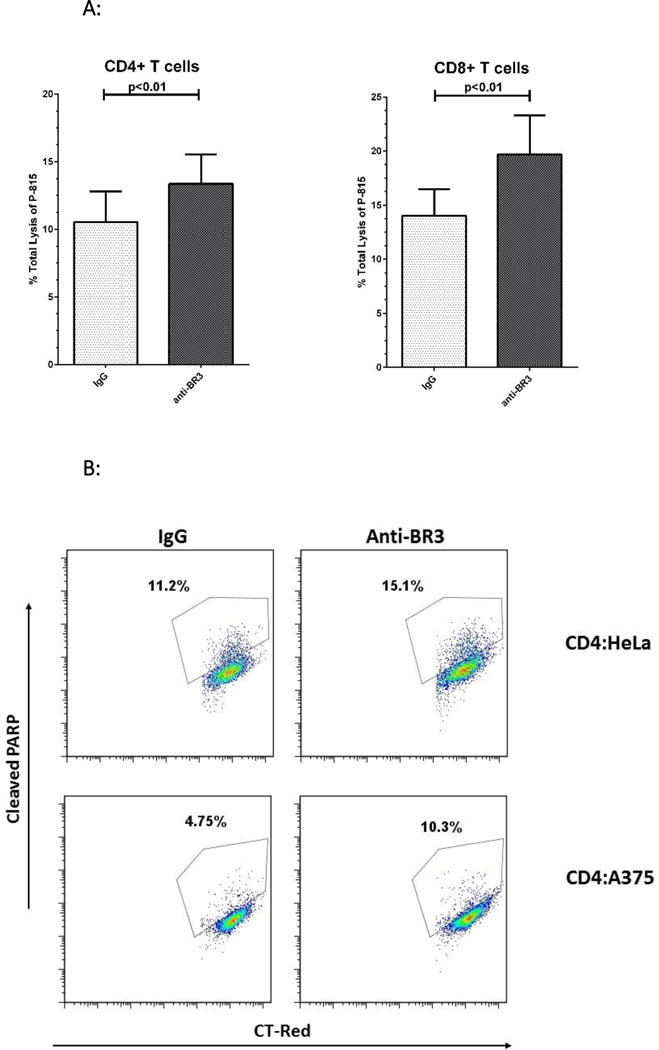
Figure 1. Analysis of BR3 and BAFF on CD4+ and CD8+ Resting and Activated T cells.
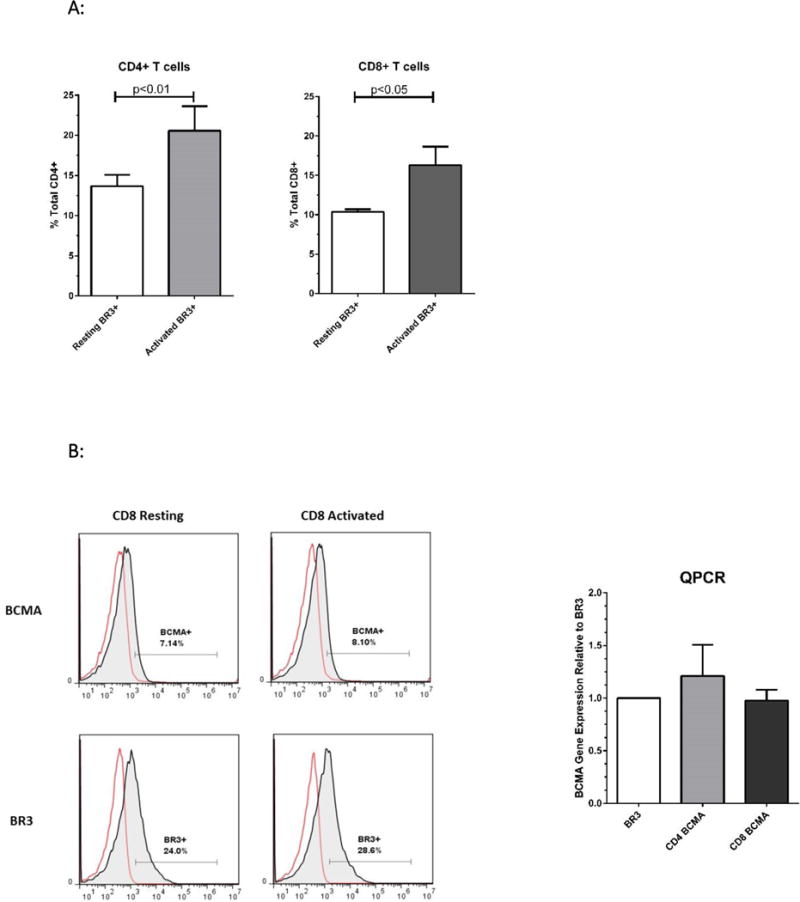
(A) Flow cytometric analysis of BR3 on purified human T cell subsets isolated from five different healthy donors. Bead-purified CD4+ and CD8+ cells were rested or activated with anti-CD3/CD28 for 24 hours. BR3 expression was analyzed on live T cells using anti-BR3 clone 1C11. Shown are the percent BR3+ cells within the live gate of total CD4+ or CD8+ T cells. Differences in percent BR3+ cells were significant between resting versus activated populations (p=0.009 and p=0.04 for CD4+ and CD8+ T cells, respectively) (B) Left: Representative overlays for BCMA+ versus BR3+ resting and activated CD8+ T cells. Right: Relative mRNA expression of BR3 versus BCMA in activated CD4+ and CD8+ cells as gauged by semi-quantitative PCR. (C) Left: Representative overlays for BAFF+ resting and activated CD4+ and CD8+ T cells (shaded histograms). Ig stained controls are not shaded. (D) Representative dot plots of CD25 expression on activated BR3+ versus BR3- T cells.
CD25 is an established marker of T cell activation and a seminal marker for CD4+ Tregs23,24. In our system, 10-40% of T cells expressed CD25 at 24 hours of activation. Less than 1% of resting CD4+ T cells were BR3+CD25+ (see Figure 1D). On average, 30-50% of activated CD4+BR3+ T cells and 20-30% of activated CD8+BR3+ cells expressed CD25 (see representative dot plot, Figure 1D).
Anti-BR3 Neutralization Increases CD25 Expression
We hypothesized that if BR3 co-stimulated human T lymphocytes, as has been suggested by other studies11–13, then BR3 neutralization should decrease T cell activation and therefore CD25 expression. Since BCMA was also expressed on human T cells, the specific function of BR3 could not be determined using BAFF competitors such as anti-Blys (Belimumab) or TACI-Fc (Atacicept). As such, we used a BR3 neutralization antibody, a goat polyclonal antibody from RnD Systems, Inc. Goat IgG as well as anti-TACI and anti-BCMA goat polyclonal blocking antibodies (also from RnD Systems) served as controls.
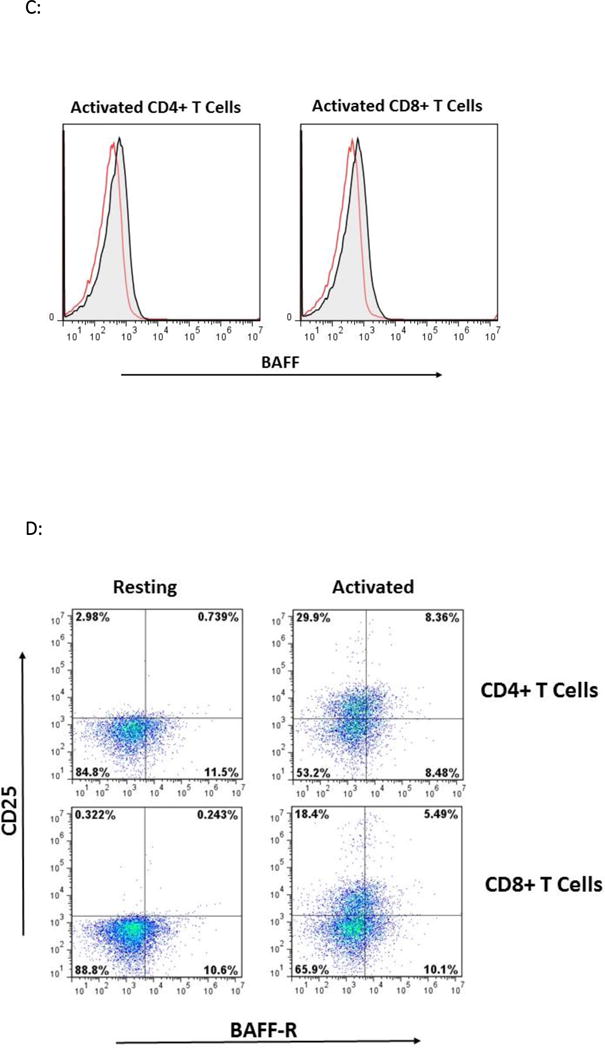
CD4+ and CD8+ T cells were pre-incubated with each neutralization antibody or goat IgG for 30 minutes before stimulating with plate-bound anti-CD3/CD28. After 24 hours, CD25 expression was measured by flow cytometry and semi-quantitative PCR. Flow analysis revealed that anti-BR3 blockade significantly increased the percentage of CD25+ cells (p<0.05, Figure 2A) as well as the mean channel fluorescence (MCF) of CD25 (p<0.05, Figure 2B) for both CD4+ and CD8+ subsets. The goat IgG control, anti-TACI, and anti-BCMA had no significant effect on CD25 expression. CD25 mRNA expression increased 1.5-6 fold for CD4+ cells, and 2-3 fold for CD8+ cells but only increases in CD25 expression of CD8+ cells were statistically significant (p<0.05, Figure 2C). The MCF of CD69 as well as CD69 mRNA expression remained unchanged with BR3 blockade (data not shown) suggesting that BR3 neutralization increased selective components of T cell activation.
Figure 2. CD25 Expression Increases with Anti-BR3 Blockade.

(A) Flow cytometric analysis of CD25 expression. Purified CD4+ and CD8+ T cells were incubated with goat polyclonal BR3, TACI, or BCMA specific neutralization antibodies or the goat IgG control and activated with plate-bound CD3/CD28 specific stimulatory antibodies for 24 hours. Anti-CD25 APC was used to detect CD25 expression which is gauged by percent positive CD25 cells. Five separate T cell donors were analyzed. (B) Flow cytometric analysis as for (A) measured by mean channel fluorescence of CD25. (C) Relative gene expression of CD25 using semi-quantitative PCR. Purified T cells from three healthy donors were incubated with either the anti-BR3 neutralization antibody or the goat IgG control and activated for 24 hours.
BR3 Antibody Blockade Increases Expression of IFN-γ and Granzyme B
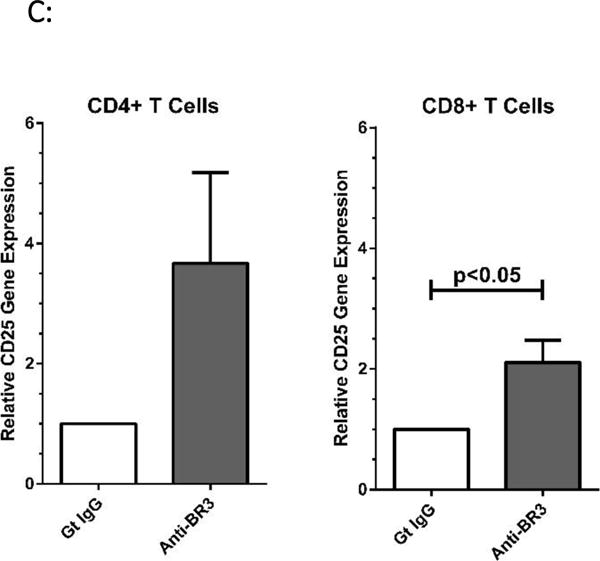
We next examined whether anti-BR3 had an effect on IFN-γ, a key cytokine expressed at the onset of T cell activation and integral to cancer biology25,26. As above, purified T cells were incubated with each of the neutralization antibodies or IgG and then stimulated with anti-CD3/CD28. Compared to the IgG control, anti-BR3 treatment increased IFN-γ concentrations 2-5 fold in culture supernatants, as measured by ELISA, and was statistically significant for both CD4+ and CD8+ T cell subsets (Figure 3A, p<0.001 and p<0.01 for CD8+ than CD4+ cells, respectively). Anti-BCMA and anti-TACI did not increase IFN-γ expression. Semi-quantitative PCR analysis comparing IFN-γ mRNA expression in IgG versus anti-BR3 treated T cells demonstrated 2-10 fold and 2-6 fold increases in anti-BR3 treated CD4+ and CD8+ cells, respectively (Figure 3B).
Figure 3. IFN-γ and Granzyme B Expression Increases with Anti-BR3 Blockade.
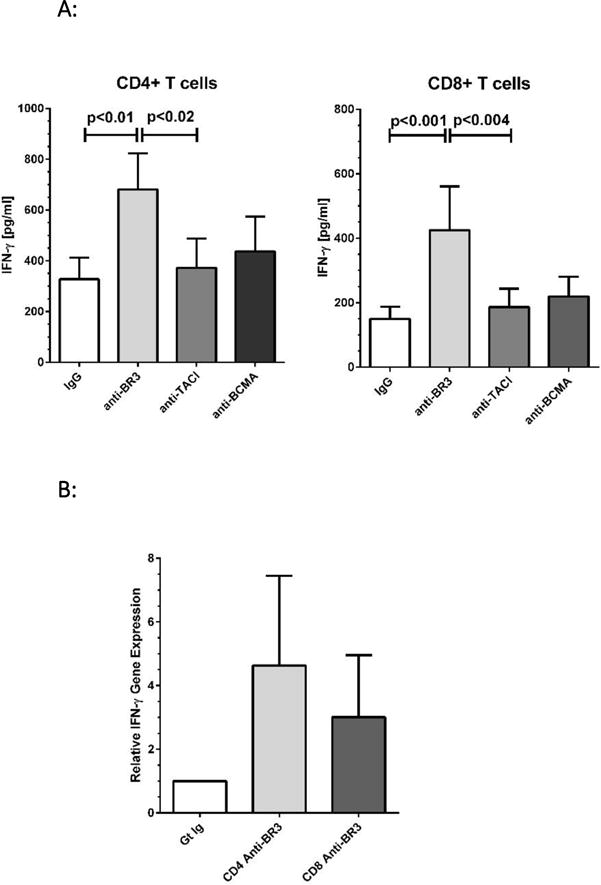
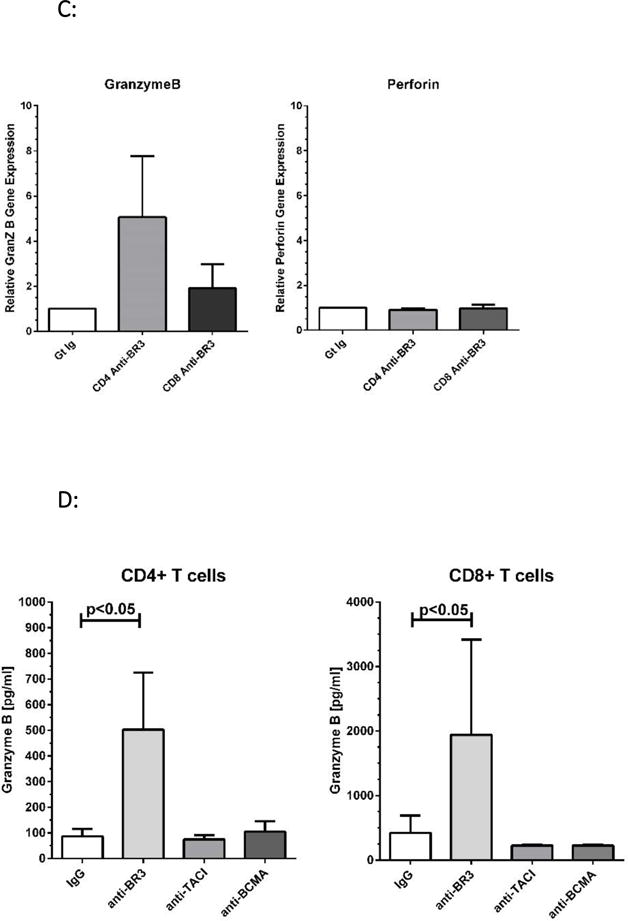
(A) ELISA analysis of IFN-γ levels in culture supernatants after 24 hours of T cell activation in the presence of BR3, TACI, or BCMA blocking antibodies or the goat IgG control. (B) Relative gene expression of IFN-γ in CD4 and CD8 T cells after 24 hours of activation in the presence of anti-BR3 or the goat IgG control. (C) PCR analysis of granzymeB versus perforin gene expression in anti-BR3 treated cells. Purified T cell subsets of three healthy donors were analyzed for granzyme B/perforin mRNA expression. (D) ELISA analysis of granzyme B released into culture supernatants of activated CD4+ and CD8+ T cells treated with BR3, TACI, or BCMA blocking antibodies or the goat IgG control. Purified T cell subsets from five healthy donors were analyzed for secreted granzyme B levels.
Since BR3 blockade augmented CD8+ T cell activation at 24 hours, we considered whether the expression of cytolytic factors was likewise enhanced. Semi-quantitative PCR analysis of anti-BR3 treated T cells demonstrated increases in granzyme B expression compared to the IgG control, both for CD4+ and CD8+ subsets whereas perforin mRNA levels were not changed (Figure 3C). ELISA analysis demonstrated that granzyme B levels in tissue culture supernatants increased significantly (2-10 fold) for both subsets (p<0.05, Figure 3D).
Silencing of BR3 Gene Expression Increases anti-CD3/CD28 Mediated T cell Activation
To determine whether enhanced T cell activation mediated by the anti-BR3 antibody was a result of BR3 neutralization or due to incidental antibody binding, we examined the effects of shRNA gene silencing of BR3 on stimulated T cells.
We tested three BR3 specific shRNA constructs as well as the control shRNA GIPZ plasmid (Dharmacon, Inc.) in primary human T cells. Briefly, purified CD4+ and CD8+ T cells were transfected via nucleoporation (Amaxa, Inc.), rested, and then rested further or activated by plate-bound anti-CD3/anti-CD28 (see Materials and Methods). Nucleoporation dramatically decreased the viability of primary T cells and in our hands often resulted in 70-80% cell death. As such, we used flow cytometry to analyze transfected/nucleoporated T cells since we could easily gate out dead cells. Transfection efficiencies were measured by GFP positivity.
To varying degrees, all three BR3 shRNA constructs decreased BR3 expression in cells rested for 24 hours, as demonstrated by flow cytometry. However, two constructs, p835 and p685, consistently down-modulated BR3 compared to the pGIPZ control. CD25 was analyzed in CD4+ T cells since the greatest differences in CD25 expression with anti-BR3 were seen in CD4+ cells. CD4+ cells were also used for intracellular IFN-γ analysis since they expressed higher levels of IFN-γ. For these experiments, purified cells were transfected, rested for 5 hours, and then activated with plate-bound anti-CD3/CD28 for 21-24 hours.
As shown in Figure 4A, p685 significantly down-modulated the expression of BR3 in BR3+ CD4+ T cells compared to the pGIPZ control. In concert with BR3 reduction, both CD25 and IFN-γ were significantly increased (p=0.03 and 0.02, respectively, Figure 4A). Interestingly, transfection of p685 increased the percentage of CD25+ cells compared to the pGIPZ control (p=0.03, Figure 4A). In addition, the percent IFN-γ+ cells also increased with p685 mediated BR3 down-modulation (p=0.02, Figure 4A).
Figure 4. Down-modulation of BR3 gene expression via shRNA.

(A) Flow cytometric analysis of BR3, CD25, and IFN-γ expression after transfection of CD4+ T cells with the pGIPZ control shRNA plasmid versus BR3 specific shRNA p685. BR3 expression was measured in cells rested 24 hours post-transfection. CD25 was measured in T cells activated for 24 hours and is noted as mean channel fluoresence. IFN-γ was analyzed by intracellular flow cytometry in T cells activated for 24 hours and is denoted as percent + IFN-γ cells in the live gate. (B) Flow cytometric analysis of BR3 and granzyme B in CD8+ cells transfected with the pGIPZ control or BR3-specific shRNA construct p835. BR3 expression was measured in cells rested 24 hours post-transfection. Granzyme B was measured by intracellular flow cytometry in CD8+ cells activated for 24 hours.
We used CD8+ cells to determine whether granzyme B was influenced by BR3 down-modulation, since a greater percentage of CD8+ cells express granzyme B than CD4+ cells. As shown in Figure 4B, p835 significantly reduced the expression of BR3 in BR3+ CD8+ cells compared to the pGIPZ control. The expression of granzyme B increased in the p835 Br3-silenced CD8+ cells compared to the control shRNA (p=0.02). These data support the hypothesis that BR3 inhibition increases anti-CD3/CD28 mediated T cell activation.
Blockade of BR3 Increases Cytolytic T cell Activation
CRTAM is a recently identified marker for cytolytic CD4+ T cells as well as integral for CD8+ CTL function27,28. Substantially elevated IFN-γ and granzyme B expression has been demonstrated in CD4+CRTAM+ T cells compared to CRTAM- counterparts28. We therefore used CRTAM as a marker to assess whether active cytolytic T cells increased activation with BR3 neutralization. As shown in Figures 5A–C, CRTAM+ cells had a significant increase in CD25 expression. Figure 5A is a representative dot plot of CD4+ T cells treated with the goat IgG control or anti-BR3, measuring CRTAM+ versus CD25+ cells. Figure 5B depicts the representative overlay of differences in CD25 expression between CRTAM- versus CRTAM+ T cell subsets. Both CD4+ and CD8+ CRTAM+ cells significantly increased their CD25 expression in the presence of anti-BR3 as measured by the MCF of CD25 (Figure 5C, p=0.02 and 0.01, respectively). Anti-TACI and anti-BCMA blockade had no significant effect. These data suggest that BR3 may suppress the activation of CD4+ and CD8+ CTLs.
Figure 5. Anti-BR3 Increases Cytolytic T cell Activation.
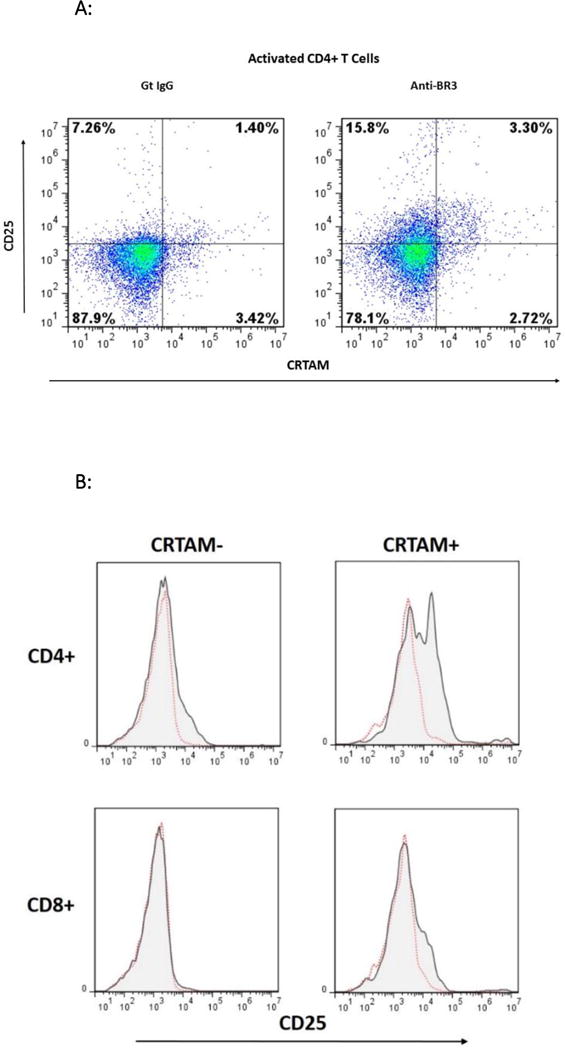
(A) Representative dot plot of flow cytometric analysis of CD25 expression in CRTAM+ versus CRTAM− activated CD4+ T cells with and without anti-BR3 blockade. (B) Representative overlays of CD25 expression in CRTAM+ versus CRTAM− CD4+ and CD8+ T cells. (C) Mean channel fluorescence of CD25 expression of CD4+CRTAM+ and CD8+CRTAM+ cells treated goat IgG, anti-BR3, anti-TACI, or anti-BCMA blocking antibodies, or without any treatment (No Tx). Differences between controls and anti-BR3 were statistically significant for both CD4+ and CD8+ T cells (p<0.05).
Anti-BR3 Enhances the Cytolytic Function of CD4+ and CD8+ T cells
To assess whether anti-BR3 enhances the cytolytic function of CD4+ and CD8+ T cells, we performed a redirected cytolytic assay using murine mastocytoma P-815 cells as the tumor target29,30. Here, anti-CD3 pulsed P-815 cells were co-cultured with CD4+ or CD8+ T cells at a 20-1 ratio for four hours. Lactose dehydrogenase (LDH) levels released from lysed target cells were then measured using an absorbance assay (Cytotox96, Promega, Inc.). As shown in Figure 6A, both CD4+ and CD8+ cells displayed significant increases in target killing in the presence of anti-BR3 versus the IgG control.
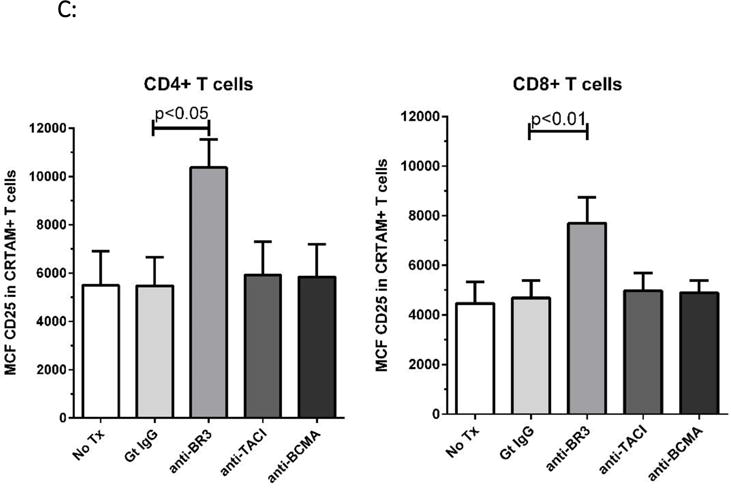
Figure 6. Anti-BR3 Enhances the Cytolytic Function of CD4+ and CD8+ T cells.

(A) Redirected killing of CD4+ and CD8+ T cells as measured by lysis of P-815 cells. Lysis was measured by LDH release. BR3 neutralization enhanced the lysis mediated by both CD4+ and CD8+ cells (p<0.01). (B) Representative dot plots of granzyme B mediated apoptosis as measured by cleaved PARP-1. CD4+ T cells were co-cultured with HeLa or A375 cells at a 25:1 ratio for 18 hours with subsequent intracellular staining of tumor cells for cleaved PARP-1. (C) Percent c-PARP-1 + tumor cells co-cultured with activated CD4+ T cells with and without anti-BR3. Of the PBMC donors screened, CD4+ T cells from Donor 1 were able to mediate apoptosis in HeLa and A375 cells. Those from Donor 2 mediated apoptosis of HeLa cells. Anti-BR3 mediated increases in cleaved PARP-1 were statistically significant (p<0.05). Data represent five separate experiments.
To determine whether anti-BR3 treated CD4+ CTLs could enhance granzyme B mediated killing of HLA class II+ targets, we screened a series of HLA-DR+ human tumor lines for direct killing via alloantigen recognition. Melanoma line A375, as well as the cervical carcinoma HeLa cell line, were co-cultured with CD4+ T cells at a 25-1 ratio for 18 hours, with or without anti-BR3. Apoptosis was then indirectly measured by intracellular levels of cleaved PARP-1 and active caspase-3, two pro-apoptotic substrates of granzyme B20–22. As shown in Figure 6B, both lines demonstrated significant increases in the percentage of c-PARP-1+ populations in the anti-BR3 treated co-cultures, as much as two-fold depending on the CD4+ T cell donor. Active caspase-3 was similarly increased (data not shown). This suggests that tumor lines are susceptible to increased apoptosis when CD4+ T cells are neutralized with anti-BR3.
Discussion
In this report, we demonstrate that BR3 can limit anti-CD3/anti-CD28 mediated T cell activation and cytotoxicity. Inhibiting BAFF binding to BR3 or down-modulating BR3 expression augments CD25, IFN-γ, and granzyme B expression. In addition, our results demonstrate that BR3 blockade increases CD25 expression on cytolytic CRTAM+ CD4+ and CD8+ T cells. Finally, neutralization with anti-BR3 enhances CTL killing of class II+ tumor lines in vitro.
We are cognizant of previous reports that show BAFF can co-stimulate TcR-mediated T cell activation in vitro10–13. Those reports which address human T cell activation11,13 vary from ours in several distinct ways. First, plate-bound BAFF (4-10 ug/ml) was used in T cell activation assays whereas we relied on the membrane-bound and low pg/ml levels of soluble BAFF expressed by the activated T cells themselves. In addition, BR3 was designated as the BAFF receptor mediating T cell co-activation based on the relatively low to nil expression of TACI and BCMA11,13. In our analyses, we found notable expression of BCMA in activated human T cells, although like others we were unable to detect TACI expression. Thus, it is possible that high concentrations of BAFF could (also) trigger BCMA to activate cells since BCMA has a 100-fold lower affinity for BAFF compared to BR331. Therefore, specific blockade of BR3 as well as its down-modulation was necessary to determine whether BR3 specifically augments human T cell activation in vitro. In our experimental system, we demonstrate that BR3 can limit the activation of CTLs.
BR3, TACI, and BCMA are all TRAF-binding receptors which associate them with pro-inflammatory, not inhibitory, functions3,32. However, the difference between BR3-mediated T cell suppression and activation could depend upon low versus high BAFF levels, similar to the TNF death receptor CD95 where low concentrations of soluble CD95L can induce cell proliferation and not apoptosis33,34. Another possibility lies in the fact that BR3 is unique among BAFF receptors in that it suppresses PKC- δ3,35 perhaps explaining its suppressive function. To this end, it has been demonstrated that PKC- δ increases lysosomal activity in CTLs36. Experiments are underway to determine whether disparate BAFF levels and/or PKC- δ signaling are linked to BR3-mediated CTL suppression.
It is not without precedent to suggest that BR3 may suppress CTL responses. For example, in a murine EAE model where T cells play a central role in the disease state, BAFF-R/BR3 deficiency led to increased disease severity37. Curiously, in clinical trials using anti-BAFF therapeutics for autoimmune diseases such as multiple sclerosis, there have been instances of increased disease severity5 leading one to hypothesize that BAFF could be suppressing CTL activation in vivo. If such is the case, then elevated BAFF levels in tumor microenvironments, shown in several B cell malignancies8, could be inhibitory to CTLs while supporting B cell survival.
One potential application of BR3 neutralization could be for ex-vivo T lymphocyte activation in chimeric antigen and tumor infiltrating T cell based cancer immune therapies38–40. Currently, activation and expansion of CAR-Ts or TILs is implemented primarily by stimulating cells with anti-CD3 and anti-CD28 with subsequent IL-2/7/15 based expansion40–43. Given our data that demonstrate an increase in expression of the high affinity IL-2 chain CD25 on CRTAM+ T cells, we propose that addition of an anti-BR3 neutralization antibody could enhance the proliferation and expansion of CD4+ and CD8+ CTLs. In addition, our novel finding that CD4+ CTLs can be activated by anti-BR3 bode well for TIL immunotherapies where tumors express class II, providing a ‘second arm’ of CTL target antigen coverage.
Acknowledgments
We would like to thank John Kink, PhD for review of this manuscript and Neehar Bhatia, PhD for her scientific input and support.
Source of Funding
This work was supported in part by the Wisconsin Alumni Research Foundation (WARF) Accelerator Program Award, the Crystal Carney Fund for Leukemia Research, the Don Anderson fund for GVHD research and University of Wisconsin Carbone Cancer Center Support Grant P30 CA014520. Peiman Hematti is supported by Stand Up To Cancer, St. Baldrick’s Pediatric Dream Team Translational Research Grant SU2C-AACR. Stand Up To Cancer is a program of the Entertainment Industry Foundation administered by the American Association for Cancer Research.
Footnotes
Conflict of Interest
The authors declare no conflicts of interest.
References
- 1.Mackay F, Schneider P. Cracking the BAFF code. Nat Rev Immunol. 2009;9:491–502. doi: 10.1038/nri2572. [DOI] [PubMed] [Google Scholar]
- 2.Mackay F, Silveira PA, Brink R. B cells and the BAFF/APRIL axis: fast-forward on autoimmunity and signaling. Curr Opin Immunol. 2007;19:327–36. doi: 10.1016/j.coi.2007.04.008. [DOI] [PubMed] [Google Scholar]
- 3.Rickert RC, Jellusova J, Miletic AV. Signaling by the tumor necrosis factor receptor superfamily in B-cell biology and disease. Immunol Rev. 2011;244:115–33. doi: 10.1111/j.1600-065X.2011.01067.x. [DOI] [PMC free article] [PubMed] [Google Scholar]
- 4.Schneider P. The role of APRIL and BAFF in lymphocyte activation. Curr Opin Immunol. 2005;17:282–9. doi: 10.1016/j.coi.2005.04.005. [DOI] [PubMed] [Google Scholar]
- 5.Vincent FB, Saulep-Easton D, Figgett WA, et al. The BAFF/APRIL system: emerging functions beyond B cell biology and autoimmunity. Cytokine Growth Factor Rev. 2013;24:203–15. doi: 10.1016/j.cytogfr.2013.04.003. [DOI] [PMC free article] [PubMed] [Google Scholar]
- 6.Bloom D, Chang Z, Pauly K, et al. BAFF is increased in renal transplant patients following treatment with alemtuzumab. Am J Transplant. 2009;9:1835–45. doi: 10.1111/j.1600-6143.2009.02710.x. [DOI] [PMC free article] [PubMed] [Google Scholar]
- 7.Tangye SG, Bryant VL, Cuss AK, et al. BAFF, APRIL and human B cell disorders. Semin Immunol. 2006;18:305–17. doi: 10.1016/j.smim.2006.04.004. [DOI] [PubMed] [Google Scholar]
- 8.Ryan MC, Grewal IS. Targeting of BAFF and APRIL for autoimmunity and oncology. Adv Exp Med Biol. 2009;647:52–63. doi: 10.1007/978-0-387-89520-8_4. [DOI] [PubMed] [Google Scholar]
- 9.Mackay F, Leung H. The role of the BAFF/APRIL system on T cell function. Semin Immunol. 2006;18:284–9. doi: 10.1016/j.smim.2006.04.005. [DOI] [PubMed] [Google Scholar]
- 10.Sutherland AP, Ng LG, Fletcher CA, et al. BAFF augments certain Th1-associated inflammatory responses. J Immunol. 2005;174:5537–44. doi: 10.4049/jimmunol.174.9.5537. [DOI] [PubMed] [Google Scholar]
- 11.Ng LG, Sutherland AP, Newton R, et al. B cell-activating factor belonging to the TNF family (BAFF)-R is the principal BAFF receptor facilitating BAFF costimulation of circulating T and B cells. J Immunol. 2004;173:807–17. doi: 10.4049/jimmunol.173.2.807. [DOI] [PubMed] [Google Scholar]
- 12.Ye Q, Wang L, Wells AD, et al. BAFF binding to T cell-expressed BAFF-R costimulates T cell proliferation and alloresponses. Eur J Immunol. 2004;34:2750–9. doi: 10.1002/eji.200425198. [DOI] [PubMed] [Google Scholar]
- 13.Huard B, Schneider P, Mauri D, et al. T cell costimulation by the TNF ligand BAFF. J Immunol. 2001;167:6225–31. doi: 10.4049/jimmunol.167.11.6225. [DOI] [PubMed] [Google Scholar]
- 14.Ward-Kavanagh LK, Lin WW, Sedy JR, et al. The TNF Receptor Superfamily in Co-stimulating and Co-inhibitory Responses. Immunity. 2016;44:1005–19. doi: 10.1016/j.immuni.2016.04.019. [DOI] [PMC free article] [PubMed] [Google Scholar]
- 15.Sanmamed MF, Pastor F, Rodriguez A, et al. Agonists of Co-stimulation in Cancer Immunotherapy Directed Against CD137, OX40, GITR, CD27, CD28, and ICOS. Semin Oncol. 2015;42:640–55. doi: 10.1053/j.seminoncol.2015.05.014. [DOI] [PubMed] [Google Scholar]
- 16.Figueroa JA, Reidy A, Mirandola L, et al. Chimeric antigen receptor engineering: a right step in the evolution of adoptive cellular immunotherapy. Int Rev Immunol. 2015;34:154–87. doi: 10.3109/08830185.2015.1018419. [DOI] [PubMed] [Google Scholar]
- 17.Knee DA, Hewes B, Brogdon JL. Rationale for anti-GITR cancer immunotherapy. Eur J Cancer. 2016;67:1–10. doi: 10.1016/j.ejca.2016.06.028. [DOI] [PubMed] [Google Scholar]
- 18.Aspeslagh S, Postel-Vinay S, Rusakiewicz S, et al. Rationale for anti-OX40 cancer immunotherapy. Eur J Cancer. 2016;52:50–66. doi: 10.1016/j.ejca.2015.08.021. [DOI] [PubMed] [Google Scholar]
- 19.Bloom DD, Centanni JM, Bhatia N, et al. A reproducible immunopotency assay to measure mesenchymal stromal cell-mediated T-cell suppression. Cytotherapy. 2015;17:140–51. doi: 10.1016/j.jcyt.2014.10.002. [DOI] [PMC free article] [PubMed] [Google Scholar]
- 20.Metkar SS, Wang B, Ebbs ML, et al. Granzyme B activates procaspase-3 which signals a mitochondrial amplification loop for maximal apoptosis. J Cell Biol. 2003;160:875–85. doi: 10.1083/jcb.200210158. [DOI] [PMC free article] [PubMed] [Google Scholar]
- 21.Ko YH, Park S, Jin H, et al. Granzyme B leakage-induced apoptosis is a crucial mechanism of cell death in nasal-type NK/T-cell lymphoma. Lab Invest. 2007;87:241–50. doi: 10.1038/labinvest.3700517. [DOI] [PubMed] [Google Scholar]
- 22.He L, Hakimi J, Salha D, et al. A sensitive flow cytometry-based cytotoxic T-lymphocyte assay through detection of cleaved caspase 3 in target cells. J Immunol Methods. 2005;304:43–59. doi: 10.1016/j.jim.2005.06.005. [DOI] [PubMed] [Google Scholar]
- 23.Malek TR, Castro I. Interleukin-2 receptor signaling: at the interface between tolerance and immunity. Immunity. 2010;33:153–65. doi: 10.1016/j.immuni.2010.08.004. [DOI] [PMC free article] [PubMed] [Google Scholar]
- 24.Hoyer KK, Dooms H, Barron L, et al. Interleukin-2 in the development and control of inflammatory disease. Immunol Rev. 2008;226:19–28. doi: 10.1111/j.1600-065X.2008.00697.x. [DOI] [PubMed] [Google Scholar]
- 25.Kalathil SG, Thanavala Y. High immunosuppressive burden in cancer patients: a major hurdle for cancer immunotherapy. Cancer Immunol Immunother. 2016;65:813–9. doi: 10.1007/s00262-016-1810-0. [DOI] [PMC free article] [PubMed] [Google Scholar]
- 26.Kursunel MA, Esendagli G. The untold story of IFN-gamma in cancer biology. Cytokine Growth Factor Rev. 2016;31:73–81. doi: 10.1016/j.cytogfr.2016.07.005. [DOI] [PubMed] [Google Scholar]
- 27.Patino-Lopez G, Hevezi P, Lee J, et al. Human class-I restricted T cell associated molecule is highly expressed in the cerebellum and is a marker for activated NKT and CD8+ T lymphocytes. J Neuroimmunol. 2006;171:145–55. doi: 10.1016/j.jneuroim.2005.09.017. [DOI] [PubMed] [Google Scholar]
- 28.Takeuchi A, Badr Mel S, Miyauchi K, et al. CRTAM determines the CD4+ cytotoxic T lymphocyte lineage. J Exp Med. 2016;213:123–38. doi: 10.1084/jem.20150519. [DOI] [PMC free article] [PubMed] [Google Scholar]
- 29.Verneris MR, Karimi M, Baker J, et al. Role of NKG2D signaling in the cytotoxicity of activated and expanded CD8+ T cells. Blood. 2004;103:3065–72. doi: 10.1182/blood-2003-06-2125. [DOI] [PubMed] [Google Scholar]
- 30.Tietze JK, Wilkins DE, Sckisel GD, et al. Delineation of antigen-specific and antigen-nonspecific CD8(+) memory T-cell responses after cytokine-based cancer immunotherapy. Blood. 2012;119:3073–83. doi: 10.1182/blood-2011-07-369736. [DOI] [PMC free article] [PubMed] [Google Scholar]
- 31.Day ES, Cachero TG, Qian F, et al. Selectivity of BAFF/BLyS and APRIL for binding to the TNF family receptors BAFFR/BR3 and BCMA. Biochemistry. 2005;44:1919–31. doi: 10.1021/bi048227k. [DOI] [PubMed] [Google Scholar]
- 32.Wajant H. Principles of antibody-mediated TNF receptor activation. Cell Death Differ. 2015;22:1727–41. doi: 10.1038/cdd.2015.109. [DOI] [PMC free article] [PubMed] [Google Scholar]
- 33.Chen L, Park SM, Tumanov AV, et al. CD95 promotes tumour growth. Nature. 2010;465:492–6. doi: 10.1038/nature09075. [DOI] [PMC free article] [PubMed] [Google Scholar]
- 34.Janssen O, Qian J, Linkermann A, et al. CD95 ligand–death factor and costimulatory molecule? Cell Death Differ. 2003;10:1215–25. doi: 10.1038/sj.cdd.4401305. [DOI] [PMC free article] [PubMed] [Google Scholar]
- 35.Mecklenbrauker I, Kalled SL, Leitges M, et al. Regulation of B-cell survival by BAFF-dependent PKCdelta-mediated nuclear signalling. Nature. 2004;431:456–61. doi: 10.1038/nature02955. [DOI] [PubMed] [Google Scholar]
- 36.Ma JS, Haydar TF, Radoja S. Protein kinase C delta localizes to secretory lysosomes in CD8+ CTL and directly mediates TCR signals leading to granule exocytosis-mediated cytotoxicity. J Immunol. 2008;181:4716–22. doi: 10.4049/jimmunol.181.7.4716. [DOI] [PubMed] [Google Scholar]
- 37.Kim SS, Richman DP, Zamvil SS, et al. Accelerated central nervous system autoimmunity in BAFF-receptor-deficient mice. J Neurol Sci. 2011;306:9–15. doi: 10.1016/j.jns.2011.04.008. [DOI] [PMC free article] [PubMed] [Google Scholar]
- 38.Restifo NP, Dudley ME, Rosenberg SA. Adoptive immunotherapy for cancer: harnessing the T cell response. Nat Rev Immunol. 2012;12:269–81. doi: 10.1038/nri3191. [DOI] [PMC free article] [PubMed] [Google Scholar]
- 39.Khalil DN, Smith EL, Brentjens RJ, et al. The future of cancer treatment: immunomodulation, CARs and combination immunotherapy. Nat Rev Clin Oncol. 2016;13:273–90. doi: 10.1038/nrclinonc.2016.25. [DOI] [PMC free article] [PubMed] [Google Scholar]
- 40.Fesnak AD, June CH, Levine BL. Engineered T cells: the promise and challenges of cancer immunotherapy. Nat Rev Cancer. 2016;16:566–81. doi: 10.1038/nrc.2016.97. [DOI] [PMC free article] [PubMed] [Google Scholar]
- 41.Ninomiya S, Narala N, Huye L, et al. Tumor indoleamine 2,3-dioxygenase (IDO) inhibits CD19-CAR T cells and is downregulated by lymphodepleting drugs. Blood. 2015;125:3905–16. doi: 10.1182/blood-2015-01-621474. [DOI] [PMC free article] [PubMed] [Google Scholar]
- 42.Frigault MJ, Lee J, Basil MC, et al. Identification of chimeric antigen receptors that mediate constitutive or inducible proliferation of T cells. Cancer Immunol Res. 2015;3:356–67. doi: 10.1158/2326-6066.CIR-14-0186. [DOI] [PMC free article] [PubMed] [Google Scholar]
- 43.Xu Y, Zhang M, Ramos CA, et al. Closely related T-memory stem cells correlate with in vivo expansion of CAR. CD19-T cells and are preserved by IL-7 and IL-15. Blood. 2014;123:3750–9. doi: 10.1182/blood-2014-01-552174. [DOI] [PMC free article] [PubMed] [Google Scholar]