

Abstract
Magnetic resonance elastography (MRE) is a method for measuring the mechanical properties of soft tissue in vivo, non-invasively, by imaging propagating shear waves in the tissue. The speed and attenuation of waves depends on the elastic and dissipative properties of the underlying material. Tissue mechanical properties are essential for biomechanical models and simulations, and may serve as markers of disease, injury, development, or recovery. MRE is already established as a clinical technique for detecting and characterizing liver disease. The potential of MRE for diagnosing or characterizing disease in other organs, including brain, breast, and heart is an active research area. Studies involving MRE in the pre-clinical setting, in phantoms and artificial biomaterials, in the mouse, and in other mammals, are critical to the development of MRE as a robust, reliable, and useful modality.
Graphical Abstract
Example MRE validation study in isotropic, viscoelastic gel performed in a 4.7T pre-clinical scanner. (a) and (c): Real and imaginary parts of complex displacement field, Uz(x,y), obtained by MRE at 150 Hz and 350 Hz, respectively. Dashed yellow lines show the orientation of data used in closed-form solution. (b) and (d): Comparison of the real and imaginary parts of the unfiltered MRE displacement data (black solid line) and the best-fit closed-form solution (red dashed line).
Reproduced from:
Phys Med Biol. Author manuscript; available in PMC 2011 Nov 7.
Published in final edited form as:
Phys Med Biol. 2011 Oct 7; 56(19): 6379–6400. Published online 2011 Sep 9. doi: 10.1088/0031-9155/56/19/014
Copyright/License ▶ Request permission to reuse

1. Motivation
For centuries, physicians have used palpation to detect pathology such as, for example, tumors, in superficial soft tissue, from local changes in stiffness. The ability to use imaging to detect analogous mechanical changes deep in tissue is desirable, as it can potentially remove the need for biopsies or other invasive procedures (1). Recent clinical studies have found MRE to be a robust and accurate method for detecting and staging liver fibrosis (2, 3).
Mechanical properties of tissue are also needed in order to model and simulate biomechanics. Traumatic brain injury (TBI) is a compelling example of a pathology that must be studied using computer models, since neither animal studies nor cadaver experiments can recapitulate the mechanics of the intact human brain in vivo. Accurate estimates of the mechanical response of brain tissue (white matter and gray matter) to rapid loading are needed for these models to be useful.
As MRE has emerged as a valuable clinical imaging approach, pre-clinical studies have played a key role in improving MRE technology, obtaining baseline measurements of tissue properties, and performing controlled studies of the effects of disease and interventions. This review focuses on the contributions of pre-clinical studies to the development of MRE, with emphasis on studies using high-field (4.7T – 11.7T) small-animal imaging systems.
2. Principles
2.1 Mechanical behavior of soft tissue
The stiffness of a structure is formally defined as the ratio of load to displacement (units of N/m); stiffness depends on geometrical, as well as material properties. For an elastic body of given size and shape that is nearly incompressible and isotropic, shear modulus, μ (units N/m2), is the single material parameter that primarily determines stiffness. The shear modulus of tissue describes its intrinsic resistance to volume-conserving deformations. The bulk modulus, κ (units N/m2), which describes the relative change in volume in response to isotropic pressure loading, is much larger than the shear modulus in nearly-incompressible materials like soft tissue. Other parameters, such as the Young’s modulus, E (units N/m2), which describes how much material stretches (axial strain, the dimensionless ratio of change in length to original length) in response to tension (axial stress, units N/m2), can be expressed in terms of shear modulus and bulk modulus: E = 9κμ/(3k + μ).
In anisotropic, elastic materials, the response to loading depends on direction. Fibrous materials, such as muscle or white matter in the brain, are structurally anisotropic, and likely to also be mechanically anisotropic. Anisotropic materials cannot be described by a single shear modulus. The simplest anisotropic material model is transverse isotropy, in which there is a single, dominant fiber axis, and corresponding plane of isotropy normal to that axis.
In transversely isotropic (TI) materials, five independent parameters are needed to describe the response, in general. The choice of parameters is not unique, but could be two shear moduli (one for shear deformation of planes parallel to fibers, μ1; one for shear deformation of planes normal to fiber axis, μ2), two Young’s moduli (one for tension parallel to fibers, E1; one for tension normal to fibers, E2), and the bulk modulus, κ. In incompressible materials, the number of independent parameters is reduced to three, which could be a baseline shear modulus, μ2, a shear anisotropy parameter, , and a tensile anisotropy parameter, .
2.2 Physics of waves in isotropic, viscoelastic media
Waves in solids are described by a dynamic displacement field, u(x, y, z, t) = u(x, t); bold font denotes vectors and tensors; scalar variables are in regular font. Wave motion is governed by the momentum equation for continua, which relates the acceleration of a material element to the divergence of the local stress field.
| [1] |
The stress tensor in an isotropic, linear elastic material is related to (small) deformations by the constitutive law
| [2] |
in which μ and λ are the two elastic Lamé parameters and ε is the strain tensor. The shear modulus, μ, governs isochoric (volume-preserving) deformations, and the ratio between shear stress (shear force per unit area on an infinitesimal cubic element) and the change in angle between sides of that element. The second Lamé parameter, λ, is important in describing the stress needed to change the volume of a material element, but not for changing its shape. The second Lamé parameter can be expressed in terms of bulk modulus, κ , and shear modulus: λ = κ − 2μ/3. In soft tissue, which is nearly incompressible, λ ⨠ μ..
The strain tensor is defined in terms of the gradient of displacement:
| [3] |
In a uniform, isotropic, elastic material the equation of motion, obtained by substituting Eqs. [2] and [3] into Eq. [1], is:
| [4] |
The displacement field due to wave motion can be decomposed into longitudinal and transverse components, u = uL + uT, where the transverse displacement component, uT, is divergence-free (∇ · uT = 0), and the longitudinal component, uL, is curl-free (∇ ×; uL = 0). The equation for the transverse displacement is:
| [5] |
The equation for the longitudinal component is
| [6] |
The curl or divergence operator can be used to separate the transverse (shear) and longitudinal wave equations in isotropic media. Letting Γ = ∇ × u and Δ = ∇ · u, we find
| [7] |
| [8] |
2.3 Wave propagation in anisotropic (transversely isotropic) materials
Tweten et al. (2015, 2017) and Schmidt et al. (2016, 2017) studied shear wave propagation in elastic, fibrous materials that can be modeled as transversely isotropic (TI) and nearly incompressible. As noted above, TI materials are defined as those in which material behavior is invariant under rotations about one axis: the axis normal to the plane of isotropy. Wave propagation speeds in TI materials depend on both the propagation direction (unit vector n), and polarization direction (unit vector m) of the shear wave, relative to the dominant fiber axis (4–7). These prior studies showed that to estimate anisotropic parameters, two types of shear waves: “slow” (or “pure transverse”) shear waves and “fast” (or “quasi-transverse”) must be measured. The wave speeds of each type, cs and cf, depend on the material parameters (baseline shear modulus, μ2, shear anisotropy ϕ , and tensile anisotropy, ζ), as well as on the angle, θ , between the propagation and fiber directions (4–7).
| [9] |
| [10] |
2.4 Waves in viscoelastic media
Waves lose energy as they travel through soft tissue. Such dissipative (“viscoelastic”) behavior may change during injury or disease, and must be taken into account to accurately represent tissue. Fortunately, harmonic waves in dissipative materials can be modeled by simply replacing real-valued elastic parameters, by complex-valued, analogous parameters. The imaginary part leads to a phase shift between harmonic stress and strain, as well as attenuation of the traveling waves.
Considering a one-dimensional (1-D) example, if stress σ = σ0exp (iωt) and strain ε = ε0exp (iωt), both coefficients σ0 and ε0 may be complex, in order to represent amplitude and phase. The complex shear modulus μ* is defined as
| [11] |
The elastic (energy storing) behavior of the material is captured by the storage modulus, μ′, and the viscous (dissipative) behavior of the material is described by the loss modulus, μ″. Note that if stress is exactly in phase with strain, the loss modulus is zero and the material is purely elastic. If the stress is π/2 radians out of phase with strain (i.e., in phase with strain rate) then the storage modulus is zero and the material is purely viscous. Using this formalism, the 1-D wave equation in an isotropic, linear viscoelastic material becomes
| [12] |
The solution, u = u0 exp(i[ωt − kx]), exhibits a complex wavenumber, k = κ − iα, real valued κ and α, that describes both the speed and attenuation of harmonic waves. The displacement can be expressed as
| [13] |
in which the propagation speed c = ω/κ. By substituting this solution into the equation of motion, we find the relationship between material parameters and features of the waves.
| [14] |
| [15] |
where .
Alternatively, one can invert the parameters of the solution (κ, α) to find the material parameters μ′ and μ″).
| [16] |
| [17] |
3 Techniques
3.1 Actuators for pre-clinical MRE
To produce shear waves, we need to generate oscillatory motion of some anatomical structure. Several different types of actuators have been used to generate vibrations and induce waves in soft tissue of a small animal, or in a container of a soft biomaterial, within the bore of a pre-clinical scanner.
Electromagnetic: alternating current in a coil in a magnetic field produces an oscillatory torque. Using the B0 field of the scanner, an actuator can be constructed simply by mechanically coupling a current-carrying coil to the animal or phantom. The coil should be placed out of the field of view to avoid generating artifacts in the image. This actuator design was used in the seminal study of Muthupillai et al (8) to generate waves in agar gel. Atay et al (9) used an electromagnetic actuator to generate shear waves at 1200 Hz in the mouse brain in a Varian 4.7T small-animal imaging system. Schregel et al. (10) used an actuator connected to the mouse head by a rod to perform MRE of the mouse brain at 1000 Hz. Yin et al (11) used an electromagnetic driving system in a 1.5T GE system to study the mouse liver by MRE at 120 Hz.
Pneumatic: Pneumatic actuators represent the clinical state of the art. The actuator system consists essentially of an acoustic “sub-woofer” connected by tubing to a flexible drum-head or air-pillow end-effector, which is pre-loaded against the head body. The commercial Resoundant™ system, supplied with clinical MRE systems, has also been used in recent animal studies. Guertler et al. (12) designed a custom end-effector to transmit vibrations through the jaws of anesthetized mini-pigs in a 3T Siemens scanner.
Piezoelectric: Compact, MR-compatible piezoelectric actuators can generate high-frequency vibrations in response to oscillations in applied voltage, making them ideal for small-animal MRE studies. A design concept developed by Clayton et al. (13) (Fig. 1) in which the piezoelectric actuator is attached to the incisor bar of the small-animal head-holder, generated vibrations from 600–1800 Hz in a 4.7T Agilent/Varian small-animal scanner. This concept has also been used in several subsequent brain MRE studies in the mouse (14, 15) and ferret (16).
Figure 1.

A custom-built stereotaxic mouse head holder used for pre-clinical MRE studies. The head of the mouse is secured between the ear bars and incisor bar. Light tension on the incisor bar ensures contact between the actuator and the teeth. An MR-compatible, amplified piezoceramic actuator drives the incisor bar harmonically, inducing mechanical vibration of the mouse skull along the rostral-caudal axis.
Reproduced from:
Phys Med Biol. 2011 Apr 21; 56(8): 2391–2406.
Published online 2011 Mar 22. doi: 10.1088/0031-9155/56/8/005
3.2 Pulse sequences for MRE
The core technique in MRE is the encoding of harmonic displacement by oscillating magnetic field gradients (“motion-encoding gradients” or MEGs). These MEGs are typically inserted between the imaging gradients, in direct analogy to diffusion encoding gradients (8, 9) (Fig. 2). Since the spin frequency depends on local field strength, a material element that moves in phase with an oscillatory gradient will accumulate a positive phase shift in its MR signal relative to a stationary element, while a material element that moves out of phase with the oscillating gradient will accumulate a negative phase shift ((8, 9). Thus, a phase contrast image acquired with an MRE sequence provides a snapshot of the harmonic displacement field at a particular time point in the oscillation. If we delay the oscillatory MEG by a specified time shift (e.g., a known fraction of the period of harmonic motion), the phase contrast image shows the displacement field at a different time point. Typically phase contrast images are acquired at N=8 equally-spaced time points within the vibration cycle. Animations of these N images show wave propagation. Furthermore, the sequence of images can be Fourier-transformed in time to extract the fundamental harmonic components of the displacement field.
Figure 2.

An MRE pulse sequence used in pre-clinical studies, obtained by modifying a standard spin-echo MR imaging sequence with sinusoidal motion-encoding gradients that oscillate at the frequency of vibration. The basic spin-echo sequence consists of RF excitation in conjunction with gradients in the slice-select (Gss), read-out (Gro), and phase-encode (Gpe) directions. This figure depicts harmonic motion-sensitizing gradients in the phase-encode direction. Dashed lines indicate that motion-encoding gradients could also be applied in the readout and slice-select directions.
Reproduced from:
J Biomech Eng. Author manuscript; available in PMC 2008 Jun 2.
Published in final edited form as:
J Biomech Eng. 2008 Apr; 130(2): 021013.
doi: 10.1115/1.2899575
3.3 Inversion – analysis (isotropic/anisotropic)
Two common approaches for estimating the shear modulus of a uniform, isotropic, elastic material are (1) local (spatial) frequency estimation (LFE)](17–19) and (2) local direct inversion (LDI) (18, 20). LFE exploits the relationships between spatial frequency, temporal frequency, wave speed, and shear modulus given in Eqs. 16–17. The local spatial frequency is estimated in 3D with an array of spatial bandpass filters (17). In LDI, the original equation of motion (Eq. 5 or Eq. 7) is fitted directly, using numerical differentiation to estimate the Laplacian and the curl. A more sophisticated, and more computationally-intensive, inversion approach is to simulate the full equations of wave propagation in a heterogeneous domain and iteratively adjust material parameter estimates until the simulation matches experimental data. This approach was implemented first by van Houten et al. (21) and continues to be used and enhanced.
4 Applications
All experimental protocols involving animals were approved by the Washington University institutional Animal Studies Committee and studies were supervised by the Division of Comparative Medicine (DCM) at the Washington University School of Medicine.
4.1 MRE development and evaluation with phantoms and biomaterials
In small bore (7–10 cm), high-field (4.7T-11.7T) scanners with high-performance gradients, MRE can be performed on small objects (1–2 cm length scale) with high spatial resolution (0.25 – 1.0 mm3 voxels). The spatial resolution of parameter estimates is determined by the wavelength of induced shear waves. To achieve wavelengths on the order of millimeters in soft tissue like brain and muscle with shear moduli between 500 – 50000 Pa, these MRE studies require high frequencies. Studies involving excitation at up to 1800 Hz have been reported. Sub-millimeter voxels are required to provide sufficiently fine discretization. In short, it is important to (i) have multiple wavelengths in the field of view, and (ii) have multiple voxels per wavelength.
4.1.1 Mechanically isotropic phantoms
As noted above, the original exposition of MRE was performed on an agar phantom in a clinical 1.5T scanner (8). Phantom studies remain a key element of research and development of MRE (22, 23). Okamoto et al. (20) performed a series of MRE experiments with a cylindrical gel phantom (Fig. 3) and compared results to direct mechanical tests (dynamic shear tests, or DST) to validate the material parameter estimates. Radially propagating shear waves were observed (Fig. 4) that matched well with predictions from closed-form solutions and simulations. Estimates of shear modulus also agreed well with measurements from DST.
Figure 3.

Experimental setup for MRE in a cylinder sample of isotropic gel. (a) MR phantom (b) orientation of phantom in MR scanner. Vertical dashed lines show the range of transverse imaging planes used for MRE.
Reproduced from:
Phys Med Biol. Author manuscript; available in PMC 2011 Nov 7.
Published in final edited form as:
Phys Med Biol. 2011 Oct 7; 56(19): 6379–6400.
Published online 2011 Sep 9. doi: 10.1088/0031-9155/56/19/014
Figure 4.

MRE validation in isotropic, viscoelastic gel. (a) and (c): Real and imaginary parts of complex displacement field, Uz(x,y), obtained by MRE at 150 Hz and 350 Hz, respectively. Dashed yellow lines show the orientation of data used in closed-form solution. (b) and (d): Comparison of the real and imaginary parts of the unfiltered MRE displacement data (black solid line) and the best-fit closed-form solution (red dashed line). Images were obtained on a 4.7T pre-clinical scanner.
Reproduced from:
Phys Med Biol. Author manuscript; available in PMC 2011 Nov 7.
Published in final edited form as:
Phys Med Biol. 2011 Oct 7; 56(19): 6379–6400. Published online 2011 Sep 9. doi: 10.1088/0031-9155/56/19/014
4.1.2 Mechanically anisotropic phantoms
Qin et al. (24) generated an anisotropic phantom by embedding Lycra fibers in a silicone (Sylgard™ , Dow Corning) gel and found anisotropy in shear. Namani et al. (25) and Schmidt et al. (5) used MRE to investigate wave motion in samples of anisotropic fibrin gel. These samples were fabricated by allowing fibrinogen/thrombin solution to polymerize in a strong magnetic field, which leads to a dominant fibril orientation parallel to the field. Conveniently, the B0 field of an 11.7T small-animal scanner is ideal for this purpose. The fibrinogen/thrombin solution polymerizes at body temperature (~37° C) but not at 0° C. The solution is prepared and maintained at 0° C using an ice bath and placed in the bore of the magnet. The temperature is then gradually increased by a water bath or circulating warm air to induce polymerization. Anisotropy can also be induced in a polyvinyl alcohol (PVA) gel by stretching the material between freeze-thaw cycles (26).
Anisotropic, fiber-reinforced materials with a single dominant fiber direction are mechanically transversely isotropic. Both cubic samples (5, 25) and disks (5) of muscle tissue ex vivo and fibrin gel (Fig. 5) have been studied, primarily, to illustrate transversely isotropic behavior. In transversely isotropic materials, the wavelengths of shear waves depends on their propagation and polarization directions (Figs. 6–7) relative to the dominant fiber axis. Chatelin et al. (27) used focused ultrasound to induce shear waves and measured direction dependent properties in anisotropic PVA gel and beef tissue ex vivo (Fig. 8).
Figure 5.
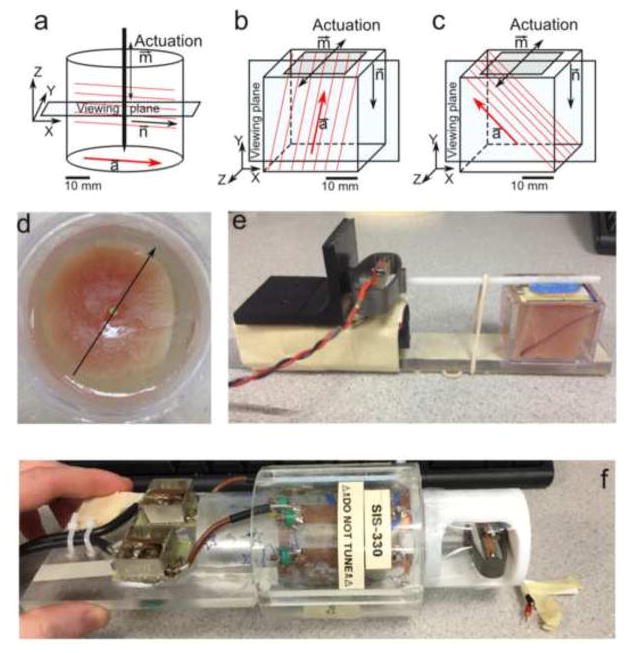
MRE of anisotropic materials. Schematic diagrams of: (a) cylindrical specimen with axial excitation; (b) cube specimen with tangential excitation in a plane parallel to the fiber direction to induce “fast” shear waves. (c) cube specimen with tangential excitation perpendicular to the dominant fiber direction to induce “slow” shear waves. (d) Photograph of cylindrical turkey breast specimen embedded in gelatin (corresponding to panel a). (e) Photograph of experimental setup for cube turkey breast (corresponding to panel b; actuator on left). (f) A cylindrical sample placed in RF coil, with piezoelectric actuator on right.
Reproduced from:
J Biomech. Author manuscript; available in PMC 2017 May 3.
Published in final edited form as:
J Biomech. 2016 May 3; 49(7): 1042–1049.
Published online 2016 Feb 15. doi: 10.1016/j.jbiomech.2016.02.018
Figure 6.

Characterization of mechanical anisotropy by MRE. Direction-dependent wave propagation in axially-excited, cylindrical specimens. (a–c) Representative phase-contrast images of elliptical waves exhibiting direction-dependent propagation. (a) Representative sample (S1) of turkey breast (TB), 800 Hz; (b) Representative sample (S2) of turkey breast, 800 Hz; (c) aligned fibrin gel (F), 200 Hz. (d) Circular waves in (isotropic) gelatin (G), 200 Hz. (e) Ellipses were fitted to the wave images (white and black lines in b d) and the average ratios of their semi-axes are shown for the respective materials. Images were obtained on a 4.7T pre-clinical scanner.
Reproduced from:
J Biomech. Author manuscript; available in PMC 2017 May 3.
Published in final edited form as:
J Biomech. 2016 May 3; 49(7): 1042–1049.
Published online 2016 Feb 15. doi: 10.1016/j.jbiomech.2016.02.018
Figure 7.

Characterization of anisotropy by direction-dependent shear-wave speeds measured with MRE. Average (± std. deviation) slow shear-wave speeds (blue *) plotted vs the angle between the propagation direction and the horizontal axis of the cylinder, in cylindrical specimens shown in the previous figure. (a) Representative sample S1 of turkey breast (800 Hz). (b) Representative sample S2 of turkey breast (800 Hz). (c) Aligned fibrin gel (200 Hz). (d) Gelatin (200 Hz). Each plot describes a single sample; average values for each direction are computed over 5 slices. Theoretical curves (red lines) are obtained using values of μ and ϕ estimated by weighted, least-squares fitting for each sample.
Reproduced from:
J Biomech. Author manuscript; available in PMC 2017 May 3.
Published in final edited form as:
J Biomech. 2016 May 3; 49(7): 1042–1049.
Published online 2016 Feb 15. doi: 10.1016/j.jbiomech.2016.02.018
Figure 8.

MRE in anisotropic materials with excitation by focused ultrasound. (A) Anatomical (T2-weighted) image of an anisotropic PVA phantom. (B) Phase-contrast image of shear waves excited by focused ultrasound source in the PVA gel. (C) Apparent shear modulus of PVA gel plotted vs angle (red contour represents theoretical values for TI material). (D) Anatomical (T2-weighted) image of ex vivo beef muscle. (E) Phase-contrast image of shear waves excited by focused ultrasound source in the beef muscle. (C) Apparent shear modulus of beef muscle plotted vs angle (red contour represents theoretical values for TI material). Images were obtained on a 1.5T clinical scanner.
Reproduced from:
Chatelin S, Charpentier I, Corbin N, Meylheuc L, Vappou J. An automatic differentiation-based gradient method for inversion of the shear wave equation in magnetic resonance elastography: specific application in fibrous soft tissues. Phys Med Biol. 2016 Jul 7;61(13):5000–19. doi: 10.1088/0031-9155/61/13/5000. Epub 2016 Jun 14. PubMed PMID: 27300107.
Request permission
http://www.copyright.com/openurl.do?issn=0031-9155&WT.mc.id=
4.1.3 Ex vivo tissue
MRE has also been performed on samples of tissue ex vivo, including muscle (5) and brain (12, 28, 29). Early studies (28) were performed on whole brains 24–48 hr post-mortem using a low-field 0.1T magnet.
These studies are generally to provide “proof-of-concept” for methods intended ultimately to be used in vivo. Guertler et al. (12) performed MRE in samples of brain tissue ex vivo at 4.7T, and compared estimates of tissue material properties ex vivo to analogous estimates obtained in vivo in a clinical 3T scanner. Schmidt et al. (29) also performed MRE in porcine brain tissue ex vivo and observed mildly anisotropic shear moduli.
4.2 MRE of brain in vivo
4.2.1 Mouse
Atay et al. (9) performed the first MRE study of the mechanical properties of the mouse brain. Using an electromagnetic actuator, they generated shear waves at 1200 Hz in the mouse brain and used a spin-echo sequence, modified with sinusoidal motion encoding gradients at the same frequency, to image the resulting waves. Atay et al. (9) estimated a single equivalent stiffness, although the tissue is known to be dissipative. Schregel et al. (10) performed MRE in mice with myelin loss, using a pre-clinical 7T system, and demonstrated a measurable decrease in stiffness in white matter. Clayton et al. (13) used MRE at multiple frequencies in the mouse brain (Fig. 9) to obtain estimates of both storage and loss modulus as functions of frequency (Fig. 10). Schregel et al. (30) characterized with MRE the stiffness of brain white matter in mice in which demyelination was induced by cuprizone diet (Fig. 11). Feng et al. (15) used MRE to detect changes in the stiffness of implanted brain tumors in animals exposed to therapeutic doses of radiation, as well as in control animals without treatment. Othman et al. used MRE to study the stiffness of the mouse brain post TBI (31, 32). Recently Kearney and co-authors (14) developed a novel method to encode motion in all three directions simultaneously, and applied this technique to MRE of the mouse brain.
Figure 9.

MRE in the mouse brain. Example anatomical images, displacement fields and estimates of viscoelastic shear moduli. (Row 1): Magnitude images of a central (A/P) region of the brain; four contiguous, 250-μm thick slices were averaged (1 mm total thickness). (Rows 2 & 3): External mechanical motion induces propagating waves within mouse brain tissue. The real, U3', and imaginary, U3”, components of the fundamental harmonic of the through-plane displacement are shown for slice two of three contiguous slices used for inversion. (Rows 4 & 5): Elastograms (images of storage modulus, G', and loss modulus, G”) calculated from the displacement fields of Rows 2 & 3. Images were obtained on a 4.7T pre-clinical scanner.
Reproduced from:
Phys Med Biol. 2011 Apr 21; 56(8): 2391–2406.
Published online 2011 Mar 22. doi: 10.1088/0031-9155/56/8/005
Figure 10.

MRE in the mouse brain. The frequency dependence of the average viscoelastic mechanical parameters estimated by MRE for the central region of the mouse brain (n=6). Estimates were obtained by fitting a single motion component of the complex displacement harmonic to the equation of motion. A power-law fit of the form G(ω) = κωα is shown as a dashed line. (G': κ = 0.04 × 10⁻³, α = 1.29; G”: κ = 1.24 × 10⁻³, α = 0.83).
Reproduced from:
Phys Med Biol. 2011 Apr 21; 56(8): 2391–2406.
Published online 2011 Mar 22. doi: 10.1088/0031-9155/56/8/005
Figure 11.

Anatomical (T2-weighted) MRI (top row) and MRE-derived maps of shear modulus |G*| (bottom row) in the mouse showing the effects of cuprizone-induced demyelination. (Left) A healthy control. (Right) A mouse after 12 wk of continuous cuprizone diet. Demyelination is indicated by loss of contrast in the T2-weighted image, and by the decrease in stiffness in the red-outlined region of interest. Images were obtained on a 7T pre-clinical scanner.
Reproduced from:
1: Schregel K, Wuerfel E, Garteiser P, Gemeinhardt I, Prozorovski T, Aktas O, Merz H, Petersen D, Wuerfel J, Sinkus R. Demyelination reduces brain parenchymal stiffness quantified in vivo by magnetic resonance elastography. Proc Natl Acad Sci U S A. 2012 Apr 24;109(17):6650–5. doi: 10.1073/pnas.1200151109. Epub 2012 Apr 5. PubMed PMID: 22492966; PubMed Central PMCID: PMC3340071.
To request permission
4.2.2 Larger mammals: pig and ferret
Vappou et al. studied the pig brain ex vivo using MRE at 0.1T with an excitation frequency of 80–140 Hz to estimate material properties. Guertler et al. (12) performed MRE in the mini-pig, using a custom jaw actuator to induce shear waves in the brain at 50 Hz, 80 Hz, 100 Hz, and 125 Hz. Notably, these authors (12) performed MRE both in vivo and ex vivo, and found that the estimated storage modulus ex vivo appeared significantly lower than the in vivo storage modulus at the higher frequencies. Feng et al. (16) investigated the mechanical properties of the adult ferret brain using MRE (Figs. 12–13). The storage moduli of both gray and white matter increased from approximately 3kPa at 400 Hz to 7kPa at 800 Hz.
Figure 12.

MRE in the ferret brain. Displacement fields obtained at (a) 400 Hz and (b) 600 Hz actuator frequencies. Four phases of the periodic motion (0,π/2,π,3π/2) are shown in sequence from left to right. Three displacement components in x (left-right), y (inferior-superior), and z (anterior-posterior) directions in Cartesian coordinates are shown. Panel (a) above is from one ferret (F1); panel (b) is from an analogous brain section in another ferret (F2). Images were obtained on a 4.7T pre-clinical scanner.
Reproduced from:
J Biomech. 2013 Mar 15; 46(5): 863–870.
Published online 2013 Jan 24. doi: 10.1016/j.jbiomech.2012.12.024
Figure 13.

MRE in the ferret brain. Example storage (G′) and loss (G″) modulus estimates for (a, d) 400 Hz, (b, e) 600 Hz and (c, f) 800 Hz actuation frequency for posterior sections in two ferrets. (a–c) ferret F1 (Fig. 10a). (d–f) ferret F2 (Fig. 10b). White outlines indicate the regions over which modulus estimates were attempted. Estimates were based on fitting of curl fields to the equation of motion (expressed in terms of curl) and were rejected if the normalized residual error (NRE) of fitting exceeded 0.50.
Reproduced from:
J Biomech. 2013 Mar 15; 46(5): 863–870.
Published online 2013 Jan 24. doi: 10.1016/j.jbiomech.2012.12.024
4.3 MRE of liver in vivo
4.3.1 Mouse
MRE studies of liver material properties in the mouse were performed by Yin et al. (33). These investigators used a silver acupuncture needle embedded in the animal’s liver to induce radially propagating shear waves. Motion was excited by an electromagnetic actuator at 120 Hz. The relative sparsity of pre-clinical MRE studies in the mouse liver is somewhat surprising, given the emerging clinical importance of liver MRE. However, technical challenges, such as non-invasively and reliably inducing shear waves in the liver, and eliminating respiratory motion artifacts, remain fairly daunting.
4.4 MRE of heart, skeletal muscle, lung, and other tissues
Other soft tissues that have been targets of MRE in human subjects have also been studied in the pre-clinical setting. McGee et al. (34) demonstrated the feasibility of MRE in the mouse lung on a 1.5T scanner. Cardiac MRE has been performed in the mouse (35) and pig (36). MRE has also been used to estimate anisotropic mechanical parameters of skeletal muscle in the mouse (37). Liu and co-authors (35) performed an elegant MRE investigation of cardiac stiffness in the mouse at 400 Hz and found the stiffness of myocardium at end diastole to be 1/2 to 2/3 of the stiffness at end systole
5. Summary and outlook
Magnetic resonance elastography is a relatively new modality, which is emerging as a valuable clinical tool and growing as a topic of research and development. Pre-clinical studies using high-field, high-performance, small-animal scanners have played, and will continue to play, an important role in the development of MRE.
The combination of high-intensity focused ultrasound (HIFU) and MRE is a new area with intriguing potential. Chen et al. (38) demonstrated that harmonic focused ultrasound-induced motion can be used to detect qualitative changes in pancreatic stiffness associated with cancer. Chatelin et al. (27) demonstrated MRE using shear waves induced by acoustic radiation force. MR thermometry is already used to monitor temperature during HIFU ablation. Using this instrumentation as a versatile system to probe mechanical properties deep in tissue is an exciting area of future work. The combination of DTI and MRE is emerging as an important approach for characterizing mechanical anisotropy; recently the ability to simultaneously acquire DTI and MRE data in 3D has been established theoretically and demonstrated experimentally (39).
We believe that during the last decade, several important and useful pre-clinical studies have been performed at the Biomedical MR Lab at Washington University in Saint Louis (5, 9, 15, 16, 25, 40). These studies would not have been possible without considerable advice and support from Joe Ackerman. Probably the biggest factor in enabling this work was Joe’s willingness to welcome us, and our trainees, into the lab. He has established a culture that is scientifically rigorous, and that rewards creativity and intellectual adventurousness, but maintains a strong sense of community. Joe has had a tremendous impact on both of our careers, and we know there are many others who can say the same. We look forward to continuing to develop and use MRE in the pre-clinical setting and to many future interactions with our friend and mentor, Joe Ackerman.
Highlights.
MR elastography (MRE) is a powerful method for measuring tissue mechanics.
MRE has been used to characterize liver, brain, breast, and heart in small animals.
Pre-clinical studies in phantoms and biomaterials are key to MRE development.
Much work has been done at the BMRL with guidance and support of Joe Ackerman.
Acknowledgments
Our work in this area has been funded by NIH grants EB005834 and NS055951, and NSF grants CMMI-1332433, and CMMI-1727412. Support from Washington University in Saint Louis and the Mallinckrodt Institute of Radiology is also gratefully acknowledged.
Footnotes
Publisher's Disclaimer: This is a PDF file of an unedited manuscript that has been accepted for publication. As a service to our customers we are providing this early version of the manuscript. The manuscript will undergo copyediting, typesetting, and review of the resulting proof before it is published in its final citable form. Please note that during the production process errors may be discovered which could affect the content, and all legal disclaimers that apply to the journal pertain.
References
- 1.Yin M, Talwalkar J, Glaser K, Manduca A, Grimm R, Rossman P, Fidler J, Ehman R. Assessment of Hepatic Fibrosis With Magnetic Resonance Elastography. Clinical Gastroenterology and Hepatology. 2007;5:1207–1213.e1202. doi: 10.1016/j.cgh.2007.06.012. [DOI] [PMC free article] [PubMed] [Google Scholar]
- 2.Singh S, Venkatesh SK, Loomba R, Wang Z, Sirlin C, Chen J, Yin M, Miller FH, Low RN, Hassanein T, Godfrey EM, Asbach P, Murad MH, Lomas DJ, Talwalkar JA, Ehman RL. Magnetic resonance elastography for staging liver fibrosis in non-alcoholic fatty liver disease: a diagnostic accuracy systematic review and individual participant data pooled analysis. Eur Radiol. 2016;26:1431–1440. doi: 10.1007/s00330-015-3949-z. [DOI] [PMC free article] [PubMed] [Google Scholar]
- 3.Yin M, Glaser KJ, Talwalkar JA, Chen J, Manduca A, Ehman RL. Hepatic MR Elastography: Clinical Performance in a Series of 1377 Consecutive Examinations. Radiology. 2016;278:114–124. doi: 10.1148/radiol.2015142141. [DOI] [PMC free article] [PubMed] [Google Scholar]
- 4.Tweten DJ, Okamoto RJ, Bayly PV. Requirements for accurate estimation of anisotropic material parameters by magnetic resonance elastography: A computational study. Magn Reson Med. 2017 doi: 10.1002/mrm.26600. [DOI] [PMC free article] [PubMed] [Google Scholar]
- 5.Schmidt JL, Tweten DJ, Benegal AN, Walker CH, Portnoi TE, Okamoto RJ, Garbow JR, Bayly PV. Magnetic resonance elastography of slow and fast shear waves illuminates differences in shear and tensile moduli in anisotropic tissue. J Biomech. 2016;49:1042–1049. doi: 10.1016/j.jbiomech.2016.02.018. [DOI] [PMC free article] [PubMed] [Google Scholar]
- 6.Tweten DJ, Okamoto RJ, Schmidt JL, Garbow JR, Bayly PV. Estimation of material parameters from slow and fast shear waves in an incompressible, transversely isotropic material. J Biomech. 2015;48:4002–4009. doi: 10.1016/j.jbiomech.2015.09.009. [DOI] [PMC free article] [PubMed] [Google Scholar]
- 7.Parker DF. Elastic wave propagation in strongly anisotropic solids. In: Spencer AJM, editor. Continuum Theory of the Mechanics of Fibre-Reinforced Composites. Springer-Verlag; New York: 1984. pp. 217–244. [Google Scholar]
- 8.Muthupillai R, Lomas DJ, Rossman PJ, Greenleaf JF, Manduca A, Ehman RL. Magnetic resonance elastography by direct visualization of propagating acoustic strain waves. Science. 1995;269:1854–1857. doi: 10.1126/science.7569924. [DOI] [PubMed] [Google Scholar]
- 9.Atay SM, Kroenke CD, Sabet A, Bayly PV. Measurement of the dynamic shear modulus of mouse brain tissue in vivo by magnetic resonance elastography. J Biomech Eng. 2008;130:021013. doi: 10.1115/1.2899575. [DOI] [PMC free article] [PubMed] [Google Scholar]
- 10.Schregel K, Wuerfel E, Garteiser P, Gemeinhardt I, Prozorovski T, Aktas O, Merz H, Petersen D, Wuerfel J, Sinkus R. Demyelination reduces brain parenchymal stiffness quantified in vivo by magnetic resonance elastography. Proc Natl Acad Sci U S A. 2012;109:6650–6655. doi: 10.1073/pnas.1200151109. [DOI] [PMC free article] [PubMed] [Google Scholar]
- 11.Yin M, Woollard J, Wang X, Torres VE, Harris PC, Ward CJ, Glaser KJ, Manduca A, Ehman RL. Quantitative assessment of hepatic fibrosis in an animal model with magnetic resonance elastography. Magn Reson Med. 2007;58:346–353. doi: 10.1002/mrm.21286. [DOI] [PubMed] [Google Scholar]
- 12.Guertler CA, Okamoto RJ, Schmidt JL, Badachhape AA, Johnson CL, Bayly PV. Mechanical Properties of Porcine Brain Tissue In Vivo and Ex Vivo Estimated by MR Elastography. 2017 doi: 10.1016/j.jbiomech.2018.01.016. In review. [DOI] [PMC free article] [PubMed] [Google Scholar]
- 13.Clayton EH, Garbow JR, Bayly PV. Frequency-dependent viscoelastic parameters of mouse brain tissue estimated by MR elastography. Phys Med Biol. 2011;56:2391–2406. doi: 10.1088/0031-9155/56/8/005. [DOI] [PMC free article] [PubMed] [Google Scholar]
- 14.Kearney SP, Majumdar S, Royston TJ, Klatt D. Simultaneous 3D MR elastography of the in vivo mouse brain. Phys Med Biol. 2017 doi: 10.1088/1361-6560/aa8444. [DOI] [PubMed] [Google Scholar]
- 15.Feng Y, Clayton EH, Okamoto RJ, Engelbach J, Bayly PV, Garbow JR. A longitudinal magnetic resonance elastography study of murine brain tumors following radiation therapy. Phys Med Biol. 2016;61:6121–6131. doi: 10.1088/0031-9155/61/16/6121. [DOI] [PMC free article] [PubMed] [Google Scholar]
- 16.Feng Y, Clayton EH, Chang Y, Okamoto RJ, Bayly PV. Viscoelastic properties of the ferret brain measured in vivo at multiple frequencies by magnetic resonance elastography. J Biomech. 2013;46:863–870. doi: 10.1016/j.jbiomech.2012.12.024. [DOI] [PMC free article] [PubMed] [Google Scholar]
- 17.Knutsson H, Westin CF, Granlund G. Local multiscale frequency and bandwidth estimation. Proceedings of the IEEE International Conference on Image Processing; 1994. pp. 36–40. [Google Scholar]
- 18.Manduca A, Oliphant TE, Dresner MA, Mahowald JL, Kruse SA, Amromin E, Felmlee JP, Greenleaf JF, Ehman RL. Magnetic resonance elastography: non-invasive mapping of tissue elasticity. Med Image Anal. 2001;5:237–254. doi: 10.1016/s1361-8415(00)00039-6. [DOI] [PubMed] [Google Scholar]
- 19.Clayton EH, Okamoto RJ, Bayly PV. Mechanical properties of viscoelastic media by local frequency estimation of divergence-free wave fields. J Biomech Eng. 2013;135:021025. doi: 10.1115/1.4023433. [DOI] [PMC free article] [PubMed] [Google Scholar]
- 20.Okamoto RJ, Clayton EH, Bayly PV. Viscoelastic properties of soft gels: comparison of magnetic resonance elastography and dynamic shear testing in the shear wave regime. Physics in Medicine and Biology. 2011;56:6379. doi: 10.1088/0031-9155/56/19/014. [DOI] [PMC free article] [PubMed] [Google Scholar]
- 21.Van Houten EE, Paulsen KD, Miga MI, Kennedy FE, Weaver JB. An overlapping subzone technique for MR-based elastic property reconstruction. Magn Reson Med. 1999;42:779–786. doi: 10.1002/(sici)1522-2594(199910)42:4<779::aid-mrm21>3.0.co;2-z. [DOI] [PubMed] [Google Scholar]
- 22.Van Houten EE, Weaver JB, Miga MI, Kennedy FE, Paulsen KD. Elasticity reconstruction from experimental MR displacement data: initial experience with an overlapping subzone finite element inversion process. Med Phys. 2000;27:101–107. doi: 10.1118/1.598861. [DOI] [PubMed] [Google Scholar]
- 23.Doyley MM, Weaver JB, Van Houten EE, Kennedy FE, Paulsen KD. Thresholds for detecting and characterizing focal lesions using steady-state MR elastography. Med Phys. 2003;30:495–504. doi: 10.1118/1.1556607. [DOI] [PubMed] [Google Scholar]
- 24.Qin EC, Sinkus R, Geng G, Cheng S, Green M, Rae CD, Bilston LE. Combining MR elastography and diffusion tensor imaging for the assessment of anisotropic mechanical properties: a phantom study. J Magn Reson Imaging. 2013;37:217–226. doi: 10.1002/jmri.23797. [DOI] [PubMed] [Google Scholar]
- 25.Namani R, Wood MD, Sakiyama-Elbert SE, Bayly PV. Anisotropic mechanical properties of magnetically aligned fibrin gels measured by magnetic resonance elastography. J Biomech. 2009;42:2047–2053. doi: 10.1016/j.jbiomech.2009.06.007. [DOI] [PMC free article] [PubMed] [Google Scholar]
- 26.Chatelin S, Bernal M, Deffieux T, Papadacci C, Flaud P, Nahas A, Boccara C, Gennisson JL, Tanter M, Pernot M. Anisotropic polyvinyl alcohol hydrogel phantom for shear wave elastography in fibrous biological soft tissue: a multimodality characterization. Phys Med Biol. 2014;59:6923–6940. doi: 10.1088/0031-9155/59/22/6923. [DOI] [PubMed] [Google Scholar]
- 27.Chatelin S, Charpentier I, Corbin N, Meylheuc L, Vappou J. An automatic differentiation-based gradient method for inversion of the shear wave equation in magnetic resonance elastography: specific application in fibrous soft tissues. Phys Med Biol. 2016;61:5000–5019. doi: 10.1088/0031-9155/61/13/5000. [DOI] [PubMed] [Google Scholar]
- 28.Vappou J, Breton E, Choquet P, Goetz C, Willinger R, Constantinesco A. Magnetic resonance elastography compared with rotational rheometry for in vitro brain tissue viscoelasticity measurement. MAGMA. 2007;20:273–278. doi: 10.1007/s10334-007-0098-7. [DOI] [PubMed] [Google Scholar]
- 29.Schmidt JL, Tweten DJ, Badachhape AA, Reiter AJ, Okamoto RJ, Garbow JR, Bayly PV. Measurement of anisotropic mechanical properties in porcine brain white matter ex vivo using magnetic resonance elastography. J Mech Behav Biomed Mater. 2017 doi: 10.1016/j.jmbbm.2017.11.045. In press. [DOI] [PMC free article] [PubMed] [Google Scholar]
- 30.Schregel K, Wuerfel E, Wuerfel J, Petersen D, Sinkus R. Viscoelastic properties change at an early stage of Cuprizone induced affection of Oligodendrocytes in the Corpus Callosum of C57/black6 mice. International Society for Magnetic Resonance in Medicine. 2010:2134. [Google Scholar]
- 31.Boulet T, Kelso ML, Othman SF. Microscopic magnetic resonance elastography of traumatic brain injury model. J Neurosci Methods. 2011;201:296–306. doi: 10.1016/j.jneumeth.2011.08.019. [DOI] [PubMed] [Google Scholar]
- 32.Boulet T, Kelso ML, Othman SF. Long-term in vivo imaging of viscoelastic properties of the mouse brain after controlled cortical impact. J Neurotrauma. 2013;30:1512–1520. doi: 10.1089/neu.2012.2788. [DOI] [PMC free article] [PubMed] [Google Scholar]
- 33.Yin M, Woollard J, Wang X, Torres VE, Harris PC, Ward CJ, Glaser KJ, Manduca A, Ehman RL. Quantitative assessment of hepatic fibrosis in an animal model with magnetic resonance elastography. Magnetic Resonance in Medicine. 2007;58:346–353. doi: 10.1002/mrm.21286. [DOI] [PubMed] [Google Scholar]
- 34.McGee KP, Hubmayr RD, Levin D, Ehman RL. Feasibility of quantifying the mechanical properties of lung parenchyma in a small-animal model using (1)H magnetic resonance elastography (MRE) J Magn Reson Imaging. 2009;29:838–845. doi: 10.1002/jmri.21720. [DOI] [PMC free article] [PubMed] [Google Scholar]
- 35.Liu Y, Royston TJ, Klatt D, Lewandowski ED. Cardiac MR elastography of the mouse: Initial results. Magn Reson Med. 2016;76:1879–1886. doi: 10.1002/mrm.26030. [DOI] [PMC free article] [PubMed] [Google Scholar]
- 36.Mazumder R, Schroeder S, Mo X, Clymer BD, White RD, Kolipaka A. In vivo quantification of myocardial stiffness in hypertensive porcine hearts using MR elastography. J Magn Reson Imaging. 2017;45:813–820. doi: 10.1002/jmri.25423. [DOI] [PMC free article] [PubMed] [Google Scholar]
- 37.Qin EC, Juge L, Lambert SA, Paradis V, Sinkus R, Bilston LE. In vivo anisotropic mechanical properties of dystrophic skeletal muscles measured by anisotropic MR elastographic imaging: the mdx mouse model of muscular dystrophy. Radiology. 2014;273:726–735. doi: 10.1148/radiol.14132661. [DOI] [PubMed] [Google Scholar]
- 38.Chen H, Hou GY, Han Y, Payen T, Palermo CF, Olive KP, Konofagou EE. Harmonic motion imaging for abdominal tumor detection and high-intensity focused ultrasound ablation monitoring: an in vivo feasibility study in a transgenic mouse model of pancreatic cancer. IEEE Trans Ultrason Ferroelectr Freq Control. 2015;62:1662–1673. doi: 10.1109/TUFFC.2015.007113. [DOI] [PMC free article] [PubMed] [Google Scholar]
- 39.Yin Z, Kearney SP, Magin RL, Klatt D. Concurrent 3D acquisition of diffusion tensor imaging and magnetic resonance elastography displacement data (DTI-MRE): Theory and in vivo application. Magn Reson Med. 2017;77:273–284. doi: 10.1002/mrm.26121. [DOI] [PubMed] [Google Scholar]
- 40.Clayton EH, Garbow JR, Bayly PV. Frequency-dependent viscoelastic parameters of mouse brain tissue estimated by MR elastography. Phys Med Biol. 2011;56:2391–2406. doi: 10.1088/0031-9155/56/8/005. [DOI] [PMC free article] [PubMed] [Google Scholar]