Abstract
The family of fatigue-life distributions is introduced as an alternative model of reaction time data. This family includes the shifted Wald distribution and a shifted version of the Birnbaum–Saunders distribution. Although the former has been proposed as a way to model reaction time data, the latter has not. Hence, we provide theoretical, mathematical and practical arguments in support of the shifted Birnbaum–Saunders as a suitable model of simple reaction times and associated cognitive mechanisms.
Electronic supplementary material
The online version of this article (10.1007/s11571-017-9473-x) contains supplementary material, which is available to authorized users.
Keywords: Fatigue-life distributions, Reaction times, Latent cognitive processes, Shifted Wald distribution, Birnbaum–Saunders distribution
In experimental psychology, response or reaction times (RTs) are the time-lapse between a stimulus (or a series of stimuli) and a behavioral response. Just recently Anders et al. (2016) argued for the suitability of the shifted Wald (SW) distribution not only as a quantitative distribution measurement for RT data, but also as a way to model RTs arising from simple cognitive mechanisms. In terms of a quantitative distribution measurement, the SW captures features of canonical RT distributions (i.e. positive support, right skewness, etc.). As an explicative model for RTs, suppose that a latent cognitive process follows:
| 1 |
where is a noise. That is, the latent cognitive process follows a stochastic process, where will come to represent the mean rate information accumulation, which is influenced by either individual differences in the quality of information processing or by stimulus characteristics that reflect task difficulty; and represents the time outside the processing that each individual takes to select a choice. Accordingly, the first RT is defined as the following first-passage time (FPT):
| 2 |
where is some fixed threshold representing the barrier at which individuals respond. The SW is then the exact distribution of when corresponds to a Brownian motion. Subsequent RTs are defined analogously by restarting the process (1) at 0, thus forming an independent and identically distributed (IID) sequence of RTs.
This cognitive and behavioral scheme is simple because the FPT in (2) considers just one barrier, which is less specified for cases that present multiple distracting alternatives, as the SW diffusion parameters would contain aggregated effect information. Instead, models that aim to parse this information into separate parameters require to take into account, among other considerations, multiple accumulators or double barriers [see e.g. LaBerge (1962), Ratcliff (1978), Ratcliff and Tuerlinckx (2002), Horrocks and Thomson (2004), Blurton et al. (2017), Usher et al. (2002), Brown and Heathcote (2008)].
It can be noticed that when Eqs. (1) and (2) are also used to describe simple stochastic versions of the Lapicque’s 1907 integrate-and-fire model (Abbott 1999), although could be included in the modeling by playing the role of the “refractory period”. Leiva et al. (2015) and Tejo and Niklitschek-Soto (2016) proposed a fatigue-life family of distributions for inter-spike interval (ISI) data under this kind of processes, where such ISIs are mathematically defined in a similar way to the RTs. This fatigue-life family contains the inverse Gaussian (or Wald) and the Birnbaum–Saunders (BS) distributions. The reason for adopting these distributions is that processes of the kind shown in Eq. (1) can be seen as cumulative damage processes, as explained below.
The BS distribution [also known as fatigue life distribution, Birnbaum and Saunders (1969)], which has gradually increased its use in many fields of applications [see Leiva (2015)] appears in this context in the following way. Set for now , and consider the discrete version of Eq. (1): , where . Then, we have that is a cumulative process, where . The analogy with a process of material fatigue is that a “material” is undergoing “damages” ’s and the “crack” occurs when the cumulative damages exceeds some “fatigue threshold” value . In this regards, the BS arises as an approximative distribution of (2) when forms an IID sequence of random variables (RVs) with expectation and variance , and where is high, which will imply that the event is almost equivalent to event since is an almost increasing process. This approximation uses the Central Limit Theorem (CLT) applied to , so that the distribution of is near normally distributed with mean and variance . Specifically,
| 3 |
where is the cumulative distribution function (CDF) of a standard normal RV. By defining and considering the continuous extension of time, we have that the CDF of will be approximately given by:
| 4 |
with , and where . This is the classic BS CDF. The parameter describes the shape of the distribution and is its median. It can be shown that the expectation is given by and its variance by . Deriving with respect to t we obtain de corresponding probability density function (PDF) of the BS:
| 5 |
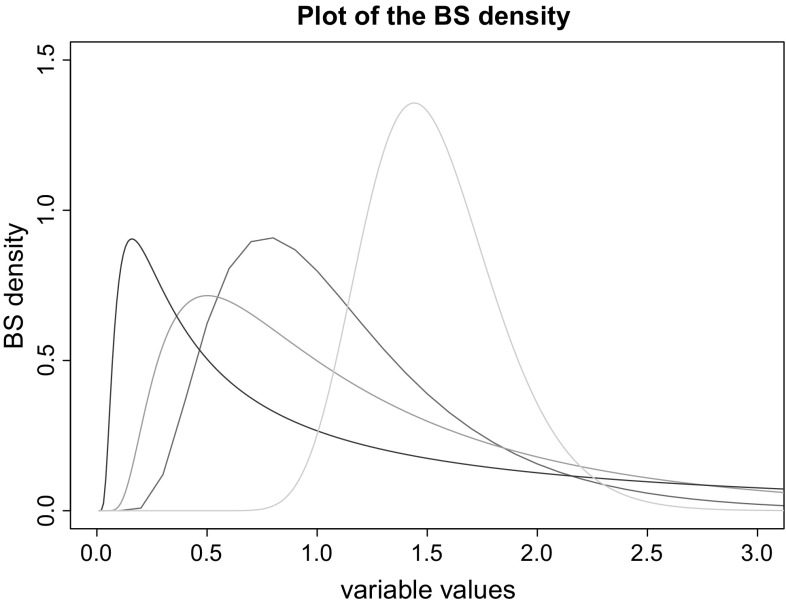
where is the PDF of a standard normal RV (see Fig. 1 for different BS PDF forms according to different parameter values).
Fig. 1.
Different BS PDFs according to different parametrization. In red ; in green ; in blue ; and in cyan . We can notice that in the last case, is small, and then its shape is more symmetrical than the former cases. This is because its expectation, is near its median . (Color figure online)
In summary, the two key ingredients for the emergence of the BS are:
A discretized version of Eq. (1), where the increments of the noise forms an IID sequence of RVs with variance , and such that is high, where .
The distribution of (2) is obtained by approximating the distribution of by a normal RV of mean and variance due to the CLT, and making a continuous extension of time [see Eq. (3)].
This can allow us to consider different types of noise. As example, in Fierro et al. (2013) the BS for FPTs is obtained as arising from Poisson processes.
A “shifted” version of (5) simply appears by shifting the support to , with . Therefore, the shifted BS (SBS) PDF is defined by:
| 6 |
for . Although the Wald (or SW) distribution is the exact distribution of when is a Brownian motion, the BS (or SBS) distribution can be a more adequate model for when such a noise is not Gaussian. For these reasons, we argue that the SBS can also be a suitable distribution as an explicative model for RTs arising from such simple cognitive mechanisms. Also, the SBS can be suitable as a quantitative measurement distribution for RT data as the SW does, since Wald and BS distributions are phenomenologically and mathematically related [see Desmond (1986) for a context of material fatigue]. Specifically, set for simplicity in Eq. (1), and let be a Brownian motion with diffusion coefficient equal to . Then, the exact CDF of (2) is given by:
| 7 |
where and (Wald 1947). Its expectation and variance are given by and respectively. If we apply the change and , we have that the first term on the right-hand side of (7) is equal to (4), and the second term is equal to:
where . This last term introduces the difference (alteration) between the BS and Wald distributions as an augmented first exceedance distribution (Leiva et al. 2015). Using this parametrization, we can find that the expectation and variance of the Wald distribution is given by and respectively, differing from the expectation and variance of the BS distribution in and respectively. Thus, the BS distribution approaches the Wald distribution when is small. In Tejo and Niklitschek-Soto (2016) it is mentioned that when is a Brownian motion with diffusion coefficient equal to , the BS distribution will be also a good model for the FPT when:
| 8 |
since it will imply a small value of . Also in such a context, the lognormal PDF resembles that of the Wald and the BS PDFs (Kish et al. 2015), but there is no specific mathematical relationship between the lognormal distribution and the Wald and BS distributions.
Finally, we should mention that although the SBS is not longer suitable as an explicative model when the latent cognitive process shown in (1) does not present a clear upward trend, it could still provide good fits (i.e., it could still be a good quantitative measurement distribution), as reported by Leiva et al. (2015) for ISI data; a type of data much akin to RT data. [For further properties of the SBS, see Leiva et al. (2011).]
We account for two sources of RT data in order to show the performance of our fatigue-life models:
The data set published by Goujon and Fagot (2013) in their Appendix are used to illustrate how well fatigue-life distributions fit RT data. In their study, baboons performed a visual search task with contextual cues. Baboons searched for a target letter (letter “T”) embedded within configurations of distracters (letters “L”). In some of the displays letters were arranged to facilitate the prediction of the target localization and in other displays localization was hindered by shuffling and baboons responded by touching the target letter on the display screen. The first data set (DS1) corresponds to the mean RTs in the “shuffled” condition and the second data set (DS2) corresponds to the mean RTs in the “predictive” condition (here we are tacitly assuming that within each condition, the mean RTs are IID in all cells). Since our fatigue-life distributions are closed under averages, we expect them to provide good fits for these data. In Figs. 2 and 3 the results are presented.
The data set of experiment 4 in Suarez et al. (2015). In their study, participants (18 participants [mean age 25 years, range 20–30 years old]; 10 women) were required to press the right or the left response button depending on the color of the LED, as fast and as accurately as possible. Once the white LED lighted, participants initiated the trial onset by briefly pressing the knee-device. As soon as they pressed it, the central blue LED, serving as a fixation point and as a warning signal, lighted up. After a variable delay (ranging from 250 to 600 ms) following the warning signal, one of the two lateral LEDs lighted up either in green or red. Participants had to briefly press a response button as quickly as possible with the left or the right thumb according to the color of the LED. After a delay of 300 ms following the response, the white LED lighted up again and a new trial could be initiated. Within each block, there were 48 green and 48 red stimuli and for each color, there were 24 congruent trials and 24 incongruent trials. Participants performed 2 blocks of 96 trials each. From this data set we used data in two blocks of trials (DS3 and DS4). In both blocks, participants were required to respond with the left hand to a red LED, regardless of where the light appeared (here condition RI), but when the red LED appeared on the right (stim 4) the participant responded with the left hand (resp 2). In Figs. 4 and 5 the results are presented.
Fig. 2.
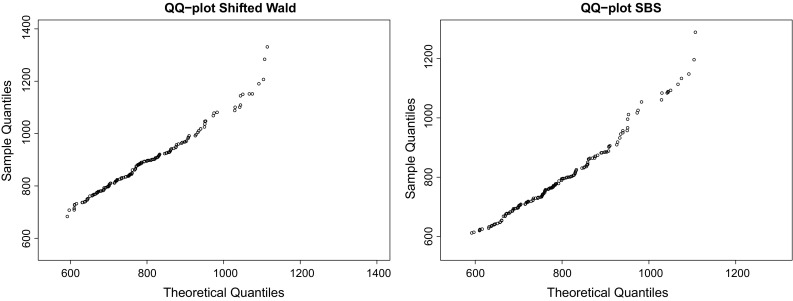
QQ plots of SW and SBS distributions for DS1 (from left to right), whose coefficients of determination were in both cases. This shows that the SBS can also be considered as a good candidate to fit RT data. According to the parametrization shown in (6), the maximum likelihood estimators were and
Fig. 3.
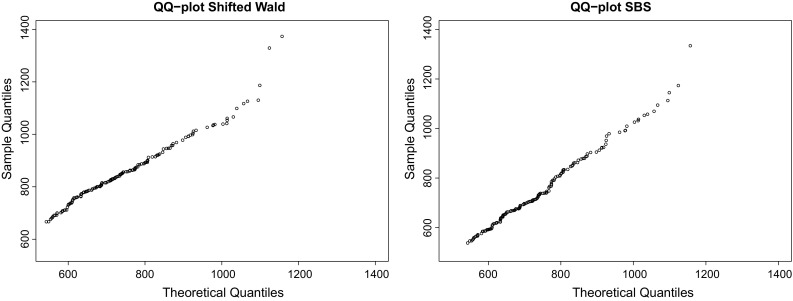
QQ plots of SW and SBS distributions for DS2 (from left to right), whose coefficients of determination were and , respectively. Again, this shows that the SBS can also be considered as a good candidate to fit RT data. For this case, the maximum likelihood estimators were and
Fig. 4.
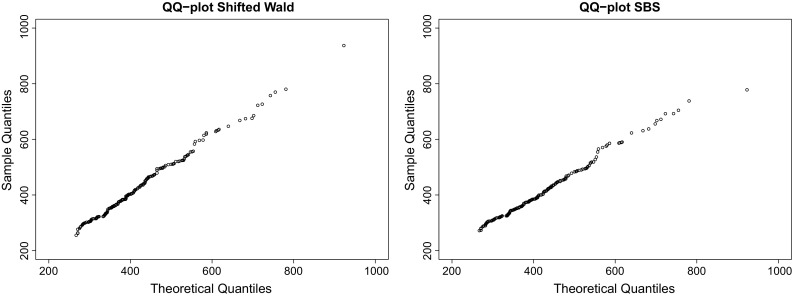
QQ plots of SW and SBS distributions for DS3 (from left to right), whose coefficients of determination were in both cases. This shows again the good performance of the SBS to describe RT data. According to the parametrization shown in (6), the maximum likelihood estimators were and
Fig. 5.
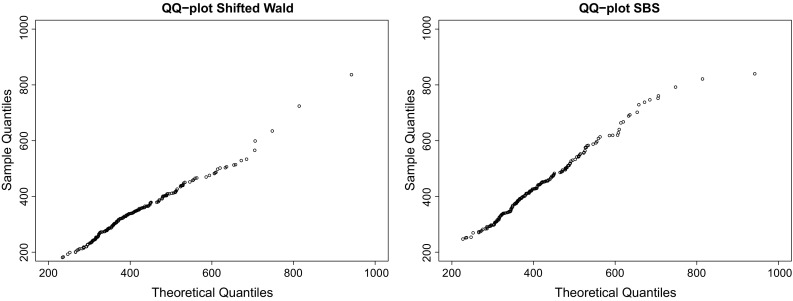
QQ plots of SW and SBS distributions for DS4 (from left to right), whose coefficients of determination were in both cases. Again, the good performance of the SBS for RT data is demonstrated. For this case, the maximum likelihood estimators were and
(An R code for estimating parameters and plotting is given in the Supplementary Material).
As final comments, we are aware that aside from SW distribution some other distributions are commonly used to model RT data, as the ex-Gaussian distribution [see e.g., Matzke and Wagenmakers (2009)] and the ex-Wald distribution (Schwarz 2001), which can perform better fits in some real RT data. Nevertheless, we focus on this two fatigue-life distributions since, despite appearing as good quantitative distribution measurements for RT data, they can be derivable under simple cognitive schemes like those represented by Eqs. (1) and (2). Although it is not clear how this latent process could be measured or fully rebuilt from the RT fits, we might recognize some aspects about it. For example, if we consider that the latent cognitive process follows what is shown in Eq. (1) with a Gaussian noise, we can have an idea about how increasing the latent cognitive process is by checking the size of . Also in this case, we have that is the coefficient of variation of the process (1) after , and therefore, we can use its estimates, and , to have an idea about the variability of the latent cognitive process and rebuilding an estimated rescaled version of it: , where and is a standard Brownian motion.
Electronic supplementary material
Below is the link to the electronic supplementary material.
Acknowledgements
This work is supported by funding from Universidad de Playa Ancha DGI Regular Project Grant and Project FONDECYT 1161023. The authors acknowledge Professor Isabel Suarez for providing us an important data set for our research and acknowledge the unknown referees for their very appreciable suggestions.
Footnotes
Electronic supplementary material
The online version of this article (10.1007/s11571-017-9473-x) contains supplementary material, which is available to authorized users.
References
- Abbott LF. Lapicque’s introduction of the integrate-and-fire model neuron (1907) Brain Res Bull. 1999;50(5):303–304. doi: 10.1016/S0361-9230(99)00161-6. [DOI] [PubMed] [Google Scholar]
- Anders R, Alario F-Xavier, Van Maanen L. The shifted Wald distribution for response time data analysis. Psychol Methods. 2016;21(3):309–327. doi: 10.1037/met0000066. [DOI] [PubMed] [Google Scholar]
- Birnbaum ZW, Saunders SC. A new family of life distributions. J Appl Probab. 1969;6(2):319–327. doi: 10.2307/3212003. [DOI] [Google Scholar]
- Blurton SP, Kesselmeier M, Gondana M. The first-passage time distribution for the diffusion model with variable drift. J Math Psychol. 2017;76:7–12. doi: 10.1016/j.jmp.2016.11.003. [DOI] [Google Scholar]
- Brown SD, Heathcote A. The simplest complete model of choice response time: linear ballistic accumulation. Cogn Psychol. 2008;57(3):153–178. doi: 10.1016/j.cogpsych.2007.12.002. [DOI] [PubMed] [Google Scholar]
- Desmond AF. On the relationship between two fatigue-life models. IEEE Trans Reliab. 1986;35(2):167–169. doi: 10.1109/TR.1986.4335393. [DOI] [Google Scholar]
- Fierro R, Leiva V, Ruggeri F, Sanhueza A. On a Birnbaum–Saunders distribution arising from a non-homogeneous Poisson process. Stat Probab Lett. 2013;83(4):1233–1239. doi: 10.1016/j.spl.2012.12.018. [DOI] [Google Scholar]
- Goujon A, Fagot J. Learning of spatial statistics in nonhuman primates: contextual cueing in baboons (Papio papio) Behav Brain Res. 2013;247:101–109. doi: 10.1016/j.bbr.2013.03.004. [DOI] [PubMed] [Google Scholar]
- Horrocks J, Thomson M. Modeling event times with multiple outcomes using the Wiener process with drift. Lifetime Data Anal. 2004;10(1):29–49. doi: 10.1023/B:LIDA.0000019254.29153.1a. [DOI] [PubMed] [Google Scholar]
- Kish EA, Granqvist CG, Dér A, Kish LB. Lognormal distribution of firing time and rate from a single neuron? Cogn Neurodyn. 2015;9(4):459–462. doi: 10.1007/s11571-015-9332-6. [DOI] [PMC free article] [PubMed] [Google Scholar]
- LaBerge D. A recruitment theory of simple behavior. Psychometrika. 1962;27(4):375–396. doi: 10.1007/BF02289645. [DOI] [Google Scholar]
- Leiva V. The Birnbaum–Saunders distribution. New York: Academic Press; 2015. [Google Scholar]
- Leiva V, Athayde E, Azevedo C, Marchant C. Modeling wind energy flux by a Birnbaum–Saunders distribution with an unknown shift parameter. J Appl Stat. 2011;38(12):2819–2838. doi: 10.1080/02664763.2011.570319. [DOI] [Google Scholar]
- Leiva V, Tejo M, Guiraud P, Schmachtenberg O, Orio P, Marmolejo-Ramos F. Modeling neural activity with cumulative damage distributions. Biol Cybern. 2015;109(4–5):421–433. doi: 10.1007/s00422-015-0651-9. [DOI] [PubMed] [Google Scholar]
- Matzke D, Wagenmakers EJ. Psychological interpretation of the ex-Gaussian and shifted Wald parameters: a diffusion model analysis. Psychon Bull Rev. 2009;16(5):798–817. doi: 10.3758/PBR.16.5.798. [DOI] [PubMed] [Google Scholar]
- Ratcliff R. A theory of memory retrieval. Psychol Rev. 1978;85(2):59–108. doi: 10.1037/0033-295X.85.2.59. [DOI] [Google Scholar]
- Ratcliff R, Tuerlinckx F. Estimating parameters of the diffusion model: approaches to dealing with contaminant reaction times and parameter variability. Psychon Bull Rev. 2002;9(3):438–481. doi: 10.3758/BF03196302. [DOI] [PMC free article] [PubMed] [Google Scholar]
- Schwarz W. The ex-wald distribution as a descriptive model of response times. Behav Res Methods Instr Comput. 2001;33(4):457–469. doi: 10.3758/BF03195403. [DOI] [PubMed] [Google Scholar]
- Suarez I, Vidal F, Burle B, Casini L. A dual-task paradigm to study the interference reduction in the Simon task. Exp Psychol. 2015;62(2):75–88. doi: 10.1027/1618-3169/a000275. [DOI] [PubMed] [Google Scholar]
- Tejo M, Niklitschek-Soto S. The membrane potential process of a single neuron seen as a cumulative damage process. Cogn Neurodyn. 2016;10(6):593–595. doi: 10.1007/s11571-016-9400-6. [DOI] [PMC free article] [PubMed] [Google Scholar]
- Usher M, Olami Z, McClelland JL. Hick’s law in a stochastic race model with speed–accuracy tradeoff. J Math Psychol. 2002;46(6):704–715. doi: 10.1006/jmps.2002.1420. [DOI] [Google Scholar]
- Wald A. Sequential analysis. New York: Wiley; 1947. [Google Scholar]
Associated Data
This section collects any data citations, data availability statements, or supplementary materials included in this article.


