

Abstract
Background
Septin 9 (SEPT9) and short stature homeobox 2 (SHOX2) methylation in circulating cell-free DNA (ccfDNA) are powerful biomarkers for colorectal cancer (CRC) screening, as well as head and neck squamous cell carcinoma staging and monitoring. In the present study, we investigated SEPT9 and SHOX2 ccfDNA methylation as auxiliary pre and post-therapeutic staging parameters in CRC patients.
Methods
ccfDNA methylation was quantified in 184 prospectively enrolled patients prior to and 3–10 days after surgery, and biomarker levels were associated with clinico-pathological parameters.
Results
Pre-therapeutic levels of SHOX2 and SEPT9 ccfDNA methylation were strongly associated with Union for International Cancer Control (UICC) stages, tumour (T), nodal (N), and metastasis (M) categories, and histological grade (all P ≤ 0.001), as well as lymphatic invasion and extracapsular lymph node extension (all P< 0.05). Post-therapeutic SHOX2 and SEPT9 ccfDNA methylation levels correlated with UICC stage (all P <0.01). SEPT9 ccfDNA methylation further allowed for an accurate pre- and post-therapeutic detection of distant metastases (AUCpre-therapeutic = 0.79 (95%CI 0.69–0.89), AUCpost-therapeutic = 0.93 (95% CI 0.79–1.0)).
Conclusions
DNA methylation analysis in plasma is a powerful pre and post-therapeutic diagnostic tool for CRC and may add valuable information to current TNM staging, thereby holding the potential to assist in the development of individually tailored treatment protocols.
Subject terms: Diagnostic markers, Colorectal cancer
Introduction
Despite dramatic reductions in overall incidence and mortality, colorectal cancer (CRC) remains the third most commonly diagnosed cancer in both men and women in the United States.1 Current treatment algorithms are based on three pillars: surgery, (radio-)chemotherapy, and targeted therapy.2 The clinical management of CRC is mainly determined by the Union for International Cancer Control (UICC)/TNM stage and distinct genetic biomarkers (e.g., mismatch repair proteins or epidermal growth factor receptor (EGFR) status).3 The mainstay of curative therapy for stage I/II CRC is surgical resection; however, there is an ongoing debate as to whether adjuvant chemotherapy may be beneficial for a subgroup of stage II patients with high-risk features.4,5 Although clinical staging and, as a consequence, treatment decisions are predominantly guided by radiologic imaging,6 the ability of up-to-date imaging modalities to identify systemic tumour burden is still far from optimal. Up to 25% of liver metastases smaller than 10 mm, for instance, might be not be detected,7 and patients would accordingly be significantly undertreated. A validated blood-based biomarker for CRC may help to identify patients with radiologically undetectable (micro-)metastases, who would benefit from neoadjuvant therapy or intensified treatment algorithms.8
For CRC patients with synchronous resectable metastases, the National Comprehensive Cancer Network (NCCN) currently suggests neoadjuvant therapy followed by operative and adjuvant treatment.9 Nonetheless, long-term benefits of neoadjuvant treatment has to been weighed against an increased perioperative morbidity and the limitation for adjuvant chemotherapy in case of recurrence.10 Post-therapeutic detection of (occult) metastases or residual disease might allow for an early initiation of a palliative treatment. Blood-based biomarkers that might further assist in treatment decisions are therefore urgently needed.
Attributable to its stability and cancer specific alteration, DNA methylation has emerged as a promising source for tumour biomarkers. Moreover, tumour-derived circulating cell-free DNA (ccfDNA) with epigenetic aberrations can be reliably assessed against a background of non-tumourous ccfDNA with high precision; thereby adding valuable information on prognosis, diagnosis, and putative response to treatment.11,12 Promoter hypermethylation of septin 9 (SEPT9) has previously been confirmed as a potent biomarker in various cancers including CRC and its precursor lesions.13–18 As a consequence, SEPT9 methylation in ccfDNA has recently received approval by the U.S. Food and Drug Administration (FDA) as first blood-based CRC screening test. In accordance, promoter methylation of short stature homeobox 2 (SHOX2) has shown excellent results in screening and diagnosis of lung cancer patients.19–21 Quantitative SHOX2 and SEPT9 methylation levels have been successfully applied for the diagnosis of colonic adenomas,16 the detection of malignant cells in pleural effusions and ascites,22,23 and very recently, for the diagnosis, prognosis, and molecular staging of head and neck squamous cell carcinomas (HNSCC).15 In the latter study, methylation levels of both biomarkers were significantly associated with nodal (N) and tumour (T) categories as well as histopathologic grade.15 In addition, tumour recurrence and the diagnosis of a second malignancy were detected almost one year prior to clinical or radiologic appearance and provided a strong prognostic biomarker which was independent of TNM. Methylation testing in HNSCC proved to be a valid and extremely powerful diagnostic tool for molecular disease staging, risk stratification, and disease monitoring and, once established in clinical routine, might positively influence the outcome of many patients.
The present study prospectively explores the value of quantitative SEPT9 and SHOX2 methylation levels in ccfDNA for disease staging of CRC patients in addition to current TNM staging system and along with the established serum biomarkers carcinoembryonic antigen (CEA) and carbohydrate antigen 19–9 (CA 19–9).
Patients and Methods
Patients and study design
Patients
A total of 184 CRC patients treated at the Departments of Visceral Surgery at the University Hospital of Bonn and the Marien-Hospital Bonn (Germany) between November 2013 and December 2016 were prospectively enrolled in the present study. In addition, 395 primary colorectal adenocarcinomas and 45 normal adjacent tissues from The Cancer Genome Atlas (TCGA) Research Network (http://cancergenome.nih.gov/.) were included and analysed retrospectively.
Inclusion criteria
All patients presented with histologically confirmed primary adenocarcinoma of the colorectum. All prospectively enrolled patients had a history free of a second malignancy of at least 3 years. Blood samples were taken prior to (pre-therapeutic samples) and 3–10 days after surgery (post-therapeutic samples) except for neoadjuvantly treated patients from whom pre-therapeutic samples were taken prior to neoadjuvant treatment. Supplemental Fig. 1 shows a CONSORT diagram of the enrollment strategy and available biomarker results of the prospective study arm. The study protocol was approved by the ethics committee of the University Hospital Bonn (vote no. 222/13). All patients had provided written informed consent.
Sample preparation and SEPT9 and SHOX2 methylation quantification
EDTA-stabilised blood plasma (3 mL) was prepared, and quantitative DNA methylation analysis of ccfDNA was performed as described in detail earlier.15 Plasma was prepared within 8 h after blood sampling in order to ensure sample stability.24 Patients’ samples were classified as ccfDNA methylation-positive using previously validated cut-offs (SHOX2: 0.25%, SEPT9: 0.075%).15
Methylation results obtained from the TCGA Research Network were generated using the Infinium HumanMethylation450 BeadChip (Illumina, Inc., San Diego, CA, USA). M-values from the TCGA Colon and Rectal Cancer (COAD/READ=CRAD) cohort were downloaded from the UCSC Xena browser (http://xena.ucsc.edu) and analysed. The two beads cg12783819 and cg12993163, that hybridise to CpG-sites within the target region of the SEPT9 and SHOX2 qPCR assays, were evaluated.15
CEA and CA 19-9 quantification
CEA and CA 19–9 serum levels were determined using ADVIA Centaur CEA and ADVIA Centaur CA 19–9 tests (Siemens Healthineers GmbH, Erlangen, Germany). Serum testing was performed by SYNLAB laboratories (SYNLAB International GmbH, Munich, Germany). Positivity was defined using broadly accepted cut-offs (CEA: 5 ng/mL, CA 19–9: 37 U/mL).25–27 For statistical analyses, biomarker levels below the lower limits of quantification reported as ≤0.5 ng/mL (CEA) and ≤1.2 U/mL (CA 19–9) were set to 0.5 ng/mL and 1.2 U/mL, respectively.
Statistical analyses
Kruskal–Wallis tests, Spearman’s rank correlations, paired t tests, and Wilcoxon–Mann–Whitney U tests were performed to analyse biomarker levels. Median methylation levels were reported including Interquartile Ranges (IQR). Two-sided P-values <0.05 were considered statistically significant. The Area Under the Curve (AUC) of the Receiver Operating Characteristic (ROC) was computed as a measure of test diagnostic accuracy. AUCs were reported including 95% confidence intervals (95% CIs).
Results
SHOX2 and SEPT9 DNA methylation in CRC tissue
Methylation levels of 395 primary CRC and 45 solid normal adjacent tissues from the TCGA Research Network were analysed. SHOX2 and SEPT9 were found to be hypermethylated in tumour tissues compared to normal adjacent tissues (diagnostic accuracy: AUCSEPT9 = 0.94, 95% CI [0.90–0.97], AUCSHOX2 = 0.76, 95% CI [0.71–0.80], P < 0.001; Fig. 1). Of note, a group of CRC tissue samples exhibited SHOX2 methylation levels below those of normal adjacent tissues (Fig. 1) leading to a significantly lower AUC compared to SEPT9.
Fig. 1.

SEPT9 and SHOX2 DNA methylation levels in colorectal cancer and normal tissue. SEPT9 (a) and SHOX2 (b) methylation levels in primary colorectal tumours (n = 395) and normal solid tissue (n = 45). Each rhombus reflects one sample measurement. Median values are given (black bars). P-values refer to Mann–Whitney U test. Receiver Operating Characteristic (ROC) of SEPT9 and SHOX2 methylation for the discrimination between colorectal cancer and normal tissues (c)
SHOX2 and SEPT9 ccfDNA methylation in plasma for molecular staging prior to treatment
A total of 184 CRC patients were prospectively enrolled in our study cohort. Patients’ characteristic and clinico-pathological features are described in detail in Tables 1 and 2. Furthermore, detailed patient and sample-specific clinico-pathologic parameters and biomarker levels are summarised in Supplemental Table 1. Pre-therapeutic SEPT9 and SHOX2 ccfDNA methylation levels were available for 155 out of 184 patients (84.2%). Quantitative methylation levels prior to surgery were significantly associated with UICC stage, TNM categories, histological grade, extracapsular lymph node extension, and lymphatic invasion (all P < 0.05) but not with tumour localisation and vascular invasion (all P > 0.05, Tables 2 and 3). Most interestingly, ccfDNA methylation levels of SEPT9 were stage-dependent and showed a stepwise increase in UICC-stages (I-IV), local tumour stages (T1–T4), nodal status (N0-N2), histopathologic grades (G1–G3), and lymphatic invasion (L0–L1). A significant difference of SEPT9 methylation levels was further demonstrated between local tumour and systemic tumour burden (M0 vs. M1a) but not between one and multiple metastatic sites (M1a vs. M1b, Tables 2 and 3). While SEPT9 methylation levels revealed a significant increase from UICC stage I to II (P = 0.002) and stage III to IV (P = 0.001), no significant difference between stage II and III was detected (P = 0.50, Fig. 2a).
Table 1.
Patients’ characteristics
| Patient number | |
|---|---|
| All patients | 184 (100%) |
| Age | |
| ≤50 years | 12 (6.5%) |
| 51–60 years | 33 (17.9%) |
| >60 years | 139 (75.5%) |
| Median age (years) | 71 |
| Mean age (years) | 69.3 |
| Age range (years) | 26–90 |
| Gender | |
| Female | 86 (46.7%) |
| Male | 98 (53.3%) |
| Smoking and drinking habits | |
| Non-smokers | 134 (72.8%) |
| Smokers (current and former) | 46 (25.0%) |
| Unknown smoking status | 4 (2.2%) |
| Range pack/years | 0–80 |
| Median pack/years (smokers only) | 0 |
| Mean pack/years (smokers only) | 7.9 |
| Non-alcoholic | 158 (85.9%) |
| Alcoholic | 22 (12.0%) |
| Unknown alcohol consumption | 4 (2.2%) |
| Pre-existing conditions | |
| None | 19 (10.3%) |
| Diseases of cardiovascular system | 111 (60.3%) |
| Diseases of respiratory system | 19 (10.3%) |
| Diseases of metabolism or endocrinological system | 78 (42.4%) |
| Diseases of kidney and urinary tract | 10 (5.4%) |
| Diseases of hepatic and biliary system | 35 (19.0%) |
| Pancreatic diseases | 3 (1.6%) |
| Neurological and psychiatric diseases | 19 (10.3%) |
| Haematological diseases | 4 (2.2%) |
| Rheumatologic diseases | 4 (2.2%) |
| Skin diseases | 2 (1.1%) |
| Skeletal diseases | 10 (5.4%) |
| Ophthalmologic diseases | 4 (2.2%) |
| Infectious diseases | 4 (2.2%) |
| Diseases of genital tract | 19 (10.3%) |
| Colon adenoma | 32 (17.4%) |
| Colon polyp | 23 (12.5%) |
| Colon and sigma diverticulosis | 37 (20.1%) |
| Inflammatory colon diseases | 1 (0.5%) |
| FAP or HNPCC | 1 (0.5%) |
| Reflux, Barrett’s oesophagus, gastrointestinal ulcers | 30 (16.3%) |
| Anorectal diseases | 8 (4.3%) |
| Status after other malignant tumoursa | 18 (9.8%) |
| Status after other benign tumours | 3 (1.6%) |
Characteristics of the CRC patient cohort (184 patients). First-line treatment of CRC patients consisted of surgery in 56% (103/184), surgery and adjuvant radio-chemotherapy in 2% (4/184), surgery and adjuvant chemotherapy in 31% (57/184), surgery and adjuvant radiotherapy in 0.5% (1/184), surgery and neoadjuvant radiotherapy in 0.5% (1/184), surgery and neoadjuvant radio and adjuvant chemotherapy in 0.5% (1/184), surgery and neoadjuvant chemo- and adjuvant radio-chemotherapy in 8% (15/184) or definitive chemotherapy in 1% (2/184)
aCases: breast cancer (n = 4), cervix cancer (n = 1), prostate cancer (n = 2), colorectal cancer (n = 3), bladder cancer (n = 2), lung cancer (n = 2), renal cell carcinoma (n = 2), melanoma (n = 2), head and neck cancer (n = 1), thyroid carcinoma (n = 1)
Table 2.
Clinico-pathological parameters and SHOX2 and SEPT9 methylation levels prior to treatment
| Clinico-pathological parameters | Total number (n) | Methylation in plasma prior to treatment | ||||
|---|---|---|---|---|---|---|
| Number (n) | Median SEPT9 (%); IQR | Spearman’s ρ, P-valuea | Median SHOX2 (%); IQR | Spearman’s ρ, P-valuea | ||
| All CRC cases | 184 (100%) | 155 (100%) | ||||
| Localisation | ||||||
| Caecum | 34 (18.5%) | 33 (21.3%) | 0.061; 0.37 | 0.072; 0.19 | ||
| Ascending colon | 33 (17.9%) | 30 (19.4%) | 0.031; 0.25 | 0.036; 0.15 | ||
| Transverse colon | 13 (7.1%) | 8 (5.2%) | 0.009; 0.08 | 0.009; 0.05 | ||
| Descending colon | 10 (5.4%) | 9 (5.8%) | 0.155; 21.87 | 0.013; 7.99 | ||
| Sigmoid colon | 44 (23.9%) | 39 (25.2%) | 0.055; 0.47 | 0.033; 0.12 | ||
| Rectum | 43 (23.4%) | 30 (19.4%) | 0.161; 0.74 | P = 0.52 | 0.068; 0.25 | P = 0.40 |
| Othersc | 7 (3.8%) | 6 (3.9%) | 0.616; 2.99 | 0.156; 0.35 | ||
| Primary tumour (T) category | ||||||
| Tis | 1 (0.5%) | 0 (0.0%) | N/A | N/A | ||
| T1 | 14 (7.6%) | 8 (5.2%) | 0.000; 0.01 | 0.029; 0.10 | ||
| T2 | 30 (16.3%) | 27 (17.4%) | 0.016; 0.19 | 0.014; 0.09 | ||
| T3 | 103 (56.0%) | 92 (59.3%) | 0.123; 0.65 | ρ = 0.28 | 0.044; 0.21 | ρ = 0.25 |
| T4 | 30 (16.3%) | 24 (15.5%) | 0.188; 0.80 | P < 0.001 | 0.131; 0.21 | P = 0.002 |
| N/Ab | 6 (3.3%) | 4 (2.6%) | 0.413;0.58 | 0.023; 0.07 | ||
| Regional node (N) category | ||||||
| N0 | 97 (52.7%) | 89 (57.4%) | 0.037; 0.25 | 0.032; 0.10 | ||
| N1 | 41 (22.3%) | 36 (23.2%) | 0.150; 0.59 | ρ = 0.28 | 0.071; 0.27 | ρ = 0.29 |
| N2 | 27 (14.7%) | 25 (16.1%) | 0.393; 4.22 | P = 0.001 | 0.171; 1.16 | P < 0.001 |
| Nx | 19 (10.3%) | 5 (3.2%) | 0.109; 0.63 | 0.000; 0.05 | ||
| Distant metastasis (M) category | ||||||
| M0 | 159 (86.4%) | 132 (85.2%) | 0.049; 0.28 | 0.037; 0.14 | ||
| M1a | 18 (9.8%) | 16 (10.3%) | 2.231; 4.18 | 0.296; 1.36 | ||
| M1b | 7 (3.8%) | 7 (4.5%) | 0.393; 10.64 | P < 0.001 | 0.121; 1.25 | P = 0.001 |
| Histopathological grade | ||||||
| G1 | 9 (4.9%) | 9 (5.8%) | 0.000; 0.10 | 0.017; 0.05 | ||
| G2 | 134 (72.8%) | 117 (75.5%) | 0.055; 0.35 | ρ = 0.32 | 0.049; 0.14 | ρ = 0.26 |
| G3 | 28 (15.2%) | 23 (14.8%) | 0.661; 4.45 | P < 0.001 | 0.184; 1.28 | P = 0.001 |
| N/Ab | 13 (7.1%) | 6 (3.9%) | 0.074; 28.79 | 0.164; 13.89 | ||
| Lymphatic invasion (L) | ||||||
| L0 | 121 (65.8%) | 102 (65.8%) | 0.041; 0.25 | 0.037; 0.12 | ||
| L1 | 53 (28.8%) | 46 (29.7%) | 0.215; 1.12 | P = 0.005 | 0.092; 0.29 | P = 0.033 |
| N/Ab | 10 (5.4%) | 7 (4.5%) | 0.319; 24.01 | 0.228; 10.30 | ||
| Vascular invasion (V) | ||||||
| V0 | 158 (85.9%) | 134 (86.5%) | 0.071; 0.53 | 0.043; 0.16 | ||
| V1 | 13 (7.1%) | 11 (7.1%) | 0.184; 0.39 | P = 0.86 | 0.079; 0.18 | P = 0.20 |
| N/Ab | 13 (7.1%) | 10 (6.4%) | 0.090; 7.39 | 0.050; 3.18 | ||
| Surgical margin (R) | ||||||
| R0 | 175 (95.1%) | 148 (95.5%) | 0.071; 0.47 | 0.049; 0.16 | ||
| R1 | 6 (3.3%) | 4 (2.6%) | 0.214; 1.61 | P = 0.66 | 0.126; 0.74 | P = 0.38 |
| R2 | 0 (0.0%) | 0 (0.0%) | N/A | N/A | ||
| N/Ab | 3 (1.6%) | 3 (1.9%) | 24.036; N/A | 10.301; N/A | ||
| UICC stage | ||||||
| I | 37 (20.1%) | 29 (18.7%) | 0.000; 0.04 | 0.008; 0.08 | ||
| II | 64 (34.8%) | 58 (37.4%) | 0.083; 0.31 | 0.034; 0.16 | ||
| III | 48 (26.1%) | 43 (27.7%) | 0.125; 0.56 | ρ = 0.41 | 0.078; 0.22 | ρ = 0.32 |
| IV | 25 (13.6%) | 23 (14.8%) | 1.845; 4.34 | P < 0.001 | 0.171; 1.25 | P < 0.001 |
| N/Ab | 10 (5.4%) | 2 (1.3%) | 0.104; N/A | 0.023; N/A | ||
| Extracapsular lymph node extension (ece) | ||||||
| ece−/N0 | 129 (70.1%) | 106 (68.4%) | 0.041; 0.25 | 0.034; 0.13 | ||
| ece+ | 31 (16.8%) | 26 (16.8%) | 0.606; 3.24 | 0.143; 0.48 | ||
| N/Ab | 24 (13.0%) | 23 (14.8%) | 0.180; 1.82 | P = 0.001 | 0.049; 0.80 | P = 0.016 |
Clinico-pathological parameters of the CRC patient cohort (184 patients) and association with SHOX2 and SEPT9 plasma DNA methylation levels prior to treatment. Methylation levels prior to treatment were available for 155/184 patients.
aP-values refer to the following tests: Wilcoxon–Mann–Whitney U test (R0 vs. R1,2; L0 vs. L1; V0 vs. V1; M0 vs. M1a,1b; ece+ vs. ece−), Spearman’s rank correlation (T category, N category, UICC stage, G), ANOVA (tumour localisation),
bN/A data not available.
cOthers (descending and sigmoid colon, rectosigmoid transition)
Table 3.
Association of clinico-pathological parameters with SHOX2 and SEPT9 plasma DNA methylation levels after treatment
| Clinico-pathological parameters | Methylation in plasma after treatment | ||||
|---|---|---|---|---|---|
| Number (n) | Median SEPT9 (%); IQR | Spearman’s ρ, P-valuea | Median SHOX2 [%]; IQR | Spearman’s ρ, P-valuea | |
| All CRC cases | 108 (100%) | ||||
| Localisation | |||||
| Caecum | 19 (17.6%) | 0.008; 0.04 | 0.010; 0.03 | ||
| Ascending colon | 20 (18.5%) | 0.001; 0.03 | 0.006; 0.03 | ||
| Transverse colon | 7 (6.5%) | 0.000; 0.02 | 0.022; 0.06 | ||
| Descending colon | 6 (5.6%) | 0.003; 0.01 | 0.012; 0.01 | ||
| Sigmoid colon | 32 (29.6%) | 0.003; 0.03 | 0.014; 0.04 | ||
| Rectum | 20 (18.5%) | 0.000; 0.03 | P = 0.84 | 0.008; 0.02 | P = 0.56 |
| Othersc | 4 (3.7%) | 0.005; 0.03 | 0.055; 0.06 | ||
| Primary tumour (T) category | |||||
| Tis | 1 (0.9%) | N/A | N/A | ||
| T1 | 8 (7.4%) | 0.002; 0.03 | 0.007; 0.01 | ||
| T2 | 16 (14.8%) | 0.000; 0.01 | 0.004; 0.03 | ||
| T3 | 60 (55.6%) | 0.003; 0.02 | ρ = 0.13 | 0.010; 0.03 | ρ = 0.31 |
| T4 | 20 (18.5%) | 0.008; 0.04 | P = 0.20 | 0.034; 0.07 | P = 0.001 |
| N/Ab | 3 (2.8%) | N/A | 0.000; N/A | ||
| Regional node (N) category | |||||
| N0 | 53 (49.1%) | 0.001; 0.02 | 0.010; 0.03 | ||
| N1 | 25 (23.1%) | 0.000; 0.01 | ρ = 0.088 | 0.016; 0.04 | ρ = 0.21 |
| N2 | 16 (14.8%) | 0.030; 2.24 | P = 0.40 | 0.058; 0.26 | P = 0.047 |
| Nx | 14 (13.0%) | 0.002; 0.02 | 0.006; 0.01 | ||
| Distant metastasis (M) category | |||||
| M0 | 97 (89.8%) | 0.000; 0.01 | 0.009; 0.03 | ||
| M1a | 9 (8.3%) | 0.604; 20,22 | 0.115; 4.21 | ||
| M1b | 2 (1.9%) | 0.413; N/A | P < 0.001 | 0.156; N/A | P < 0.001 |
| Histopathological grade | |||||
| G1 | 3 (2.8%) | 0.004; N/A | 0.013; N/A | ||
| G2 | 80 (74.1%) | 0.001; 0.03 | ρ = −0.016 | 0.009; 0.04 | ρ = 0.11 |
| G3 | 18 (16.7%) | 0.004; 0.05 | P = 0.88 | 0.020; 0.08 | P = 0.27 |
| N/Ab | 7 (6.5%) | 0.003; 0.01 | 0.011; 0.02 | ||
| Lymphatic invasion (L) | |||||
| L0 | 68 (63.0%) | 0.001; 0.01 | 0.009; 0.03 | ||
| L1 | 35 (32.4%) | 0.003; 0.05 | P = 0.22 | 0.018; 0.05 | P = 0.034 |
| N/Ab | 5 (4.6%) | 0.000; 0.05 | 0.008; 0.01 | ||
| Vascular invasion (V) | |||||
| V0 | 96 (88.9%) | 0.001; 0.02 | 0.010; 0.04 | ||
| V1 | 5 (4.6%) | 0.009; 1.69 | P = 0.11 | 0.020; 1.18 | P = 0.33 |
| N/Ab | 7 (6.5%) | 0.000; 0.00 | 0.008; 0.01 | ||
| Surgical margin (R) | |||||
| R0 | 106 (98.1%) | 0.001; 0.02 | 0.010; 0.03 | ||
| R1 | 2 (1.9%) | 1.676; N/A | P = 0.14 | 1.159; N/A | P = 0.73 |
| R2 | 0 (0.0%) | N/A | N/A | ||
| N/Ab | 0 (0.0%) | N/A | N/A | ||
| UICC stage | |||||
| I | 19 (17.6%) | 0.000; 0.01 | 0.008; 0.01 | ||
| II | 38 (35.2%) | 0.003; 0.02 | 0.011; 0.03 | ||
| III | 31 (28.7%) | 0.000; 0.01 | ρ = 0.27 | 0.012; 0.04 | ρ = 0.29 |
| IV | 11 (10.2%) | 0.604; 3.19 | P = 0.008 | 0.115; 2.30 | P = 0.003 |
| N/Ab | 9 (8.3%) | 0.003; 0.03 | 0.007; 0.01 | ||
| Extracapsular lymph node extension (ece) | |||||
| ece−/N0 | 77 (71.3%) | 0.001; 0.02 | 0.008; 0.02 | ||
| ece+ | 20 (18.5%) | 0.013; 0.64 | 0.024; 0.17 | ||
| N/Ab | 11 (10.2%) | 0.000; 0.01 | P = 0.023 | 0.012; 0.03 | P = 0.012 |
Methylation levels after treatment were available for 108/184 patients.
aP-values refer to the following tests: Wilcoxon−Mann−Whitney U test (R0 vs. R1,2; L0 vs. L1; V0 vs. V1; M0 vs. M1a,1b; ece+ vs. ece−), Spearman’s rank correlation (T category, N category, UICC stage, G), ANOVA (tumour localisation).
bN/A data not available.
cOthers (descending and sigmoid colon, rectosigmoid transition)
Fig. 2.

Stage-dependent pre-therapeutic biomarker levels. SEPT9 (a) and SHOX2 (b) ccfDNA methylation in plasma of stage I (n = 29), II (n = 58), III (n = 43), and IV (n = 23) colorectal cancer patients prior to surgery. CEA (c) and CA 19–9 (d) serum levels of stage I (CEA: n = 36; CA 19–9: n = 35), II (n = 62), III (n = 47), and IV (n = 24) patients before surgery. P-values refer to Wilcoxon Mann-Whitney U tests. Methylation levels below 0.01% were set to 0.01% in order to allow for a logarithmic illustration
Correspondingly, SHOX2 methylation levels showed a gradual increment between UICC-stages (I-IV), nodal status (N0-N2), histological grades (G1–G3), and lymphatic invasion (L0-L1). No stepwise increase was recorded for local tumour categories (T1-T4) and distant metastasis (M0-M1b, Tables 2 and 3). Sub-analysis of SHOX2 methylation levels in distinct UICC stages showed a significant increase from stage III to IV (P = 0.036) but no significant elevation from stage I to II (P = 0.33) and stage II to III (P = 0.26, Fig. 2b).
Our previous study on SHOX2 and SEPT9 methylation for diagnosis, staging, prognosis, and monitoring of HNSCC patients included 224 cancer-free control patients.15 In this analysis, the set cut-offs for SHOX2 (0.25%) and SEPT9 (0.075%) methylation resulted in a specificity of 95%, and values below cut-off were considered sporadic background methylation levels known to occur in blood from healthy individuals and patients with benign diseases.15 Applying these previously validated cut-offs, a total of 78/155 (50.3%) cancer patients were SEPT9-positive, whereas only 32/155 (20.6%, SHOX2), 36/178 (20.2%, CEA), and 22/177 patients (12.4%, CA 19–9) showed levels above the specific cut-offs of the other analysed biomarkers. We recorded positive SEPT9 methylation results in 4/29 (13.8%) UICC stage I, 29/58 (50.0%) stage II, 26/43 (60.5%) stage III, and 18/23 (78.3%) stage IV patients. Suspicious CEA levels were detected in 1/36 (2.8%) stage I, 13/62 (21.0%) stage II, 13/47 (27.7%) stage III, and 9/24 (37.5%) stage IV cases. SHOX2 methylation and CA 19–9 levels above the cut-off were only traceable in 10/23 (43.5%) and 7/24 (29.2%) stage IV patients.
Furthermore, SEPT9 methylation showed the best ability to discriminate between localised and metastasised disease detecting 18/23 CRC with distant metastases in our cohort (78.3%, AUC = 0.79, [95% CI 0.69–0.89], Fig. 3a). In contrast, regarding the other biomarkers only 9/24 (37.5%, CEA, AUC = 0.73, [95% CI 0.64–0.83]), 10/23 (43.5%, SHOX2, AUC = 0.72, [95% CI 0.61–0.84]), and 7/24 (29.2%, CA 19–9, AUC = 0.64, [95% CI 0.51–0.78]) showed suspicious test results in M1 patients. SEPT9 methylation also presented with the highest positivity rate in nodal-positive patients, although the capacity of all tested biomarkers was limited (SEPT9: 40/61 (65.6%); CEA: 21/66 (31.8%); SHOX2: 19/61 (31.1%); CA 19–9: 14/66 (21.2%)).
Fig. 3.

Detection of distant metastases—diagnostic accuracy. Receiver operating characteristic (ROC) of pre- (a) and post-therapeutic (b) ccfDNA methylation levels for the discrimination between metastasised (M1a, M1b; pre-therapeutic: n = 23 post-therapeutic: n = 11) and localised (M0; pre-therapeutic: n = 132, post-therapeutic: n = 97) colorectal cancers
Both SEPT9 and SHOX2 showed a strong correlation with levels of the established tumour biomarkers CEA and CA 19–9 (SEPT9/CEA: Spearman’s ρ = 0.270, P = 0.001; SEPT9/CA 19–9: ρ = 0.161, P = 0.049; SHOX2/CEA: ρ = 0.313, P < 0.001; SHOX2/CA 19–9: ρ = 0.215, P = 0.008).
CEA and CA 19-9 serum levels for CRC staging prior to treatment
Pre-therapeutic CEA and CA 19–9 serum levels were available for 178/184 (96.7%, CEA) and 177/184 patients (96.2%, CA 19–9), respectively. CEA showed a strong association with UICC stage, TNM, histological grade, extracapsular lymph node extension, vascular and lymphatic invasion (all P < 0.05) but not with tumour localisation (all P > 0.05, Table 4). In contrast, CA 19–9 expressed a significant relationship with UICC stage, nodal category, distant metastasis, histological grade, lymphatic invasion and extracapsular lymph node extension (all P < 0.05) but not with tumour localisation, T category and vascular invasion (all P > 0.05, Table 4).
Table 4.
Clinico-pathological parameters and CEA and CA 19–9 serum levels prior to treatment
| Clinico-pathological parameters | Total number (n) | CEA measurements (n) | Median CEA [%]; IQR | Spearman’s ρ, P-valueb | CA19-9 measurements (n) | Median CA19-9 [%]; IQR | Spearman’s ρ, P-valueb |
|---|---|---|---|---|---|---|---|
| All CRC cases | 184 (100%) | 178 (100%) | 177 (100%) | ||||
| Localisation | |||||||
| Caecum | 34 (18.5%) | 33 (18.5%) | 1.600; 2.75 | 33 (18.6%) | 11.90; 24.30 | ||
| Ascending colon | 33 (17.9%) | 32 (18.0%) | 1.700; 3.25 | 32 (18.1%) | 13.50; 19.33 | ||
| Transverse colon | 13 (7.1%) | 13 (7.3%) | 1.800; 3.75 | 13 (7.3%) | 10.00; 47.20 | ||
| Descending colon | 10 (5.4%) | 8 (4.5%) | 2.900; 11.50 | 8 (4.5%) | 11.30; 13.20 | ||
| Sigmoid colon | 44 (23.9%) | 43 (24.2%) | 1.800; 1.50 | 42 (23.7%) | 10.35; 12.18 | ||
| Rectum | 43 (23.4%) | 42 (23.6%) | 1.900; 2.28 | P = 0.43 | 42 (23.7%) | 9.900; 8.98 | P = 0.73 |
| Othersc | 7 (3.8%) | 7 (3.9%) | 8.200; 28.30 | 7 (4.0%) | 8.100; 18.30 | ||
| Primary tumour (T) category | |||||||
| Tis | 1 (0.5%) | 1 (0.6%) | N/A | 1 (0.6%) | N/A | ||
| T1 | 14 (7.6%) | 13 (7.3%) | 1.000; 0.95 | 13 (7.3%) | 7.500; 10.10 | ||
| T2 | 30 (16.3%) | 28 (15.7%) | 1.550; 1.68 | 27 (15.3%) | 11.300; 8.60 | ||
| T3 | 103 (56.0%) | 101 (56.7%) | 1.900; 1.85 | ρ = 0.39 | 101 (57.1%) | 11.60; 13.20 | ρ = 0.071 |
| T4 | 30 (16.3%) | 29 (16.3%) | 7.700; 18.65 | P = 0.001 | 29 (16.4%) | 9.900; 44.55 | P = 0.35 |
| N/Aa | 6 (3.3%) | 6 (3.4%) | 1.550; 3.63 | 6 (3.4%) | 6.500; 3.28 | ||
| Regional node (N) category | |||||||
| N0 | 97 (52.7%) | 95 (53.4%) | 1.600; 1.80 | 94 (53.1%) | 9.650; 11.45 | ||
| N1 | 41 (22.3%) | 39 (21.9%) | 2.100; 4.00 | ρ = 0.33 | 39 (22.0%) | 9.900; 12.40 | ρ = 0.27 |
| N2 | 27 (14.7%) | 27 (15.2%) | 2.900; 31.90 | P = 0.001 | 27 (15.3%) | 26.70; 43,60 | P = 0.001 |
| Nx | 19 (10.3%) | 17 (9.6%) | 1.500; 2.20 | 17 (9.6%) | 8.600; 9.15 | ||
| Distant metastasis (M) category | |||||||
| M0 | 159 (86.4%) | 154 (86.5%) | 1.700; 2.05 | 153 (86.4%) | 10.00; 11.75 | ||
| M1a | 18 (9.8%) | 17 (9.6%) | 2.600; 21.30 | P = 0.001 | 17 (9.6%) | 19.80; 105.0 | P = 0.026 |
| M1b | 7 (3.8%) | 7 (3.9%) | 4.400; 36.20 | 7 (4.0%) | 28.10; 32.90 | ||
| Histopathological grade | |||||||
| G1 | 9 (4.9%) | 8 (4.5%) | 1.650; 2.13 | 8 (4.5%) | 11.65; 10.75 | ||
| G2 | 134 (72.8%) | 131 (73.6%) | 1.800; 1.80 | ρ = 0.22 | 130 (73.4%) | 9.650; 12.38 | ρ = 0.24 |
| G3 | 28 (15.2%) | 27 (15.2%) | 2.900; 12.30 | P = 0.004 | 27 (15.3%) | 17.70; 39.90 | P = 0.002 |
| N/Aa | 13 (7.1%) | 12 (6.7%) | 1.700; 5.98 | 12 (6.8%) | 9.950; 9.95 | ||
| Lymphatic invasion (L) | |||||||
| L0 | 121 (65.8%) | 116 (65.2%) | 1.600; 1.80 | 115 (65.0%) | 9.200; 11.30 | ||
| L1 | 53 (28.8%) | 52 (29.2%) | 2.550; 6.50 | P = 0.001 | 52 (29.4%) | 17.05; 28.25 | P = 0.001 |
| N/Aa | 10 (5.4%) | 10 (5.6%) | 2.000; 9.30 | 10 (5.6%) | 9.700; 6.85 | ||
| Vascular invasion (V) | |||||||
| V0 | 158 (85.9%) | 153 (86.0%) | 1.700; 2.00 | 152 (85.9%) | 11.30; 14.58 | ||
| V1 | 13 (7.1%) | 12 (6.7%) | 5.05; 30.20 | P = 0.031 | 12 (6.8%) | 12.00; 743.55 | P = 0.49 |
| N/Aa | 13 (7.1%) | 13 (7.3%) | 2.100; 9.65 | 13 (7.3%) | 9.500; 9.40 | ||
| Surgical margin (R) | |||||||
| R0 | 175 (95.1%) | 170 (95.5%) | 1.800; 2.10 | 169 (95.5%) | 11.30; 13.60 | ||
| R1 | 6 (3.3%) | 5 (2.8%) | 8.30; 129.20 | P = 0.018 | 5 (2.8%) | 9.90; 2680.00 | P = 0.91 |
| R2 | 0 (0.0%) | 0 (0.0%) | N/A | 0 (0.0%) | N/A | ||
| N/Aa | 3 (1.6%) | 3 (1.7%) | 9.900; N/A | 3 (1.7%) | 6.200; N/A | ||
| UICC stage | |||||||
| I | 37 (20.1%) | 36 (20.2%) | 1.350; 1.65 | 35 (19.8%) | 10.00; 10.00 | ||
| II | 64 (34.8%) | 62 (34.8%) | 1.750; 3.28 | 62 (35.0%) | 9.050; 11.28 | ||
| III | 48 (26.1%) | 47 (26.4%) | 2.300; 4,60 | ρ = 0.39 | 47 (26.6%) | 14.10; 20.20 | ρ = 0.22 |
| IV | 25 (13.6%) | 24 (13.5%) | 2.850; 33.42 | P = 0.001 | 24 (13.6%) | 19.90; 57.10 | P = 0.005 |
| N/Aa | 10 (5.4%) | 9 (5.1%) | 0.900; 1.00 | 9 (5.1%) | 8.600; 6.65 | ||
| Extracapsular lymph node extension (ece) | |||||||
| ece-/N0 | 129 (70.1%) | 123 (69.1%) | 1.600; 1.80 | 122 (68.9%) | 9.450; 11.25 | ||
| eced | 31 (16.8%) | 31 (17.4%) | 2.900; 28.30 | P = 0.001 | 31 (17.5%) | 23.80; 41.50 | P = 0.001 |
| N/Aa | 24 (13.0%) | 24 (13.5%) | 2.250; 6.25 | 24 (13.6%) | 13.30; 10.10 | ||
Clinico-pathological parameters of the CRC patient cohort (184 patients) and association with CEA and CA 19–9 serum levels. Serum levels prior to treatment were available for 178/184 patients (CEA) and 177/184 patients (CA 19–9)
aN/A: data not available
bP-values refer to the following tests: Wilcoxon–Mann–Whitney test (R0 vs. R1,2; L0 vs. L1; V0 vs. V1; M0 vs. M1a,1b; ece + vs. ece-), Spearman’s rank correlation (T category, N category, UICC stage, G), ANOVA (tumour localisation)
cOthers (descending and sigmoid colon, rectosigmoid transition)
dSignificant feature
Similar to the methylation biomarkers described above, median CEA blood levels rose from local to more invasive or systemic disease (UICC stage, TNM, histological grade, lymphatic and vascular invasion and extracapsular lymph node extension). Sub-analysis of CEA levels showed an increase from UICC stage I to II (P = 0.036), whereas no significant difference between stage II and III (P = 0.078) or stage III and IV could be detected (P = 0.12, Fig. 2c).
CA 19–9 also showed a gradual increase of median blood levels in relation to nodal category, distant metastasis, lymphatic and vascular invasion, and extracapsular lymph node extension but not for T category, UICC-stage, and histological grade (Table 4). Sub-analysis of CA 19–9 levels revealed a significant increase from UICC stage II to III (P = 0.033) but no higher median CA 19–9 level from stage I to II (P = 0.67) and stage III to IV (P = 0.30, Fig. 2d).
SHOX2 and SEPT9 ccfDNA methylation in plasma after surgical treatment
Matched pre- and post-therapeutic cffDNA methylation results were available for 79 patients. In these patients, the mean total ccfDNA concentration in plasma quantified via the ACTB reference assay showed a significant 2.63-fold increase from 16.9 ng/3 mL to 44.5 ng/3 mL plasma after therapy (paired t test, P < 0.001). Post-therapeutic SHOX2 and SEPT9 ccfDNA methylation in matched samples from individual patients, however, showed a trend towards decreased levels in 70 patients with localised (M0, SEPT9: P = 0.089, SHOX2: P = 0.13) disease and no decrease in 9 patients with distant metastases (M1, SEPT9: P = 0.67, SHOX2: P = 0.52) (Fig. 4). The analysis of all patients enrolled, including unmatched patient samples, revealed that median SEPT9 methylation levels dropped to barely traceable amounts 3–10 days after surgical tumour removal (Tables 2 and 3 and Fig. 5a, b). Patients with single (M1a) and multiple distant metastases (M1b) (M0: 3/97 (3.1 %) vs. M1a/b: 10/11 (90.9%), P < 0.001), UICC stage IV (stage I: 18/19 (94.7%), stage II: 38/38 (100%) and stage III 30/31 (96.8%) vs. IV: 10/11 (90.9%), P < 0.001) and positive resection margins (R1), however, still showed post-therapeutic ccfDNA methylation positivity (Fig. 5a, b). SHOX2 methylation levels were also elevated after resection in stage IV patients (4/11 (36.4%)) with a low positivity rate in all other stages (stage I: 0/19 (0%), stage II: 1/38 (2.6%) and stage III 1/31 (3.2%)) but compared to SEPT9 methylation levels, only a small portion of M1a/M1b patients (4/11, 36.4%) showed post-therapeutic SHOX2-positivity, while 2/97 (2.1%) M0 patients were SHOX2-positive. Consequently, post-therapeutic SEPT9 ccfDNA methylation was shown to reliably discriminate between metastasised and localised disease with high diagnostic accuracy (AUC = 0.93 [95% CI 0.79–1.0], Fig. 3b).
Fig. 4.
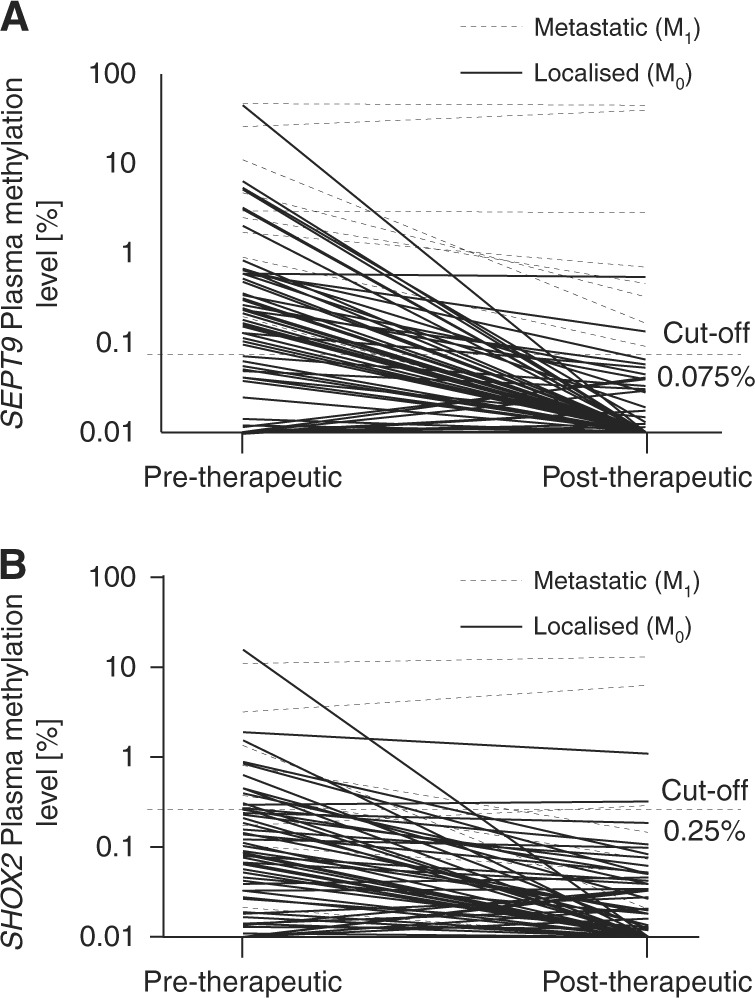
Pre and post-therapeutic ccfDNA methylation in matched samples from M0 and M1 CRC patients. Shown are pre and post-therapeutic SEPT9 (a) and SHOX2 (b) ccfDNA methylation levels in plasma of n = 9 M1 and n = 70 M0 patients with colorectal adenocarcinomas. Mean plasma ccfDNA methylation levels in M0 patients tend to decrease after therapy: SEPT9pre-therapeutic = 1.16%, SEPT9post-therapeutic = 0.019%, P = 0.089; SHOX2pre-therapeutic = 0.38%, SHOX2post-therapeutic = 0.040, P = 0.13. Mean plasma ccfDNA methylation levels in M1 patients remained high: SEPT9pre-therapeutic = 10.32%, SEPT9post-therapeutic = 9.41%, P = 0.67; SHOX2pre-therapeutic = 1.85%, SHOX2post-therapeutic = 2.15, P = 0.52. P-values refer to paired t test
Fig. 5.

Stage-dependent post-therapeutic plasma ccfDNA methylation levels. SEPT9 (a) and SHOX2 (b) methylation in plasma ccfDNA of stage I (n = 19), II (n = 38), III (n = 31), and IV (n = 11) colorectal cancer patients 3–10 days after surgery. P-values refer to Wilcoxon Mann–Whitney U tests. Methylation levels below 0.01% were set to 0.01% in order to allow for a logarithmic illustration
Discussion
Accurate staging of CRC using colonoscopy and up-to-date radiologic imaging is fundamental for treatment planning and prognosis. The periodically updated UICC and TNM staging system remains the worldwide standard for classification.3 Despite its significance, staging cancerous lesions solely on their radiologically determined anatomic extent neglects the emerging knowledge on the biological behavior and aggressiveness of solid tumours28 and also has considerable drawbacks in terms of accuracy, especially for the lymphatic invasion of the disease.29,30 This potential limitation has been highly debated in the most recent literature, particularly in the context of novel promising biomarkers.31 The combination of validated biomarkers with the established TNM system may therefore boost the efficiency of the existing regimens.
Here, we report that SEPT9 and SHOX2 ccfDNA hypermethylation performs outstandingly as an auxiliary molecular staging parameter. Especially the FDA approved blood-based methylation biomarker SEPT9 was able to discriminate between pathological UICC and TNM stages in an incremental fashion and may therefore be able to provide an additional “molecular dimension” to the established staging system. Our results mirror the results of previous studies, which have shown lower plasma SEPT9 methylation in earlier cancer stages compared to more advanced lesions.32–34 Above all, its ability to identify patients with a positive nodal status or distant metastases stresses the potential of SEPT9 methylation as a biomarker adding valuable information to the TNM classification. This is even more important in the light of a fairly poor clinical lymph node staging.29,30,35 In contrast to patients with localised tumour stages, individuals with positive resection margins (R1) or distant metastases (M1) showed no decrease in SEPT9 or SHOX2 methylation after surgical resection, probably due to the residual tumour burden. These findings indicate that SEPT9 ccfDNA methylation might be a potential biomarker for (occult) (micro-)metastases, advanced/systemic disease, or aggressive biological tumour behavior. With 25% of all potentially resectable liver metastases going undetected by standard imaging technique, high SEPT9 and SHOX2 methylation levels might indicate the need for extended imaging with MRI and/or PET-CT scans or an intraoperative ultrasound of the liver.7,36 Furthermore, blood-based biomarkers, e.g., ccfDNA methylation, offer the unique opportunity of gathering additional information on the extent of the disease prior to surgical treatment, especially as the final TNM classification relies on the resected specimen. In this situation, high SEPT9 methylation levels might act as an additional biomarker to define high risk stage II patients, who currently are not eligible for adjuvant treatment but might indeed benefit from an intensified treatment.4 On the other hand, low SEPT9 methylation levels might support the decision of postoperative watchful follow-up and might therefore avoid harmful adjuvant overtreatment. As previously reported for HNSCC patients,15 recurrence monitoring might be another potential application. Particularly, elevated SEPT9 and SHOX2 methylation levels after resection37 might suggest intensified monitoring and shortened follow-up for recurrence detection.
Hypermethylation of both tested gene loci has been associated with other cancer entities, carcinogenesis of which is influenced by alcohol and tobacco consumption, e.g., lung cancer, gastric cancer, cancer of the hepatobiliary tract system, pancreatic cancer, and head and neck cancer.13,15,19,22,23 According to the presumed non-specificity of SEPT9 and SHOX2 methylation levels regarding tumour-site and organ, they might also be applicable for the detection of occult second primary cancers.15
The application of serum protein biomarkers, i.e., CEA and CA 19–9, as biomarker for clinical CRC management has been intensively studied but found to lack sufficient sensitivity and specificity.38 While CEA performed particularly well in our study with regard to CRC staging when applying absolute values, even below the cut-off, the use of the accepted cut-off (5 ng/mL) diminished the power of CEA for staging considerably: Only 37.5% of patients with a systemic disease (UICC IV) showed CEA values above cut-off levels. Correspondingly, <60% of patients with a T4 tumour category had a CEA value above the level of 5 ng/mL. Although, CEA levels might add information to TNM staging as shown recently,25,26,39 it is still not included in the TNM system as prognostic biomarker. This neglect is partly reasoned by the varying distribution of protein biomarkers in CRC stages and by its interference with patients’ smoking status and comorbidities like metabolic syndrome.40 Therefore, some authors even suggest higher cut-off values.41,42 Accordingly, CA 19–9 accuracy is diminished in patients with cholestasis, pancreatitis, as well as individuals without Lewis antigen expression.43 Epigenetic biomarkers, on the other hand, are measured by different laboratory methods and might add valuable information to existing classification systems unaffected by common comorbidities. In addition to these advantages, blood based biomarkers tend to have a high acceptance among the population.44,45 Consequently, a myriad of other methylation biomarkers in tissue and plasma have been published.46–51 Pedersen et al.49 for example screened BCAT1 and IKZF1 methylation levels in over 2000 patients scheduled for colonoscopy. They reported a moderate sensitivity of 66% (85/129) for CRC detection and a stepwise increase for the positivity rate from stage I (38%) to stage IV (94%), which is in concordance with the gradual increase in more advanced tumours reported by us. Complementary, another group presented hypermethylation in several promoter regions—namely SFRP1 and SFRP2, SDC2 and PRIMA1—in CRC and adenomas.51 As previous described,16 hypermethylation seems to occur at a very early stage during CRC carcinogenesis and increases with progression. Very recently, Barault et al.50 analysed cancer-specific methylation patterns in 149 CRC cell lines and validated their panel in tumour tissue and plasma. They found at least one plasma biomarker in 85.7% of CRC samples with prognostic and diagnostic significance but excluded SEPT9 from their analysis, since it failed to reach their stringent inclusion criteria. However, the FDA approved marker SEPT9 remains the blood based biomarker with the highest level of validation, and other reported biomarkers still need additional prospectively validation.
In 2017, several meta-analysis17,45,52 showed a pooled sensitivity of 67 with 89% specificity for the SEPT9 assay regarding the discrimination of CRC patients from individuals without a tumour. Although useful in diagnosis and screening, the authors do not suggest SEPT9 as prognostic biomarker or therapeutic monitoring tool due to a lack of evidence. These findings stand in contrast to our results, which revealed SEPT9 blood methylation levels to be highly correlated with one of the strongest prognostic parameters: the UICC stage. This might be explained by different experimental settings and study populations, especially in terms of an overrepresentation of metastatic patients in many of the previous reports. While further studies are warranted to support the prognostic value of SEPT9 blood methylation, the general potential of methylation biomarkers as prognostic biomarker in CRC is evident. Garlan et al.46 for example reported that methylation biomarkers (WIF1 and NPY) might act as prognostic biomarkers and stratify treatment responders into two groups with significantly differing outcomes.
No methylation biomarker published so far is able to detect or monitor CRC accurately enough to be used as stand-alone diagnostic tool. As a consequence, combination of promising biomarkers into a panel53 or combined with immunochemical Fecal Occult Blood Test (iFOBT) seems to present an attractive tool and might be necessary to reflect all molecular subtypes of CRC. A combination with iFOBT might further help to reduce problems that arise from the utility of a single blood-based methylation biomarker. The methylation biomarker performance is highly dependent on the sample quality, since inappropriate sample handling leads to the excessive release of DNA from lysing leucocytes54–56 resulting in a relative reduction of cancer-specific methylation biomarker levels. Furthermore, the quantification of tumourous ccfDNA in blood of a patient via methylation biomarkers is restricted to those genes that are hypermethylated in the individual patient’s tumour. Hence, intra and inter-tumoural methylation heterogeneity represents a general limitation of methylation biomarkers. Furthermore, other factors like age and time of blood collection seems to influence the SEPT9 plasma levels and have to be taken into account. Herein, SEPT9 shows a circadian rhythm55 which might impair sensitivity, especially in earlier lesions. Moreover, many genes undergo age-associated hypermethylation (reviewed by57) providing an explanation for higher SEPT9 methylation levels in healthy individuals older than 60 years compared to their younger counterparts.32 Additionally, the time point of post-surgical blood collection might also have a critical impact on the reliability of our results due to an increased level of total ccfDNA based on healing processes or undegraded remnant tumour ccfDNA. However, the estimated half-life of ccfDNA has been reported to be a matter of minutes to hours58,59 suggesting that blood sampling three days after surgery might be appropriate.
Designed in a prospective manner, our study lacks several typical drawbacks, e.g., missing data, selection, and information bias. Nonetheless, we are aware of certain limitations. We were not able to follow enough patients for a profound survival analysis and were therefore not able to generate analyses of patients’ outcome.
Our results further highlight that methylation biomarkers alone have limited use for CRC screening owing to low biomarker levels in blood from patients with early stage cancers compared to advanced tumour stages. Consequently, small and clinically occult tumours that would have the highest chance of cure would very likely go undetected. The significant association of SEPT9 and SHOX2 methylation and TNM categories, a strong prognostic indicator of survival,1 however, highlights the potential of blood-based biomarkers.
In conclusion, methylation testing in plasma is a powerful additional diagnostic tool that, together with the recent TNM classification, facilitates molecular disease staging of CRC. Patients with initially high biomarker levels might benefit from intensified treatment and close post-therapeutic surveillance. The early detection of recurrent/metastatic disease could lead to earlier consecutive treatment, thereby improving patients’ outcomes. Post-therapeutically elevated ccfDNA methylation levels appear to indicate the presence of residual disease and distant metastases. These patients might benefit from an early initiation of a systemic treatment.
Electronic supplementary material
Acknowledgements
The study was funded by the University Hospital Bonn. This work was supported research grant (SE 2616/2-1) provided to AS by the German Research Foundation (DFG), Germany.
Competing interests
The University Hospital Bonn (Principal Investigator: Dimo Dietrich) receives research funding from Epigenomics AG, Berlin, Germany. The company aims to commercialize DNA methylation biomarkers (e.g., SHOX2 and SEPT9). Remaining authors declare no competing interests.
Footnotes
These authors contributed equally: Julia Bergheim, Alexander Semaan.
These authors jointly supervised this work: Glen Kristiansen, Dimo Dietrich.
Electronic supplementary material
Supplementary information is available for this paper at 10.1038/s41416-018-0035-8.
References
- 1.Siegel RL, Miller KD, Jemal A. Cancer statistics, 2017. CA Cancer J. Clin. 2017;67:7–30. doi: 10.3322/caac.21387. [DOI] [PubMed] [Google Scholar]
- 2.Brenner H, Kloor M, Pox CP. Colorectal cancer. Lancet. 2014;383:1490–1502. doi: 10.1016/S0140-6736(13)61649-9. [DOI] [PubMed] [Google Scholar]
- 3.Amin M. B., et al. (eds). AJCC Cancer Staging Manual 8th edn (Springer International Publishing: Basel, Switzerland, 2016).
- 4.Casadaban L, et al. Adjuvant chemotherapy is associated with improved survival in patients with stage II colon cancer. Cancer. 2016;122:3277–3287. doi: 10.1002/cncr.30181. [DOI] [PMC free article] [PubMed] [Google Scholar]
- 5.Fang SH, Efron JE, Berho ME, Wexner SD. Dilemma of stage II colon cancer and decision making for adjuvant chemotherapy. J. Am. Coll. Surg. 2014;219:1056–1069. doi: 10.1016/j.jamcollsurg.2014.09.010. [DOI] [PubMed] [Google Scholar]
- 6.Mainenti PP, et al. Non-invasive diagnostic imaging of colorectal liver metastases. World J. Radiol. 2015;7:157–169. doi: 10.4329/wjr.v7.i7.157. [DOI] [PMC free article] [PubMed] [Google Scholar]
- 7.Niekel, M. C, Bipat, S. & Stoker, J. Diagnostic imaging of colorectal liver metastases with CT, MR imaging, FDG PET, and/or FDG PET/CT: a meta-analysis of prospective studies including patients who have not previously undergone treatment. Radiology 257, 674–684 (2010). [DOI] [PubMed]
- 8.Barbaro B, et al. The potential predictive value of MRI and PET-CT in mucinous and nonmucinous rectal cancer to identify patients at high risk of metastatic disease. Br. J. Radiol. 2017;90:20150836. doi: 10.1259/bjr.20150836. [DOI] [PMC free article] [PubMed] [Google Scholar]
- 9.Benson AB, 3rd, National Comprehensive Cancer Network. et al. Colon cancer, version 3.2014. J. Natl Compr. Canc Netw. 2014;12:1028–1059. doi: 10.6004/jnccn.2014.0099. [DOI] [PubMed] [Google Scholar]
- 10.Huang L, et al. Neoadjuvant chemotherapy followed by surgery versus surgery alone for colorectal cancer: meta-analysis of randomized controlled trials. Medicine. 2014;93:e231. doi: 10.1097/MD.0000000000000231. [DOI] [PMC free article] [PubMed] [Google Scholar]
- 11.Crowley E, Di Nicolantonio F, Loupakis F, Bardelli A. Liquid biopsy: monitoring cancer-genetics in the blood. Nat. Rev. Clin. Oncol. 2013;10:472–484. doi: 10.1038/nrclinonc.2013.110. [DOI] [PubMed] [Google Scholar]
- 12.Heitzer E, Ulz P, Geigl JB. Circulating tumour DNA as a liquid biopsy for cancer. Clin. Chem. 2015;61:112–123. doi: 10.1373/clinchem.2014.222679. [DOI] [PubMed] [Google Scholar]
- 13.Branchi V, et al. Promoter hypermethylation of SHOX2 and SEPT9 is a potential biomarker for minimally invasive diagnosis in adenocarcinomas of the biliary tract. Clin. Epigenetics. 2016;8:133. doi: 10.1186/s13148-016-0299-x. [DOI] [PMC free article] [PubMed] [Google Scholar]
- 14.Church TR, PRESEPT Clinical Study Steering Committee, Investigators and Study Team. et al. Prospective evaluation of methylated SEPT9 in plasma for detection of asymptomatic colorectal cancer. Gut. 2014;63:317–325. doi: 10.1136/gutjnl-2012-304149. [DOI] [PMC free article] [PubMed] [Google Scholar]
- 15.Schröck A, et al. Free-circulating methylated DNA in blood for diagnosis, staging, prognosis, and monitoring of head and neck squamous cell carcinoma patients: an observational prospective cohort study. Clin. Chem. 2017;63:1288–1296. doi: 10.1373/clinchem.2016.270207. [DOI] [PubMed] [Google Scholar]
- 16.Semaan A, et al. SEPT9 and SHOX2 DNA methylation status and its utility in the diagnosis of colonic adenomas and colorectal adenocarcinomas. Clin. Epigenetics. 2016;8:100. doi: 10.1186/s13148-016-0267-5. [DOI] [PMC free article] [PubMed] [Google Scholar]
- 17.Song L, Yu H, Jia J, Li Y. A systematic review of the performance of the SEPT9 gene methylation assay in colorectal cancer screening, monitoring, diagnosis and prognosis. Cancer Biomark. 2017;18:425–432. doi: 10.3233/CBM-160321. [DOI] [PubMed] [Google Scholar]
- 18.Wasserkort R, et al. Aberrant septin 9 DNA methylation in colorectal cancer is restricted to a single CpG island. BMC Cancer. 2013;13:398. doi: 10.1186/1471-2407-13-398. [DOI] [PMC free article] [PubMed] [Google Scholar]
- 19.Kneip C, et al. SHOX2 DNA methylation is a biomarker for the diagnosis of lung cancer in plasma. J. Thorac. Oncol. 2011;6:1632–1638. doi: 10.1097/JTO.0b013e318220ef9a. [DOI] [PubMed] [Google Scholar]
- 20.Schmidt B, et al. Quantification of cell-free mSHOX2 Plasma DNA for therapy monitoring in advanced stage non-small cell (NSCLC) and small-cell lung cancer (SCLC) patients. PLoS ONE. 2015;10:e0118195. doi: 10.1371/journal.pone.0118195. [DOI] [PMC free article] [PubMed] [Google Scholar]
- 21.Weiss G, Schlegel A, Kottwitz D, König T, Tetzner R. Validation of the SHOX2/PTGER4 DNA methylation marker panel for plasma-based discrimination between patients with malignant and nonmalignant lung disease. J. Thorac. Oncol. 2017;12:77–84. doi: 10.1016/j.jtho.2016.08.123. [DOI] [PMC free article] [PubMed] [Google Scholar]
- 22.Dietrich D, et al. Diagnostic and prognostic value of SHOX2 and SEPT9 DNA methylation and cytology in benign, paramalignant and malignant pleural effusions. PLoS ONE. 2013;8:e84225. doi: 10.1371/journal.pone.0084225. [DOI] [PMC free article] [PubMed] [Google Scholar]
- 23.Jung M, et al. Diagnostic and prognostic value of SHOX2 and SEPT9 DNA methylation and cytology in benign, paramalignant, and malignant ascites. Clin. Epigenetics. 2016;8:24. doi: 10.1186/s13148-016-0192-7. [DOI] [PMC free article] [PubMed] [Google Scholar]
- 24.Distler J, et al. Evaluation of different blood collection tubes and blood storage conditions for the preservation and stability of cell-free circulating DNA for the analysis of the methylated (m)SEPT9 colorectal cancer screening marker. Adv. Exp. Med. Biol. 2016;924:175–178. doi: 10.1007/978-3-319-42044-8_32. [DOI] [PubMed] [Google Scholar]
- 25.Compton C, Fenoglio-Preiser CM, Pettigrew N, Fielding LP. American joint committee on cancer prognostic factors consensus conference: colorectal working group. Cancer. 2000;88:1739–1757. doi: 10.1002/(SICI)1097-0142(20000401)88:7<1739::AID-CNCR30>3.0.CO;2-T. [DOI] [PubMed] [Google Scholar]
- 26.Thirunavukarasu P, et al. Effect of incorporation of pretreatment serum carcinoembryonic antigen levels into AJCC staging for colon cancer on 5-year survival. JAMA Surg. 2015;150:747–755. doi: 10.1001/jamasurg.2015.0871. [DOI] [PubMed] [Google Scholar]
- 27.Basbug M, et al. Prognostic value of preoperative CEA and CA 19-9 levels in patients with colorectal cancer. Hepatogastroenterology. 2011;58:400–405. [PubMed] [Google Scholar]
- 28.Puppa G, Sonzogni A, Colombari R, Pelosi G. TNM staging system of colorectal carcinoma: a critical appraisal of challenging issues. Arch. Pathol. Lab Med. 2010;134:837–852. doi: 10.5858/134.6.837. [DOI] [PubMed] [Google Scholar]
- 29.Choi AH, et al. Accuracy of computed tomography in nodal staging of colon cancer patients. World J. Gastrointest. Surg. 2015;7:116–122. doi: 10.4240/wjgs.v7.i7.116. [DOI] [PMC free article] [PubMed] [Google Scholar]
- 30.Sjövall A, Blomqvist L, Egenvall M, Johansson H, Martling A. Accuracy of preoperative T and N staging in colon cancer−a national population-based study. Colorectal Dis. 2016;18:73–79. doi: 10.1111/codi.13091. [DOI] [PubMed] [Google Scholar]
- 31.O’Sullivan B, et al. The TNM classification of malignant tumours-towards common understanding and reasonable expectations. Lancet Oncol. 2017;18:849–851. doi: 10.1016/S1470-2045(17)30438-2. [DOI] [PMC free article] [PubMed] [Google Scholar]
- 32.Song L, et al. The performance of the mSEPT9 assay is influenced by algorithm, cancer stage and age, but not sex and cancer location. J. Cancer Res. Clin. Oncol. 2017;143:1093–1101. doi: 10.1007/s00432-017-2363-0. [DOI] [PMC free article] [PubMed] [Google Scholar]
- 33.Tóth K, et al. Detection of methylated SEPT9 in plasma is a reliable screening method for both left- and right-sided colon cancers. PLoS ONE. 2012;7:e46000. doi: 10.1371/journal.pone.0046000. [DOI] [PMC free article] [PubMed] [Google Scholar]
- 34.Tóth K, et al. Detection of methylated septin 9 in tissue and plasma of colorectal patients with neoplasia and the relationship to the amount of circulating cell-free DNA. PLoS ONE. 2014;9:e115415. doi: 10.1371/journal.pone.0115415. [DOI] [PMC free article] [PubMed] [Google Scholar]
- 35.Brouwer NPM, et al. Clinical lymph node staging by imaging in colorectal cancer: a flip of the coin? J. Clin. Oncol. 2017;35(15_suppl):e15160. doi: 10.1200/JCO.2017.35.15_suppl.e15160. [DOI] [Google Scholar]
- 36.Samim M, et al. The diagnostic performance of (18)F-FDG PET/CT, CT and MRI in the treatment evaluation of ablation therapy for colorectal liver metastases: a systematic review and meta-analysis. Surg. Oncol. 2017;26:37–45. doi: 10.1016/j.suronc.2016.12.006. [DOI] [PubMed] [Google Scholar]
- 37.Reinert T, et al. Analysis of circulating tumour DNA to monitor disease burden following colorectal cancer surgery. Gut. 2016;65:625–634. doi: 10.1136/gutjnl-2014-308859. [DOI] [PubMed] [Google Scholar]
- 38.Acharya A, Markar SR, Matar M, Ni M, Hanna GB. Use of tumour markers in gastrointestinal cancers: surgeon perceptions and cost-benefit trade-off analysis. Ann. Surg. Oncol. 2017;24:1165–1173. doi: 10.1245/s10434-016-5717-y. [DOI] [PMC free article] [PubMed] [Google Scholar]
- 39.Ozawa H, et al. Incorporation of serum carcinoembryonic antigen levels into the prognostic grouping system of colon cancer. Int J. Colorectal Dis. 2017;32:821–829. doi: 10.1007/s00384-017-2772-1. [DOI] [PubMed] [Google Scholar]
- 40.Esteghamati A, et al. The role of metabolic syndrome and related clinical variables in determining CEA levels. Adv. Clin. Exp. Med. 2014;23:907–912. doi: 10.17219/acem/37334. [DOI] [PubMed] [Google Scholar]
- 41.Jeon BG, Shin R, Chung JK, Jung IM, Heo SC. Individualized cutoff value of the preoperative carcinoembryonic antigen level is necessary for optimal use as a prognostic marker. Ann. Coloproctol. 2013;29:106–114. doi: 10.3393/ac.2013.29.3.106. [DOI] [PMC free article] [PubMed] [Google Scholar]
- 42.Takagawa R, et al. Preoperative serum carcinoembryonic antigen level as a predictive factor of recurrence after curative resection of colorectal cancer. Ann. Surg. Oncol. 2008;15:3433–3439. doi: 10.1245/s10434-008-0168-8. [DOI] [PubMed] [Google Scholar]
- 43.Ballehaninna UK, Chamberlain RS. The clinical utility of serum CA 19-9 in the diagnosis, prognosis and management of pancreatic adenocarcinoma: an evidence based appraisal. J. Gastrointest. Oncol. 2012;3:105–119. doi: 10.3978/j.issn.2078-6891.2011.021. [DOI] [PMC free article] [PubMed] [Google Scholar]
- 44.Adler A, et al. Improving compliance to colorectal cancer screening using blood and stool based tests in patients refusing screening colonoscopy in Germany. BMC Gastroenterol. 2014;14:183. doi: 10.1186/1471-230X-14-183. [DOI] [PMC free article] [PubMed] [Google Scholar]
- 45.Song L, Jia J, Peng X, Xiao W, Li Y. The performance of the SEPT9 gene methylation assay and a comparison with other CRC screening tests: a meta-analysis. Sci. Rep. 2017;7:3032. doi: 10.1038/s41598-017-03321-8. [DOI] [PMC free article] [PubMed] [Google Scholar]
- 46.Garlan F, et al. Early evaluation of circulating tumour DNA as marker of therapeutic efficacy in metastatic colorectal cancer patients (PLACOL Study) Clin. Cancer Res. 2017;23:5416–5425. doi: 10.1158/1078-0432.CCR-16-3155. [DOI] [PubMed] [Google Scholar]
- 47.Garrigou S, et al. A study of hypermethylated circulating tumour DNA as a universal colorectal cancer biomarker. Clin. Chem. 2016;62:1129–1139. doi: 10.1373/clinchem.2015.253609. [DOI] [PubMed] [Google Scholar]
- 48.Patai AacuteV, et al. Comprehensive DNA methylation analysis reveals a common ten-gene methylation signature in colorectal adenomas and carcinomas. PLoS ONE. 2015;10:e0133836. doi: 10.1371/journal.pone.0133836. [DOI] [PMC free article] [PubMed] [Google Scholar]
- 49.Pedersen SK, et al. Evaluation of an assay for methylated BCAT1 and IKZF1 in plasma for detection of colorectal neoplasia. BMC Cancer. 2015;15:654. doi: 10.1186/s12885-015-1674-2. [DOI] [PMC free article] [PubMed] [Google Scholar]
- 50.Barault L., et al. Discovery of methylated circulating DNA biomarkers for comprehensive non-invasive monitoring of treatment response in metastatic colorectal cancer. Gut. 10.1136/gutjnl-2016-313372 (2017). [DOI] [PMC free article] [PubMed]
- 51.Barták BK, et al. Colorectal adenoma and cancer detection based on altered methylation pattern of SFRP1, SFRP2, SDC2, and PRIMA1 in plasma samples. Epigenetics. 2017;12:751–763. doi: 10.1080/15592294.2017.1356957. [DOI] [PMC free article] [PubMed] [Google Scholar]
- 52.Zhang M, He Y, Zhang X, Zhang M, Kong L. A pooled analysis of the diagnostic efficacy of plasmic methylated septin-9 as a novel biomarker for colorectal cancer. Biomed. Rep. 2017;7:353–360. doi: 10.3892/br.2017.970. [DOI] [PMC free article] [PubMed] [Google Scholar]
- 53.Rasmussen SL, et al. Hypermethylated DNA, a circulating biomarker for colorectal cancer detection. PLoS ONE. 2017;12:e0180809. doi: 10.1371/journal.pone.0180809. [DOI] [PMC free article] [PubMed] [Google Scholar]
- 54.Norton SE, Lechner JM, Williams T, Fernando MR. A stabilizing reagent prevents cell-free DNA contamination by cellular DNA in plasma during blood sample storage and shipping as determined by digital PCR. Clin. Biochem. 2013;46:1561–1565. doi: 10.1016/j.clinbiochem.2013.06.002. [DOI] [PubMed] [Google Scholar]
- 55.Tóth K, et al. Circadian rhythm of methylated septin 9, cell-free DNA amount and tumour markers in colorectal cancer patients. Pathol. Oncol. Res. 2017;23:699–706. doi: 10.1007/s12253-016-0174-2. [DOI] [PubMed] [Google Scholar]
- 56.Norton SE, Luna KK, Lechner JM, Qin J, Fernando MR. A new blood collection device minimizes cellular DNA release during sample storage and shipping when compared to a standard device. J. Clin. Lab Anal. 2013;27:305–311. doi: 10.1002/jcla.21603. [DOI] [PMC free article] [PubMed] [Google Scholar]
- 57.Teschendorff AE, West J, Beck S. Age-associated epigenetic drift: implications, and a case of epigenetic thrift? Hum. Mol. Genet. 2013;22(R1):R7–R15. doi: 10.1093/hmg/ddt375. [DOI] [PMC free article] [PubMed] [Google Scholar]
- 58.Diehl F, et al. Circulating mutant DNA to assess tumour dynamics. Nat. Med. 2008;14:985–990. doi: 10.1038/nm.1789. [DOI] [PMC free article] [PubMed] [Google Scholar]
- 59.Yu SC, et al. High-resolution profiling of fetal DNA clearance from maternal plasma by massively parallel sequencing. Clin. Chem. 2013;59:1228–1237. doi: 10.1373/clinchem.2013.203679. [DOI] [PubMed] [Google Scholar]
Associated Data
This section collects any data citations, data availability statements, or supplementary materials included in this article.