Abstract
Background
It has been reported that non-high-density lipoprotein cholesterol (non-HDL-C) and lipid ratios, including total cholesterol (TC) / high-density lipoprotein cholesterol (HDL-C) and low-density lipoprotein cholesterol (LDL-C) / HDL-C, are better predictors for atherosclerosis than conventional lipid profiles. However, there have been few studies comparing the predictive values of different lipid parameters for early atherosclerosis. The aim of this study was to determine the relevant factors of carotid intima-media thickness (IMT) and plaque in the general Chinese adults and analyze the predictive values of different lipid parameters for carotid IMT and plaque.
Methods
We collected the demographics, anthropometrics, and laboratory data of 311 Chinese adults without the diagnoses of acute myocardial infarction, stroke, heart failure, peripheral arterial disease, end-stage renal disease or malignant tumor. The carotid IMT and the presence of carotid plaque were evaluated by high-resolution color Doppler ultrasonography.
Results
Based on the cutoff level of 0.9 mm, the percentage of people with a thickened IMT was 8.4%. And the percentage of people with carotid plaque was 15.8%. Among the lipid parameters, the levels of TC, non-HDL-C and LDL-C were more closely related to carotid IMT and plaque compared with other lipid parameters in the univariate analyses. In multivariate analyses, age, gender and systolic blood pressure (SBP) remained significantly with carotid IMT, whereas age, gender, diastolic blood pressure (DBP) and the TC level remained significantly with carotid plaque. Non-HDL-C level remained significantly with carotid plaque after adjusting for age, gender, waist-hip ratio (WHR), smoking, drinking, SBP and fasting plasma glucose (FPG).
Conclusions
Age, gender, SBP are important predictors for carotid IMT. Age, gender, DBP and TC are important predictors for carotid plaque. TC, LDL-C and non-HDL-C have greater predictive values for IMT and the presence of carotid plaque compared with other lipid parameters, among which TC has the greatest predictive value for the presence of carotid plaque. The predictive value of non-HDL-C for carotid IMT and plaque is not inferior to that of LDL-C.
Keywords: Carotid intima-media thickness, Carotid plaque, Lipids, Chinese adults
Background
Atherosclerosis plays a key role in the development of ischemic cardiovascular disease (CVD) and stroke. Dyslipidemia is a fundamental risk factor of atherosclerosis. Previous studies have reported that low-density lipoprotein cholesterol (LDL-C) is a classical atherogenic lipoprotein, while high-density lipoprotein cholesterol (HDL-C) is anti-atherogenic [1]. Recently, a number of prospective epidemiological studies have indicated that triglyceride (TG) level is positively correlated with the morbidity and mortality of coronary heart disease (CHD) [2, 3]. Although LDL-C has been considered as the primary target of lipid-lowering therapy, non-high-density lipoprotein cholesterol (non-HDL-C), calculated as total cholesterol (TC) minus HDL-C, has been recommended as the secondary target of lipid-lowering treatment, especially for those with high TG levels [1]. Unlike LDL-C, non-HDL-C is independent of lipoprotein composition [4]. Thus, non-HDL-C has shown a better predictive value for atherosclerosis and CVD than LDL-C in some researches [5]. In addition, lipid ratios, including TC/HDL-C and LDL-C/HDL-C ratios have been suggested as better predictors for atherosclerosis than each independent lipid parameter in some studies [6, 7]. To our knowledge, there have been limited data to validate the predictive values of different lipid parameters for early-stage asymptomatic atherosclerosis before developing into ischemic CVD and stroke.
The carotid artery is regarded as the window of systemic atherosclerosis due to its superficial location. Carotid intima-media thickness (IMT) and plaque are crucial predictors for ischemic CVD and stroke, particularly in the subclinical stage [8]. Many heart attacks and strokes occur suddenly in people without any clinical symptoms. Therefore, preventing the diseases before they develop at the early stage of atherosclerosis in people at the average risk-factor level will be an effective approach. Many risk factors for CVD and stroke have been identified, but data on their predictive values for early-stage asymptomatic atherosclerosis remain limited.
The purpose of the present study was to detect the relevant factors of carotid IMT and the presence of carotid plaque in the general Chinese adults and analyze the predictive values of different risk factors, including different lipid parameters, for carotid IMT and the presence of carotid plaque.
Methods
Participants
The participants came from a prospective epidemiological survey from 2007 to 2009 which aimed to investigate the prevalence of diabetes and cardiovascular diseases in Chinese. The study design was previously described elsewhere [9]. All participants were from a single community in Chengdu, Sichuan Province in 2009 and underwent a routine clinical examination, including physical examination, biochemical examination and carotid artery color Doppler ultrasound examination. Participants with a diagnosis of acute myocardial infarction, stroke, heart failure, peripheral arterial disease, end-stage renal disease or malignant tumor were excluded. We also excluded participants who were on lipid-lowering therapy.
Demographic and clinical characteristics
Demographic data such as age, gender, nationality and history of alcohol and smoking were obtained from a previously well designed questionnaire. Smoking was defined as having smoked at least 100 cigarettes during their lifetimes. Drinking was defined as having consumed at least 30 g of alcohol per week for more than one year. Height, weight, waist circumference and hip circumference were manually measured. Body mass index (BMI) was calculated by the eq. BMI = weight (kg) / height (m) 2. Waist hip ratio (WHR) was calculated by the eq. WHR = waist circumference (cm) / hip circumference (cm). Blood pressure was measured with a standard sphygmomanometer in a sitting position after a ten-minute rest in the fasting state and presented as a mean value of three readings (in mmHg). Hypertension was defined as a systolic blood pressure (SBP) higher than 140 mmHg and/or diastolic blood pressure (DBP) higher than 90 mmHg or taking antihypertensive drugs. Diabetes mellitus (DM) was defined according to the revised 1999 WHO criteria: fasting plasma glucose level (FPG) ≥126 mg/dl (7.0 mmol/L); plasma glucose level ≥ 200 mg/dl (11.1 mmol/L) 2 h after a 75 g oral glucose load. Those who were taking antidiabetic medication were also defined as diabetic patients.
Laboratory examination
Venous blood samples were collected from each participant in the early morning after a 12 h fast. FPG, TC, TG, HDL-C, alanine aminotransferase (ALT), aspartate aminotransferase (AST), blood urea nitrogen (BUN), creatinine (Cr) were measured in the central laboratory. LDL-C was directly measured by standard enzymatic methods (Roche Diagnostics) when TG ≥4.52 mmol/L. The Friedwald eq. (LDL-C = TC-HDL-C-TG/2.2) was used when TG < 4.52 mmol/L [10].
Carotid artery color Doppler ultrasound
A high-resolution vascular ultrasound (Philips ATL 3500 device) was used to measure both the left and right common carotid arteries by the sonographers who were blinded to the participants’ clinical characteristics. IMT was defined as the distance between the leading edge of the lumen-intima and the leading edge of the media dventitia echo [11]. The larger IMT of bilateral common carotid arteries was taken as the final value of IMT. IMT > 0.9 mm was defined as thickened IMT [12].
Statistical analysis
All the statistical analyses were performed by using SPSS 19.0 (IBMSPSS, Chicago, USA). Continuous variables were presented as mean ± standard deviation (SD) or percentiles, while categorical variables were presented as percentages. The Kolmogorov-Smirnov test was used to determine the normality of distributions and the abnormal distributed data were log-transformed. Student’s t-test, Mann-Whitney U test or Chi-square test was used to compare the data between groups as appropriate. Linear correlations between IMT and clinical characteristics (including lipid parameters) were evaluated by Spearman rank correlation. Univariate linear regression models and stepwise multiple linear regression models were conducted to examine relevant factors of carotid IMT. Univariate logistic regression models and multivariate logistic regression models (Backward LR) were performed to explore the independent predictors for carotid plaque. Additionally, the independent association of non-HDL-C level with carotid plaque was analyzed by four multivariate logistic regression models after adjusting for clinical variables. The results were considered significant when p < 0.05.
Results
Baseline characteristics
A total of 311 Chinese adults consisted of 111 men and 200 women, aged 23–78 years (mean age 48.25 ± 12.86 years) were enrolled. Baseline characteristics are presented in Table 1. The median IMT was 0.70 mm and carotid plaque was detected in 49 participants (15.8%). A total of 21 participants (6.8%) were diabetic patients, sixteen of which (76.2%) received insulin or oral antidiabetic drugs. Forty-eight participants (15.4%) were hypertensive patients, thirty-five of which (72.9%) received antihypertensive drugs. Of the participants without lipid-lowering therapy, thirty-one (10.0%) had dyslipidemia.
Table 1.
Baseline characteristics of participants
| Characteristics | Mean ± SD or P50 (P25, P75) or number (percentage) |
|---|---|
| Age (years) | 48.25 ± 12.86 |
| Male, n (%) | 111 (35.7) |
| Han, n (%) | 309 (99.4) |
| BMI (kg/m2) | 23.24 (20.90, 25.80) |
| WHR | 0.88 ± 0.08 |
| Smoking, n (%) | 67 (21.5) |
| Drinking, n (%) | 81 (26.0) |
| Diabetes, n (%) | 21 (6.8) |
| Hypertension, n (%) | 48 (15.4) |
| Dyslipidemia, n (%) | 31 (10.0) |
| Antidiabetic treatment, n (%) | 16 (5.1) |
| Antihypertensive treatment, n (%) | 35 (11.3) |
| FPG (mmol/L) | 4.82 (4.54, 5.18) |
| SBP (mmHg) | 114.00 (102.67, 129.33) |
| DBP (mmHg) | 75.97 ± 10.98 |
| TC (mmol/L) | 4.78 ± 0.91 |
| TG (mmol/L) | 1.03 (0.80, 1.52) |
| LDL-C (mmol/L) | 2.78 (2.27, 3.31) |
| HDL-C (mmol/L) | 1.60 ± 0.34 |
| Non-HDL-C (mmol/L) | 3.18 ± 0.90 |
| TC/HDL-C | 2.94 (2.54, 3.46) |
| LDL-C/HDL-C | 1.79 (1.41, 2.23) |
| ALT (IU/L) | 19.00 (15.00, 28.00) |
| AST (IU/L) | 22.00 (19.00, 27.00) |
| BUN (mmol/L) | 5.39 (4.34, 6.54) |
| Cr (umol/L) | 55.44 ± 14.56 |
| IMT (mm) | 0.70 (0.60, 0.80) |
| Carotid plaques, n (%) | 49 (15.8) |
SD Standard deviation, BMI Body mass index, WHR Waist-hip ratio, FPG Fasting plasma glucose, SBP Systolic blood pressure, DBP Diastolic blood pressure, TC Total cholesterol, TG Triglyceride, LDL-C Low-density lipoprotein cholesterol, HDL-C High-density lipoprotein cholesterol, Non-HDL-C Non-high-density lipoprotein cholesterol, ALT Alanine aminotransferase, AST Aspartate aminotransferase, BUN Blood urea nitrogen, Cr Creatinine, IMT Intima-media thickness
Characteristics classified based on the presence of carotid plaque
As demonstrated in Table 2, the levels of TC, LDL-C, HDL-C and non-HDL-C in the subjects with carotid plaque were significantly higher as compared with those in the subjects without carotid plaque. Other variables, including the percentages of males and smokers, age, waist-hip ratio, SBP, DBP, and the creatinine level were also significantly different between groups. People with carotid plaque had a significantly thicker IMT than those without carotid plaque (0.80 mm vs 0.60 mm, p < 0.001).
Table 2.
Characteristics of participants between groups with and without carotid plaque
| Characteristics | Plaque (+) (n = 49) | Plaque (−) (n = 262) | a p |
|---|---|---|---|
| Age (years) | 61.90 ± 10.11 | 45.69 ± 11.67 | < 0.001 |
| Male, n (%) | 25 (51.0) | 86 (32.8) | 0.015 |
| BMI (kg/m2) | 23.67(21.10, 26.57) | 23.18 (20.90, 25.57) | 0.408 |
| WHR | 0.93 ± 0.10 | 0.87 ± 0.08 | < 0.001 |
| Smoking, n (%) | 16 (32.7%) | 51 (19.5%) | 0.039 |
| Drinking, n (%) | 13 (26.5%) | 68 (26.0%) | 0.933 |
| FPG (mmol/L) | 4.92 (4.57, 5.34) | 4.81 (4.53, 5.15) | 0.224 |
| SBP (mmHg) | 130.00 (115.67, 153.50) | 111.33 (101.00, 125.25) | < 0.001 |
| DBP (mmHg) | 81.73 ± 10.74 | 74.90 ± 10.71 | < 0.001 |
| TC (mmol/L) | 5.28 ± 1.14 | 4.68 ± 0.83 | < 0.001 |
| TG (mmol/L) | 1.13 (0.82, 1.52) | 1.01 (0.79, 1.55) | 0.369 |
| LDL-C (mmol/L) | 3.07 (2.52, 3.86) | 2.67 (2.23, 3.24) | 0.002 |
| HDL-C (mmol/L) | 1.69 ± 0.40 | 1.58 ± 0.33 | 0.041 |
| Non-HDL-C (mmol/L) | 3.59 ± 1.14 | 3.10 ± 0.83 | 0.006 |
| TC/HDL-C | 3.17 (2.70, 3.86) | 2.90 (2.53, 3.41) | 0.065 |
| LDL-C/HDL-C | 1.97 (1.52, 2.43) | 1.77 (1.40, 2.16) | 0.059 |
| ALT (IU/L) | 18.00 (14.00, 23.00) | 19.00 (15.00, 30.25) | 0.173 |
| AST (IU/L) | 23.00 (19.50, 28.00) | 22.00 (18.00, 27.00) | 0.412 |
| BUN (mmol/L) | 5.60 (4.88, 6.82) | 5.37 (4.30, 6.50) | 0.118 |
| Cr (umol/L) | 60.72 ± 17.56 | 54.45 ± 13.75 | 0.006 |
| IMT (mm) | 0.80 (0.70, 0.90) | 0.60 (0.60, 0.70) | < 0.001 |
aStudent’s t-test, Mann-Whitney U test or Chi-square test
BMI Body mass index, WHR Waist-hip ratio, FPG Fasting plasma glucose, SBP Systolic blood pressure, DBP Diastolic blood pressure, TC Total cholesterol, TG Triglyceride, LDL-C Low-density lipoprotein cholesterol, HDL-C High-density lipoprotein cholesterol, Non-HDL-C Non-high-density lipoprotein cholesterol, ALT Alanine aminotransferase, AST Aspartate aminotransferase, BUN Blood urea nitrogen, Cr Creatinine, IMT Intima-media thickness
Characteristics classified based on the dichotomized carotid IMT with a cutoff level of 0.9 mm
Based on the cutoff level of 0.9 mm, the percentage of people with a thickened IMT was 8.4%. As demonstrated in Table 3, age, waist-hip ratio, FPG, SBP, TC, LDL-C, non-HDL-C, TC/HDL-C ratio and LDL-C/HDL-C ratio were significantly different between the normal and thickened IMT groups.
Table 3.
Characteristics of participants between groups with normal and thickened intima-media thickness
| Characteristics | Normal (IMT ≤ 0.9 mm) (n = 285) | Thickened (IMT > 0.9 mm) (n = 26) | a p |
|---|---|---|---|
| Age (years) | 47.02 ± 12.45 | 61.69 ± 9.28 | < 0.001 |
| Male, n (%) | 100(35.1%) | 11 (42.3%) | 0.602 |
| BMI (kg/m2) | 23.19(20.83, 25.64) | 23.93 (22.46, 26.90) | 0.073 |
| WHR | 0.87 ± 0.08 | 0.94 ± 0.08 | < 0.001 |
| Smoking, n (%) | 63(22.1%) | 4(15.4%) | 0.583 |
| Drinking, n (%) | 74 (26.0%) | 7 (26.9%) | 0.915 |
| FPG (mmol/L) | 4.80 (4.53, 5.13) | 5.19 (4.76, 5.61) | < 0.001 |
| SBP (mmHg) | 112.00 (101.33, 127.00) | 135.33 (118.83, 144.50) | < 0.001 |
| DBP (mmHg) | 75.69 ± 11.02 | 79.09 ± 10.16 | 0.131 |
| TC (mmol/L) | 4.73 ± 0.88 | 5.26 ± 1.13 | 0.005 |
| TG (mmol/L) | 1.02(0.80, 1.51) | 1.30 (0.82, 1.85) | 0.196 |
| LDL-C (mmol/L) | 2.71 (2.26, 3.27) | 3.15 (2.56, 3.71) | 0.009 |
| HDL-C (mmol/L) | 1.60 ± 0.33 | 1.61 ± 0.41 | 0.870 |
| Non-HDL-C (mmol/L) | 3.13 ± 0.88 | 3.65 ± 1.02 | 0.005 |
| TC/HDL-C | 2.92(2.51, 3.44) | 3.16 (2.86, 3.60) | 0.034 |
| LDL-C/HDL-C | 1.77(1.38, 2.22) | 1.89 (1.75, 2.39) | 0.032 |
| ALT (IU/L) | 19.00 (15.00, 28.50) | 17.50 (14.75, 24.00) | 0.317 |
| AST (IU/L) | 22.00 (19.00, 27.50) | 22.00 (19.00, 26.00) | 0.902 |
| BUN (mmol/L) | 5.37 (4.31, 6.53) | 5.56 (4.97, 6.94) | 0.195 |
| Cr (umol/L) | 55.05 ± 14.74 | 59.74 ± 11.81 | 0.116 |
aStudent’s t-test, Mann-Whitney U test or Chi-square test
IMT Intima-media thickness, BMI Body mass index, WHR Waist-hip ratio, FPG Fasting plasma glucose, SBP Systolic blood pressure, DBP Diastolic blood pressure, TC Total cholesterol, TG Triglyceride, LDL-C Low-density lipoprotein cholesterol, HDL-C High-density lipoprotein cholesterol, Non-HDL-C Non-high-density lipoprotein cholesterol, ALT alanine aminotransferase, AST Aspartate aminotransferase, BUN Blood urea nitrogen, Cr Creatinine
Spearman rank correlations between lipid parameters, other variables and carotid IMT
The results of Spearman rank correlation analyses are exhibited in Table 4. Among the lipid parameters, carotid IMT was positively correlated with the levels of LDL-C, TC and non-HDL-C (r = 0.222, 0.202 and 0.208, respectively; all p < 0.05) and the ratios of TC/HDL-C and LDL-C/HDL-C (r = 0.173 and 0.178, respectively; both p < 0.05) (Table 4 and Figs. 1, 2, 3, 4, 5, 6 and 7). Among other variables, carotid IMT was significantly correlated with age (r = 0.566, p < 0.001), gender (r = − 0.204, p < 0.001), BMI (r = 0.232, p < 0.001), waist-hip ratio (r = 0.372, p < 0.001), smoking (r = 0.130, p = 0.021), FPG (r = 0.217, p < 0.001), SBP (r = 0.427, p < 0.001), DBP (r = 0.272, p < 0.001), BUN (r = 0.150, p = 0.008) and creatinine (r = 0.238, p < 0.001) (Table 4).
Table 4.
Spearman rank correlations between lipid parameters, other variables and carotid intima-media thickness
| Variables | r | a p |
|---|---|---|
| Age | 0.566 | < 0.001 |
| Gender | −0.204 | < 0.001 |
| BMI | 0.232 | < 0.001 |
| WHR | 0.372 | < 0.001 |
| Smoking | 0.130 | 0.021 |
| Drinking | 0.098 | 0.084 |
| FPG | 0.217 | < 0.001 |
| SBP | 0.427 | < 0.001 |
| DBP | 0.272 | < 0.001 |
| TC | 0.202 | < 0.001 |
| TG | 0.135 | 0.017 |
| LDL-C | 0.222 | < 0.001 |
| HDL-C | −0.005 | 0.924 |
| Non-HDL-C | 0.208 | < 0.001 |
| TC/HDL-C | 0.173 | 0.002 |
| LDL-C/HDL-C | 0.178 | 0.002 |
| ALT | −0.051 | 0.368 |
| AST | 0.052 | 0.364 |
| BUN | 0.150 | 0.008 |
| Cr | 0.238 | < 0.001 |
aSpearman rank correlation test
BMI Body mass index, WHR Waist-hip ratio, FPG Fasting plasma glucose, SBP Systolic blood pressure, DBP Diastolic blood pressure, TC Total cholesterol, TG Triglyceride, LDL-C Low-density lipoprotein cholesterol, HDL-C High-density lipoprotein cholesterol, Non-HDL-C Non-high-density lipoprotein cholesterol, ALT Alanine aminotransferase, AST Aspartate aminotransferase, BUN Blood urea nitrogen, Cr Creatinine
Fig. 1.
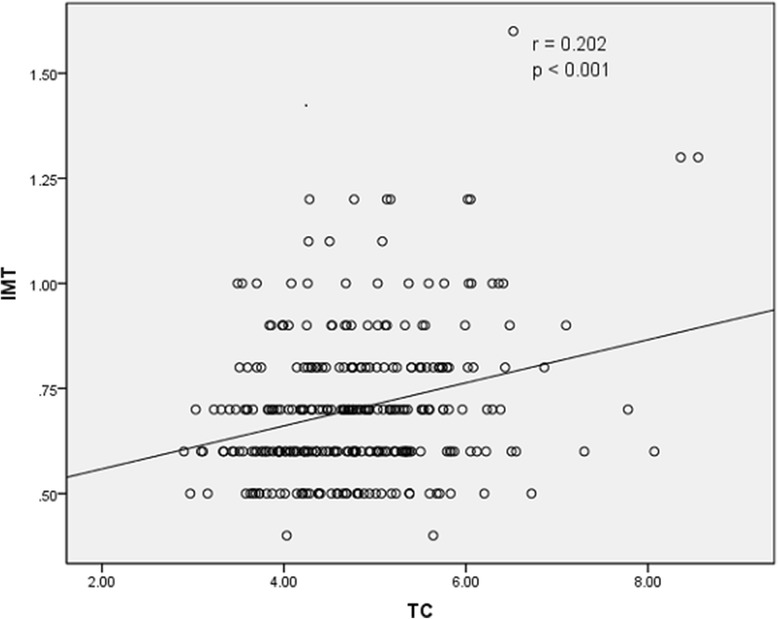
Correlation of intima-media thickness with TC level. TC = total cholesterol, IMT = intima-media thickness
Fig. 2.
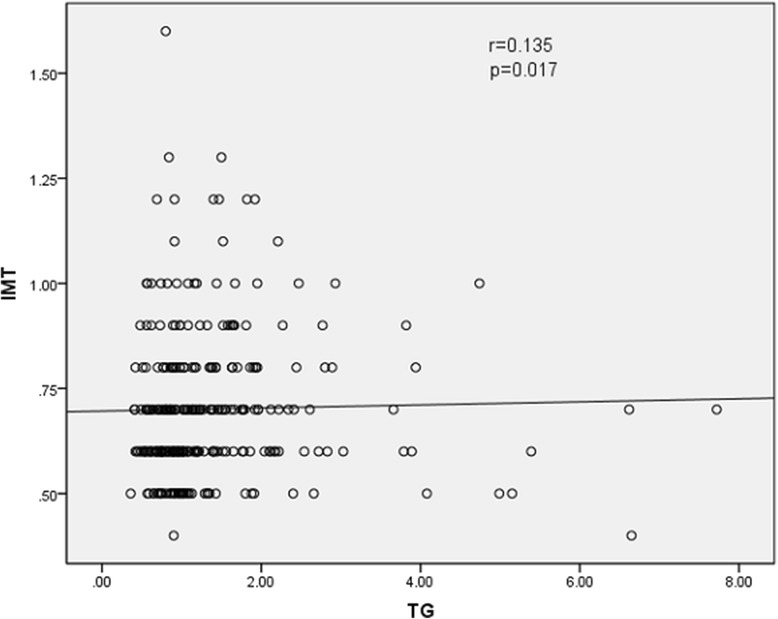
Correlation of intima-media thickness with TG level. TG = triglyceride, IMT = intima-media thickness
Fig. 3.
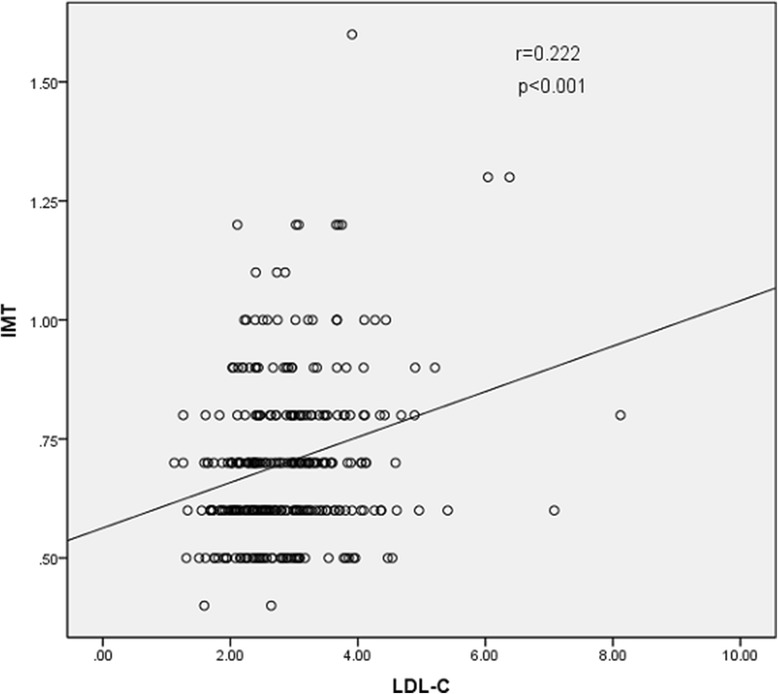
Correlation of intima-media thickness with LDL-C level. LDL-C = low-density lipoprotein cholesterol, IMT = intima-media thickness
Fig. 4.
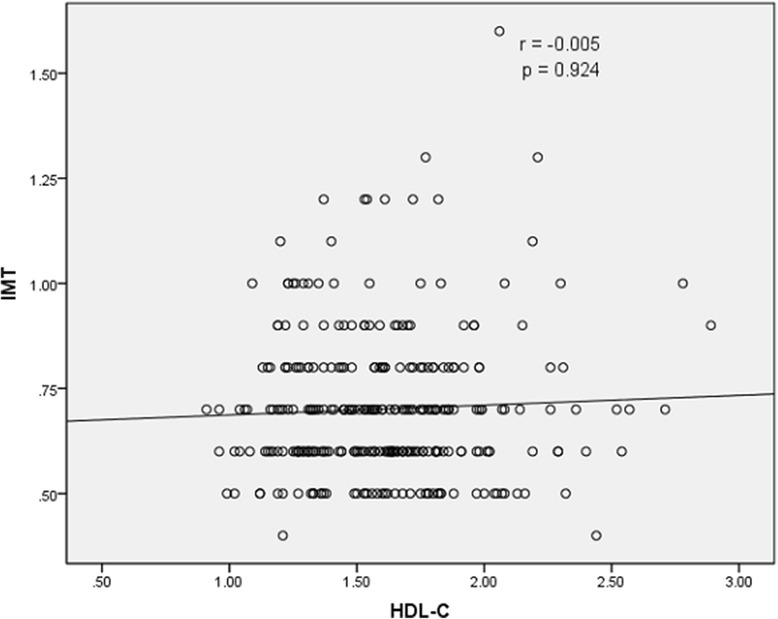
Correlation of intima-media thickness with HDL-C level. HDL-C = high-density lipoprotein cholesterol, IMT = intima-media thickness
Fig. 5.
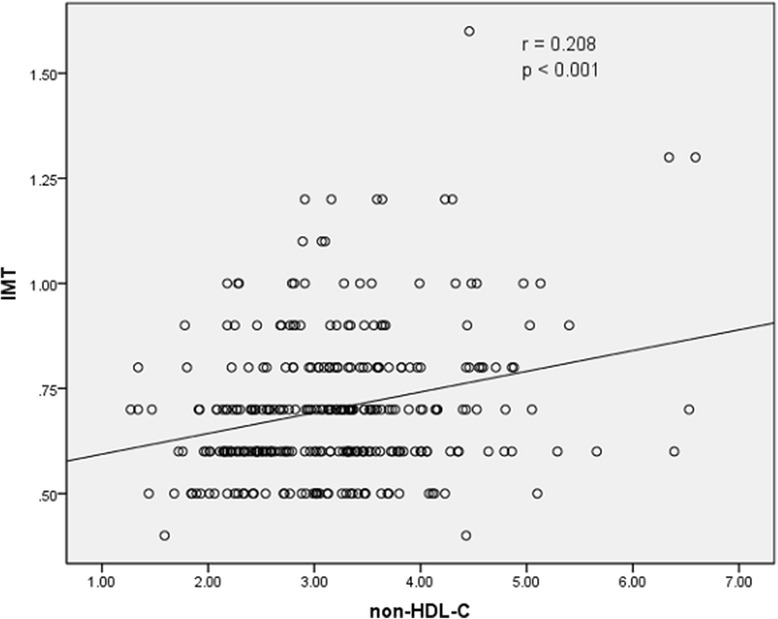
Correlation of intima-media thickness with non-HDL-C level. Non-HDL-C = non-high-density lipoprotein cholesterol, IMT = intima-media thickness
Fig. 6.
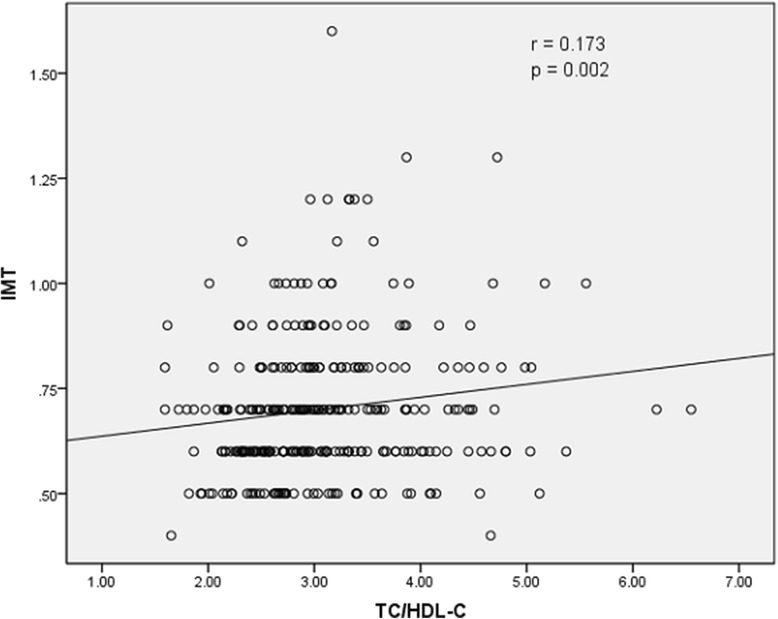
Correlation of intima-media thickness with TC/HDL-C ratio. TC = total cholesterol, HDL-C = high-density lipoprotein cholesterol, IMT = intima-media thickness
Fig. 7.
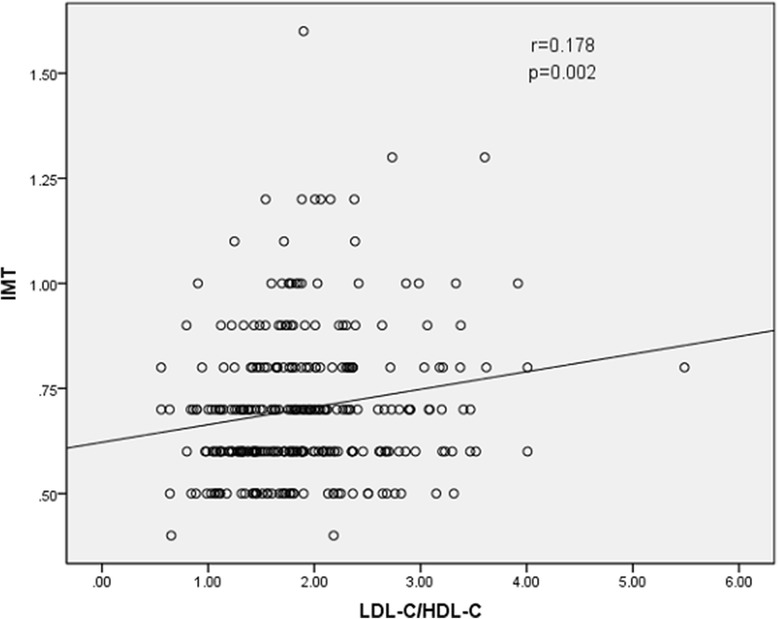
Correlation of intima-media thickness with LDL-C/HDL-C ratio. LDL-C = low-density lipoprotein cholesterol, HDL-C = high-density lipoprotein cholesterol, IMT = intima-media thickness
Univariate and multivariate linear regression analyses for correlations with carotid IMT
The results of univariate linear regression analyses are revealed in Table 5. Among the lipid parameters, the levels of TC (standard Beta = 0.252, p < 0.001), non-HDL-C (standard Beta = 0.243, p < 0.001) and LDL-C (standard Beta = 0.242, p < 0.001) appeared to be more closely related to carotid IMT compared with other lipid parameters in the univariate model. Subsequently, stepwise multiple linear regression analysis was performed using all the variables with a significance level of < 0.05 in the univariate linear regression analyses as independent variables and the log transformed carotid IMT as the dependent variable. The final results revealed that age (standard Beta = 0.457, p < 0.001), gender (standard Beta = − 0.101, p = 0.029) and SBP (standard Beta = 0.182, p = 0.001) were included in the multivariate model and remained as independent variables those were associated with carotid IMT (Table 6).
Table 5.
Associations between lipid parameters, other variables and carotid intima-media thickness
| Variables | Beta | Standard Beta | a p |
|---|---|---|---|
| Age | 0.004 | 0.568 | < 0.001 |
| Gender | −0.034 | −0.167 | 0.003 |
| BMI | 0.006 | 0.230 | < 0.001 |
| WHR | 0.444 | 0.385 | < 0.001 |
| Smoking | 0.027 | 0.112 | 0.048 |
| FPG | 0.009 | 0.145 | 0.010 |
| SBP | 0.002 | 0.453 | < 0.001 |
| DBP | 0.002 | 0.273 | < 0.001 |
| TC | 0.027 | 0.252 | < 0.001 |
| TG | 0.001 | 0.014 | 0.805 |
| LDL-C | 0.026 | 0.242 | < 0.001 |
| HDL-C | 0.009 | 0.031 | 0.587 |
| Non-HDL-C | 0.026 | 0.243 | < 0.001 |
| TC/HDL-C | 0.018 | 0.143 | 0.011 |
| LDL-C/HDL-C | 0.024 | 0.173 | 0.002 |
| BUN | 0.002 | 0.066 | 0.249 |
| Cr | 0.001 | 0.190 | 0.001 |
aUnivariate linear regression analysis
BMI Body mass index, WHR Waist-hip ratio, FPG Fasting plasma glucose, SBP Systolic blood pressure, DBP Diastolic blood pressure, TC Total cholesterol, TG Triglyceride, LDL-C Low-density lipoprotein cholesterol, HDL-C High-density lipoprotein cholesterol, Non-HDL-C Non-high-density lipoprotein cholesterol, ALT Alanine aminotransferase, AST Aspartate aminotransferase, BUN Blood urea nitrogen, Cr Creatinine
Table 6.
Predictors for carotid intima-media thickness by multiple linear regression analysis
| Variables | Beta | Standardized Beta | a p |
|---|---|---|---|
| Age | 0.003 | 0.457 | < 0.001 |
| Gender | −0.021 | −0.101 | 0.029 |
| SBP | 0.001 | 0.182 | 0.001 |
aStepwise multiple linear regression analysis
SBP Systolic blood pressure
Univariate and multivariate logistic regression analyses for correlations with the presence of carotid plaque
The results of univariate logistic regression analyses are shown in Table 7. Among the atherogenic lipids, the levels of TC (OR = 1.949, 95% CI = 1.403–2.709, p < 0.001), non-HDL-C (OR = 1.749, 95% CI = 1.265–2.418, p = 0.001) and LDL-C (OR = 1.616, 95% CI = 1.187–2.201, p = 0.002) appeared to be more closely related to carotid plaque in the univariate model. Stepwise multiple logistic regression analysis was conducted using all the variables with a significance level of < 0.05 in the univariate model as independent variables and the presence of carotid plaque as the dependent variable. As shown in Table 8, gender (OR = 2.216, 95% CI = 1.044–4.705, p = 0.038), TC level (OR = 1.568, 95% CI = 1.055–2.331, p = 0.026), age (OR = 1.127, 95% CI = 1.086–1.171, p < 0.001) and DBP (OR = 1.038, 95% CI = 1.002–1.075, p = 0.037) were independently associated with the presence of carotid plaque in the multivariate model.
Table 7.
Associations between lipid parameters, other variables and the presence of carotid plaque
| Variables | B | OR /EXP (B) | 95% CI | a p |
|---|---|---|---|---|
| Age | 0.120 | 1.127 | 1.089–1.166 | < 0.001 |
| Gender | 0.757 | 2.132 | 1.151–3.949 | 0.016 |
| BMI | 0.022 | 1.022 | 0.939–1.112 | 0.613 |
| WHR | 8.299 | 4018.118 | 80.940–199,473.238 | < 0.001 |
| Smoking | −0.696 | 0.499 | 0.255–0.975 | 0.042 |
| Drinking | −0.030 | 0.971 | 0.486–1.939 | 0.933 |
| FBG | 0.074 | 1.076 | 0.917–1.264 | 0.368 |
| SBP | 0.039 | 1.039 | 1.025–1.055 | < 0.001 |
| DBP | 0.054 | 1.056 | 1.027–1.085 | < 0.001 |
| TC | 0.668 | 1.949 | 1.403–2.709 | < 0.001 |
| TG | −0.130 | 0.878 | 0.609–1.265 | 0.484 |
| LDL-C | 0.480 | 1.616 | 1.187–2.201 | 0.002 |
| HDL-C | 0.885 | 2.423 | 1.029–5.705 | 0.043 |
| Non-HDL-C | 0.559 | 1.749 | 1.265–2.418 | 0.001 |
| TC/HDL-C | 0.292 | 1.339 | 0.936–1.916 | 0.111 |
| LDL-C/HDL-C | 0.390 | 1.477 | 0.983–2.221 | 0.061 |
| ALT | −0.024 | 0.977 | 0.952–1.002 | 0.073 |
| AST | −0.003 | 0.997 | 0.960–1.305 | 0.864 |
| BUN | 0.002 | 1.002 | 0.929–1.081 | 0.961 |
| Cr | 0.030 | 1.030 | 1.008–1.052 | 0.006 |
aUnivariate logistic regression analysis
OR Odds ratio, CI Confidence interval, BMI Body mass index, WHR Waist-hip ratio, FPG Fasting plasma glucose, SBP Systolic blood pressure, DBP Diastolic blood pressure, TC Total cholesterol, TG Triglyceride, LDL-C Low-density lipoprotein cholesterol, HDL-C High-density lipoprotein cholesterol, Non-HDL-C Non-high-density lipoprotein cholesterol, ALT Alanine aminotransferase, AST Aspartate aminotransferase, BUN Blood urea nitrogen, Cr Creatinine
Table 8.
Predictors for carotid plaque by multivariate logistic regression analysis
| Variables | OR | 95% CI | a p |
|---|---|---|---|
| Age | 1.127 | 1.086–1.171 | < 0.001 |
| Gender | 2.216 | 1.044–4.705 | 0.038 |
| DBP | 1.038 | 1.002–1.075 | 0.037 |
| TC | 1.568 | 1.055–2.331 | 0.026 |
aMultivariate logistic regression analysis
OR Odds ratio, CI Confidence interval, DBP Diastolic blood pressure, TC Total cholesterol
The independent association of non-HDL-C level with carotid plaque by logistic regression analyses
Non-HDL-C level was associated with the presence of carotid plaque (OR = 1.749, 95% CI = 1.265–2.418, p = 0.001) (Table 7). And this association was tested by several models after adjusting for some conventional risk factors. As displayed in Table 9, high non-HDL-C level remained as a positive predictor for carotid plaque independent of age, gender, waist-hip ratio, smoking, drinking, SBP and FPG (OR = 1.565, 95% CI = 1.053–2.327, p = 0.027) (Table 9).
Table 9.
Association of non-high-density lipoprotein cholesterol level with carotid plaque after adjusting for clinical variables
| Adjustment | OR | 95%CI | a p |
|---|---|---|---|
| Non-HDL-C | 1.749 | 1.265–2.418 | 0.001 |
| Adjust for age, gender | 1.526 | 1.047–2.223 | 0.028 |
| Adjust for age, gender, WHR | 1.555 | 1.061–2.278 | 0.024 |
| Adjust for age, gender, WHR, smoking, drinking | 1.543 | 1.045–2.277 | 0.029 |
| Adjust for age, gender, WHR, smoking, drinking, SBP | 1.526 | 1.031–2.260 | 0.035 |
| Adjust for age, gender, WHR, smoking, drinking, SBP, FPG | 1.565 | 1.053–2.327 | 0.027 |
aLogistic regression analysis
OR Odds ratio, CI Confidence interval, non-HDL-C Non-high-density lipoprotein cholesterol, WHR Waist-hip ratio, SBP Systolic blood pressure, FPG Fasting plasma glucose
Discussion
The present study has demonstrated that age, gender and SBP are important predictors for carotid IMT. Age, gender, DBP and TC are important predictors for carotid plaque. TC, LDL-C and non-HDL-C have greater predictive values for carotid IMT and plaque compared with other lipid parameters, among which TC has the greatest predictive value for the presence of carotid plaque. The predictive value of non-HDL-C for carotid IMT and plaque is not inferior to that of LDL-C.
Atherogenesis is a complex process of several pathological stages: intimal medial thickening, fatty streaks, intermediate lesions, fibrous plaques, complicated plaques [13]. These different stages of atherogenesis depend on endothelial dysfunction, oxidative stress and inflammation. Many atherosclerotic risk factors can influence the levels of oxidative stress and inflammation in vivo or directly impair the endothelial function of the vessel wall.
Advancing age is an important predictor for carotid IMT and the presence of carotid plaque. Bauer et al. have reported that almost 50 to 80% of increased carotid IMT is attributed to aging and the carotid IMT of men increases by 0.007 mm per year [14]. The underlying pathogenesis can be explained by age-related impairment of endothelial function. The endothelium produces endothelium-derived relaxing factors such as nitric oxide that protects the vessel wall from developing atherosclerosis. With increasing age, the endothelium-derived relaxing factors decrease and the endothelium-derived vasoconstrictor factors increase. In addition, the generation of reactive oxygen species (ROS) increases with advanced age. ROS cause nitric oxide break down and consequently impair endothelial function of the vessel wall [15].
Male gender is another important predictor for carotid IMT and the presence of carotid plaque. Previous studies have demonstrated that there is a gender difference in the cardiovascular morbidity and mortality. Premenopausal females are at lower risk of CVD than males and this gender difference disappears between postmenopausal females and males. Moreover, premature menopausal females are at increased risk of CVD compared with premenopausal females of the same age. These results suggest that estrogens play a vital role in the gender difference of atherosclerosis risk. Estrogens can stimulate the release of endothelium-derived relaxing factor and inhibit the rennin-angiotensin system (RAS) [16, 17], therefore protecting the endothelial function of the vessel wall.
High blood pressure can induce loss of vasomotor activity and perpetuate endothelial damage, thus triggering a wide range of different vasculopathies including increasing lipid permeability, promoting oxidative stress and activating renin-angiotensin system (RAS) and sympathetic nervous system (SNS) [18]. Several previous studies have revealed the correlation between blood pressure and carotid IMT or plaque [19–21]. In the present study, multivariate analyses have demonstrated that SBP is correlated with carotid IMT, while DBP is correlated with the presence of carotid plaque. It might mean SBP is a better predictor of early atherosclerosis and DBP is a better predictor of advanced atherosclerosis. However, several other explanations for this difference should also be taken into consideration: first, the sample size of this study is relatively limited; second, the characteristics of the subjects in the present study are not the same as the ones in the previous studies; third, the resolution of the current ultrasound images might be inadequate to distinguish between medial hypertrophy (pathogenesis of hypertension) and intimal thickening (pathogenesis of atherosclerosis). So further study with a large sample size based on high-resolution measurements is needed.
Compared with other lipid parameters, TC has the greatest predictive value for the presence of carotid plaque. Previous prospective studies have proved that there is a continuous, graded and strong relationship between serum TC level and six-year age-adjusted risk of CHD death [22]. Compared with young men aged 18 to 39 years with favorable TC levels (TC < 5.17 mmol/L), those with unfavorable TC levels (TC ≥ 6.21 mmol/L) had a greater risk of CHD (2.15 to 3.63 times) and CVD mortality (2.10 to 2.87 times) [23]. In this study, LDL-C, which is a classical atherogenic lipid, has a lower predictive value for the presence of carotid plaque than TC. This discrepancy may partly be explained by the following reasons. First, in addition to LDL-C, very low-density lipoprotein cholesterol (VLDL-C) and intermediate-density lipoprotein cholesterol (IDL-C) are also closely related to atherosclerosis. Second, the baseline mean TG level of the participants was 1.03 mmol/L, so most LDL-C levels were calculated by the Friedwald eq. (LDL-C = TC-HDL-C-TG/2.2) in this study. Hendrick et al. have found that when TG < 2.26 mmol/L, the overall misclassification rate of CVD risk score ranged from 5 to 17% by using calculated LDL-C [24]. Third, the baseline mean LDL-C level in this study was nearly normal (2.78 mmol/L). Previous studies have revealed that high LDL-C level is a risk factor for atherosclerosis, while low or normal LDL-C level is well tolerated by individuals [25].
The predictive value of non-HDL-C for carotid IMT and plaque is not inferior to that of LDL-C. Multivariate analysis demonstrated that non-HDL-C remained as a positive predictor for carotid plaque after adjustment of age, gender, waist-hip ratio, smoking, drinking, SBP and FPG. Our results are consistent with the previous findings. Previous published epidemic surveys have shown that non-HDL-C is a somewhat better predictor for CVD risk than LDL-C [5, 26]. Framingham Heart Study (FHS) has found that non-HDL-C appears to be a stronger predictor of CVD risk than LDL-C independent of TG levels [27, 28]. Another meta-analysis of more than 300,000 people has demonstrated that the predictive value of non-HDL-C for CVD risk is not inferior to that of LDL-C (both measured and calculated) [29]. Non-HDL-C as a risk predictor of atherosclerosis has several advantages: first, it contains all potential atherogenic lipid particles; second, it can be calculated in the non-fasting state; third, it can be calculated in the setting of hypertriglyceridemia.
The present study has revealed the predictors for carotid IMT and plaque in participants without the diagnoses of acute myocardial infarction, stroke, heart failure, or peripheral arterial disease. And as we all know, thickened carotid IMT and the presence of carotid plaque are surrogate markers for heart attack and stroke. Therefore, the results of this study will be meaningful for detecting early-stage asymptomatic atherosclerosis and preventing cardiovascular events in the general Chinese adults. The results of this study are relatively reliable because participants on lipid-lowering therapy were excluded. Moreover, we compared the predictive values of different lipid parameters for carotid IMT and plaque.
This study may have several potential limitations. Firstly, this is an observational study with a relatively small sample size. Only correlations rather than causality can be drawn due to the nature of the study design. Secondly, this is a single-center study and almost all the participants are Han Chinese from the same community, so we may not generalize the results to other regions or other ethnicities. Further multi-centered, prospective cohort studies with a larger sample size are needed. Moreover, the present study only detected the predictors for plaque presence due to the insufficient data. The predictors for the quantitative characteristics of carotid plaque such as plaque number, plaque thickness, plaque area, plaque type and the Doppler ultrasound blood flow signal deserve further investigation.
Conclusions
In conclusion, the present study has revealed that age, gender and SBP are important predictors for carotid IMT. Age, gender, DBP and TC are important predictors for carotid plaque. TC, LDL-C and non-HDL-C have greater predictive values for IMT and the presence of carotid plaque compared with other lipid parameters. The predictive value of non-HDL-C for carotid IMT and plaque is not inferior to that of LDL-C.
Acknowledgements
This study was supported by grants from the Chinese Medical Association Foundation and Chinese Diabetes Society (No. 07020470055) and The First Affiliated Hospital of Chongqing Medical University (No. PYJJ2017-32).
Availability of data and materials
Please contact corresponding author for reasonable data requests.
Abbreviations
- ALT
Alanine aminotransferase
- AST
Aspartate aminotransferase
- BMI
Body mass index
- BUN
Blood urea nitrogen
- CHD
Coronary heart disease
- CI
Confidence interval
- Cr
Creatinine
- CVD
Cardiovascular disease
- DBP
Diastolic blood pressure
- DM
Diabetes mellitus
- FHS
Framingham heart study
- FPG
Fasting plasma glucose
- HDL-C
High-density lipoprotein cholesterol
- IDL-C
Itermediate-density lipoprotein cholesterol
- IMT
Intima-media thickness
- LDL-C
Low-density lipoprotein cholesterol
- Non-HDL-C
Non-high-density lipoprotein cholesterol
- OR
Odds ratio
- RAS
Rennin-angiotensin system
- ROS
Ractive oxygen species
- SBP
Systolic blood pressure
- SD
Standard deviation
- SNS
Sympathetic nervous system
- TC
Total cholesterol
- TG
Triglyceride
- VLDL-C
Very low-density lipoprotein cholesterol
- WHR
Waist-hip ratio
Authors’ contributions
QTH was responsible for the study design, data collection, data analysis and manuscript writing. SYL and YG contributed to supervision of the study and data collection. HMT was responsible for manuscript revision and coordination of the study. All authors read and approved the final version of this manuscript.
Ethics approval and consent to participate
This study was conducted in accordance with the Declaration of Helsinki. All participants provided informed consent for participation in the study.
Competing interests
The authors declare that they have no competing interests.
Publisher’s Note
Springer Nature remains neutral with regard to jurisdictional claims in published maps and institutional affiliations.
Contributor Information
Qingtao Hou, Email: qingtao1990@sina.com.
Sheyu Li, Email: lisheyu@gmail.com.
Yun Gao, Email: wsgaoyun1982@163.com.
Haoming Tian, Email: hmtian999@126.com.
References
- 1.National Cholesterol Education Program (NCEP) Expert Panel on Detection, Evaluation, and Treatment of High Blood Cholesterol in Adults (Adult Treatment Panel III) Third report of the National Cholesterol Education Program (NCEP) expert panel on detection, evaluation, and treatment of high blood cholesterol in adults (adult treatment panel III) final report. Circulation. 2002;106:3143–3421. [PubMed] [Google Scholar]
- 2.Austin MA, Hokanson JE, Edwards KL. Hypertriglyceridemia as a cardiovascular risk factor. Am J Cardiol. 1998;81:7B–12B. doi: 10.1016/S0002-9149(98)00031-9. [DOI] [PubMed] [Google Scholar]
- 3.Assmann G, Schulte H, Funke H, von Eckardstein A. The emergence of triglycerides as a significant independent risk factor in coronary artery disease. Eur Heart J. 1998;19(Suppl M):M8–14. [PubMed] [Google Scholar]
- 4.Ridker PM. LDL cholesterol: controversies and future therapeutic directions. Lancet. 2014;384:607–617. doi: 10.1016/S0140-6736(14)61009-6. [DOI] [PubMed] [Google Scholar]
- 5.Cui Y, Blumenthal RS, Flaws JA, Whiteman MK, Langenberg P, Bachorik PS, et al. Non-high density lipoprotein cholesterol level as a predictor of cardiovascular disease mortality. Arch Intern Med. 2001;161:1413–1419. doi: 10.1001/archinte.161.11.1413. [DOI] [PubMed] [Google Scholar]
- 6.Ridker PM, Rifai N, Cook NR, Bradwin G, Buring JE. Non-HDL cholesterol, apolipoproteins A-I and B100, standard lipid measures, lipid ratios, and CRP as risk factors for cardiovascular disease in women. JAMA. 2005;294:326–333. doi: 10.1001/jama.294.3.326. [DOI] [PubMed] [Google Scholar]
- 7.Kinosian B, Glick H, Garland G. Cholesterol and coronary heart disease: predicting risks by levels and ratios. Ann Intern Med. 1994;121:641–647. doi: 10.7326/0003-4819-121-9-199411010-00002. [DOI] [PubMed] [Google Scholar]
- 8.Greenland P, Alpert JS, Beller GA, Benjamin EJ, Budoff MJ, Fayad ZA, et al. 2010 ACCF/AHA guideline for assessment of cardiovascular risk in asymptomatic adults: a report of the American College of Cardiology Foundation/American Heart Association task force on practice guidelines. J Am Coll Cardiol. 2010;56:e50–103. doi: 10.1016/j.jacc.2010.09.001. [DOI] [PubMed] [Google Scholar]
- 9.Yang W, Lu J, Weng J, Jia W, Ji L, Xiao J, Shan Z, et al. Prevalence of diabetes among men and women in China. N Engl J Med. 2010;362:1090–1101. doi: 10.1056/NEJMoa0908292. [DOI] [PubMed] [Google Scholar]
- 10.Friedewald WT, Levy RI, Fredrickson DS. Estimation of the concentration of low-density lipoprotein cholesterol in plasma, without use of the preparative ultracentrifuge. Clin Chem. 1972;18:499–502. [PubMed] [Google Scholar]
- 11.Touboul PJ, Hennerici MG, Meairs S, Adams H, Amarenco P, Bornstein N, et al. Mannheim carotid intima-media thickness consensus (2004-2006). An update on behalf of the advisory board of the 3rd and 4th watching the risk symposium, 13th and 15th European stroke conferences, Mannheim, Germany, 2004, and Brussels, Belgium, 2006. Cerebrovasc Dis. 2007;23:75–80. doi: 10.1159/000097034. [DOI] [PubMed] [Google Scholar]
- 12.Bots ML, Hoes AW, Koudstaal PJ, Hofman A, Grobbee DE. Common carotid intima-media thickness and risk of stroke and myocardial infarction: the Rotterdam study. Circulation. 1997;96:1432–1437. doi: 10.1161/01.CIR.96.5.1432. [DOI] [PubMed] [Google Scholar]
- 13.Hegele RA. The pathogenesis of atherosclerosis. Clin Chim Acta. 1996;246:21–38. doi: 10.1016/0009-8981(96)06224-9. [DOI] [PubMed] [Google Scholar]
- 14.Bauer M, Möhlenkamp S, Lehmann N, Schmermund A, Roggenbuck U, Moebus S, et al. The effect of age and risk factors on coronary and carotid artery atherosclerotic burden in males-results of the Heinz Nixdorf recall study. Atherosclerosis. 2009;205:595–602. doi: 10.1016/j.atherosclerosis.2009.01.005. [DOI] [PubMed] [Google Scholar]
- 15.Virdis A, Taddei S. Endothelial aging and gender. Maturitas. 2012;71:326–330. doi: 10.1016/j.maturitas.2012.01.010. [DOI] [PubMed] [Google Scholar]
- 16.dos Santos RL, da Silva FB, Ribeiro RF, Jr, Stefanon I. Sex hormones in the cardiovascular system. Horm Mol Biol Clin Invest. 2014;18:89–103. doi: 10.1515/hmbci-2013-0048. [DOI] [PubMed] [Google Scholar]
- 17.Duckles SP, Miller VM. Hormonal modulation of endothelial NO production. Pflugers Arch. 2010;459:841–851. doi: 10.1007/s00424-010-0797-1. [DOI] [PMC free article] [PubMed] [Google Scholar]
- 18.Hurtubise J, McLellan K, Durr K, Onasanya O, Nwabuko D, Ndisang JF. The different facets of dyslipidemia and hypertension in atherosclerosis. Curr Atheroscler Rep. 2016;18:82. doi: 10.1007/s11883-016-0632-z. [DOI] [PubMed] [Google Scholar]
- 19.Zanchetti A, Crepaldi G, Bond MG, Gallus GV, Veglia F, Ventura A, et al. Systolic and pulse blood pressures (but not diastolic blood pressure and serum cholesterol) are associated with alterations in carotid intima±media thickness in the moderately hypercholesterolaemic hypertensive patients of the plaque hypertension lipid lowering Italian study. PHYLLIS study group. J Hypertens. 2001;19:79–88. doi: 10.1097/00004872-200101000-00011. [DOI] [PubMed] [Google Scholar]
- 20.Ayer JG, Harmer JA, Nakhla S, Xuan W, Ng MK, Raitakari OT, et al. HDL-cholesterol, blood pressure, and asymmetric Dimethylarginine are significantly associated with Arterial Wall thickness in children. Arterioscler Thromb Vasc Biol. 2009;29:943–949. doi: 10.1161/ATVBAHA.109.184184. [DOI] [PubMed] [Google Scholar]
- 21.Wang RX, Zha J, Xu ZR. Associations of blood pressure level with carotid intima-media thickness and plaque among middle-aged and elderly Chinese hypertensives. Zhonghua Xin Xue Guan Bing Za Zhi. 2013;41:256–259. [PubMed] [Google Scholar]
- 22.Stamler J, Wentworth D, Neaton JD. Is relationship between serum cholesterol and risk of premature death from coronary heart disease continuous and graded? Findings in 356,222 primary screenees of the multiple risk factor intervention trial (MRFIT) JAMA. 1986;256:2823–2828. doi: 10.1001/jama.1986.03380200061022. [DOI] [PubMed] [Google Scholar]
- 23.Stamler J, Daviglus ML, Garside DB, Dyer AR, Greenland P, Neaton JD. Relationship of baseline serum cholesterol levels in 3 large cohorts of younger men to long-term coronary, cardiovascular, and all-cause mortality and to longevity. JAMA. 2000;284:311–318. doi: 10.1001/jama.284.3.311. [DOI] [PubMed] [Google Scholar]
- 24.van Deventer HE, Miller WG, Myers GL, Sakurabayashi I, Bachmann LM, Caudill SP, et al. Non–HDL cholesterol shows improved accuracy for cardiovascular risk score classification compared to direct or calculated LDL cholesterol in a Dyslipidemic population. Clin Chem. 2011;57:490–501. doi: 10.1373/clinchem.2010.154773. [DOI] [PMC free article] [PubMed] [Google Scholar]
- 25.Brown MS, Goldstein JL. A receptor-mediated pathway for cholesterol homeostasis. Science. 1986;232:34–47. doi: 10.1126/science.3513311. [DOI] [PubMed] [Google Scholar]
- 26.Bittner V, Hardison R, Kelsey SF, Weiner BH, Jacobs AK, Sopko G. Non-high-density lipoprotein cholesterol levels predict five-year outcome in the bypass angioplasty revascularization investigation (BARI) Circulation. 2002;106:2537–2542. doi: 10.1161/01.CIR.0000038496.57570.06. [DOI] [PubMed] [Google Scholar]
- 27.Miller M, Ginsberg HN, Schaefer EJ. Relative atherogenicity and predictive value of non-high density lipoprotein cholesterol for coronary heart disease. Am J Cardiol. 2008;101:1003–1008. doi: 10.1016/j.amjcard.2007.11.046. [DOI] [PubMed] [Google Scholar]
- 28.Liu J, Sempos CT, Donahue RP, Dorn J, Trevisan M, Grundy SM. Non-high-density lipoprotein and very-low-density lipoprotein cholesterol and their risk predictive values in coronary heart disease. Am J Cardiol. 2006;98:1363–1368. doi: 10.1016/j.amjcard.2006.06.032. [DOI] [PubMed] [Google Scholar]
- 29.Emerging Risk Factors Collaboration. Di Angelantonio E, Sarwar N, Perry P, Kaptoge S, Ray KK, et al. major lipids, apolipoproteins, and risk of vascular disease. JAMA. 2009;302:1993–2000. doi: 10.1001/jama.2009.1619. [DOI] [PMC free article] [PubMed] [Google Scholar]
Associated Data
This section collects any data citations, data availability statements, or supplementary materials included in this article.
Data Availability Statement
Please contact corresponding author for reasonable data requests.


