

Abstract
Mechanistic questions regarding kidney stone formation have led researchers to look for the presence of trace elements. Neutron activation analysis is able to identify elements at parts-per-million concentrations. Four different types of kidney stones were irradiated with thermal neutrons to produce radioisotopes. Gamma spectroscopy of samples at different counting times was used to reduce identification errors by correlating results with the half-life of identified elements. For more precise identification, Monte Carlo simulation was used to cross-check the identification process. The simulation showed promising results that could lead to fast and accurate identification of trace elements as the simulation code is improved. Sodium (Na), potassium (K), calcium (Ca), bromine (Br), samarium (Sm), zinc (Zn), cadmium (Cd), ytterbium (Yb), gold (Au), cobalt (Co), and manganese (Mn) were identified as being present in the stones, by both the experimentally measured gamma spectrum and the simulation. Among these, Ca, Br, and Zn were found to be of potential clinical relevance via a literature review. Concentrations of the elements were compared to those noted in the literature. For uric acid stones, a correlation with the literature was found for Zn and Ca. A negative correlation was found between Zn and Br for non-uric acid stones. More samples are needed to test for statistical significance.
Keywords: kidney stone, neutron activation analysis, Monte Carlo
1. Introduction
Kidney stone disease is increasing worldwide due to changes in dietary habits and preservatives in foods. It is estimated that 8.8% of the population in the USA suffers from kidney stone disease [1] and that 15% of global populations are expected to have stone formation, regardless of race and ethnicity [2].
With the increasing prevalence of kidney stones, researchers are seeking a better understanding of the mechanisms responsible for kidney stone formation. Although kidney stone formation generally can be explained by precipitation and crystallization, the detailed mechanisms are still not well known [3]. It is believed that the presence of trace elements provides an important clue regarding stone formation [3, 4], as in metabolic processes, including stone formation, trace elements play a crucial role [4, 5]. Those elements contribute to the formation by being either inhibitors or matrix components. High levels of strontium (Sr) and zinc (Zn) have been found where the concentration of calcium (Ca) was high, and a positive correlation found between Zn and Sr [2, 6]. Calcium oxalate kidney stones usually contain higher concentrations of all elements in comparison to uric acid and xanthine stones [3]. For example, lower Zn concentrations were found in uric acid and xanthine stones than were found in calcium oxalate stones [6, 7]. Identified elements and relevant analysis methods are summarized in table 1 [2, 3, 8–13]. In addition to these studies, the distributions of trace and major elements have been analyzed as a function of their positions relative to the stone core [8, 14, 15].
Table 1.
A review of elements in kidney stones.
| Reference | Techniques | Identified elements |
|---|---|---|
| Srivastava et al [2] | INAAa, EDXRFb | Zn, Sr, Na, Mn, Fe, Cr, Se, Co, Sc, Ca |
| Sarmani et al [3] | INAA | Al, Au, Br, Ca, Cl, Co, Cr, Fe, Hg, I, K, Mg, Na, Sb, Se, Sr, Zn |
| Bazin et al [8] | μ-SRXFc | Fe, Zn, Cu, Sr, Rb, Se, Pb |
| Singh et al [9] | LIBSd | Ca, Mg, Mn, Cu, Fe, Zn, Sr, Na, K, C, H, N, O, P, S, Cl |
| Donev et al [10] | NAA | Fe, Zn, Cr, Cd, Co, Hg, Se, Sr, Cu, Br, Na, K |
| Jaćimović et al [11] | NAA | Hg, Cr, La, Sc, Co, Fe, Sb |
| Giannossi et al [12] | XRDe | Ca, Mg, K, Zn, Fe, Cu, Mn, Pb, Cr |
| Al-Kofahi et al [13] | PIXEf and RBSg | C, N, O, F, Na, Mg, Si, P, S, Cl, K, Ca, Fe, Br |
INAA: instrumental neutron activation analysis.
EDXRF: energy dispersed x-ray fluorescence.
μ-SRXF: μ-synchrotron radiation x-ray fluorescence.
LIBS: laser induced breakdown spectroscopy.
XRD: x-ray diffractions.
PIXE: particle induced x-ray emission.
RBS: Rutherford backscattering spectroscopy.
Chemical analysis and x-ray fluorescence are two methods used for elemental analysis. However, these techniques are not efficient for a bulk material or for very low concentrations of trace elements [3, 16]. Quantitative and qualitative elemental analyses of trace, major, and minor elements in bulk materials are more precise using instrumental neutron activation analysis (NAA) because neutrons and gamma rays can effectively penetrate through the bulk material [16]. Thus, NAA may have a role to play in the elemental analysis of kidney stones.
Identification of NAA-generated short-lived and long-lived isotopes, however, is strongly dependent on experimental setup [16, 17]. Because short-lived isotopes dominate the initial gamma spectrum, longer measurement times hide short-lived isotopes. Additionally, not all elements are detectable by thermal neutron activations because some elements have low neutron absorption cross-section. For example, zirconium (Zr) is not detectable by thermal neutrons. Fast neutron activation can reveal these elements; however, more interference reactions may occur [16]. To avoid the limitations caused by various experimental conditions, a Monte Carlo simulation can be used to verify the elements identified by NAA experiments.
For simulating NAA, newly released Monte Carlo simulation code, MCNP6 [18], enabled delayed particles to be simulated from both fission products and nuclear interactions. Previous versions of MCNP do not have this feature. Delayed gammas were produced by gamma line data from model and multi-group data (25-group). The restriction to delayed neutron activation simulation is that it can only be currently used for fixed source problems [18, 19].
In this study, NAA was used to determine major and trace elements in four different kidney stones. Selected trace elements concentrations were analyzed with a comparator method. The Missouri University of Science and Technology Reactor (MSTR) was used for NAA of the kidney stones. Due to a lack of apparatus for prompt gamma ray detection, only a delayed NAA was performed. The element identification process is complex as interference reactions may result in a faulty analysis. As an example; 23Na(n, γ)24Na, 27Al (n, α)24Na, reactions may result same delayed gamma emission [20]. A Monte Carlo simulation was then used to help identify the correct elements from the delayed NAA experiments. This methodology was used for the first time to facilitate element identification in kidney stones.
2. Methods
2.1. Experimental setup
The MSTR was used for delayed NAA. MSTR is a swimming-pool type research reactor with a power limit of 200 kW. Samples were transferred to the reactor core by a pneumatic transportation system and irradiated for 3 h with the flux and power of,
Thermal neutrons flux = 2.15 × 1012 cm−2 s−1at 100 kW.
Epithermal neutron flux = 2.39 × 1010 cm−2 s−1 at 100 kW.
Irradiated samples were transferred back from the reactor core to a hot-cell facility. Gamma-ray emissions from these irradiated samples were counted by a high purity Germanium detector (Canberra BE3825). Counting was done at 3 h, 8 h, and 12 h periods depending on the availability of the MSTR and different half-life radioactive isotopes.
Four types of kidney stones: apatite, calcium oxalate monohydrate, struvite and uric acid were provided by the Mayo Clinic in Rochester, MN and examined by NAA. The physical and chemical properties of the kidney stones are summarized in table 2. The samples were dried and prepared in powder form while taking care to avoid possible contamination. Prepared samples were contained in plastic vials for irradiation and counting. Due to the availability of MSTR, only apatite and struvite samples were counted for 3, 8, and 12 h; and uric acid and calcium oxalate monohydrate for 3 and 8 h.
Table 2.
Physical characteristics of kidney stones.
| Type | Density (g cm−3) | Mass (g) | Composition |
|---|---|---|---|
| Apatite | 3.19 | 0.11690 | Ca5(PO4)3(F, Cl, OH) |
| Calcium oxalate monohydrate | 2.12 | 0.12555 | C2H2CaO5 |
| Struvite | 1.7 | 0.14770 | NH4MgPO4.6H2O |
| Uric acid | 1.89 | 0.14209 | C5H4N4O3 |
2.2. Simulation
MCNP6 was used as the Monte Carlo simulation tool to determine possible elements from the NAA for comparison to the experimental data. Similar geometry from Fantinova et al for BE3825 was used for MCNP6 simulation [21]. In the MCNP6 simulation, photon flux tally (F1) was used to separately simulate delayed gamma lines of experimentally identified elements. Since only delayed gamma lines were simulated, escape peaks, annihilation peaks, and Compton edges were not expected to exactly match experimental results. In order to simulate delayed gamma ray emission, an ACT card in MCNP6 was used to invoke delayed gamma lines in non-fission products. Only thermal neutrons in the source definition were simulated for irradiation in order to prevent interference reactions. 1024 energy bins were used, which resulted in a tally error of less than 10%. Simulated gamma lines were scaled for better visualization of experimental results. This scaling did not affect confirmation because the simulated gamma lines do not represent quantitative information. Experimental data were normalized and shifted onto the vertical axis, which represented the counts.
2.3. Quantitative analysis
MCNP6 neutron activation simulation assumes ideal detectors. The presence of non-ideal detector properties and statistical error caused the gamma peaks to broaden. Thus, the height of these gamma peaks was no longer comparable to the gamma intensities measured by our experiments. Therefore, the simulation only provided qualitative information about the presence of trace elements. Nevertheless, approximations about the material concentrations could be made without making an accurate quantitative analysis. The mass of a given element in a sample could be calculated by using equation (1) [22].
| (1) |
where Pk is the net counts under the peak, λi+1 is the decay constant of isotope with atomic number Ai+1, NA is Avogadro’s number, σi is the neutron absorption cross-section of isotope Ai, ϕ is the neutron flux, Ek is the energy of the peak, ε(Ek) is the detector efficiency at Ek, t0 is the neutron activation time, t2 − t1 is the counting time, ek is the emission probability of the decay, Ai is the mass number of isotope Ai and ai is the abundance of isotope Ai
Use of the same experimental setup for the different kidney stones allowed comparison of concentrations without making a further quantitative analysis, which could have resulted in large errors due to detector inefficiency and inaccurate neutron flux values. Comparisons of concentrations of the same element in four different samples can be practically approximated by the net counts of a peak since all parameters in equation (1) are identical for the same elements. Element concentrations were normalized to Zn in apatite for comparison with the other elements in the other three samples (uric acid, calcium oxalate mono-hydrate, struvite). Many parameters in equation (1) were canceled out for the same elements when conditions for both irradiation and counting were identical. Then, the ratio of equation (1) for two types of kidney stones for the same element was simplified as
| (2) |
where mZn is the mass of Zn in apatite sample, mi is the mass of Zn in ith sample, i—uric acid, calcium oxalate monohydrate, struvite, Pk,Zn is the net count of Zn isotope in apatite sample and Pk,i is the net count of Zn isotope in ith type sample.
In order to obtain the mass concentration of a given element in a sample, equation (3) was used. The masses of different samples from table 2 were used in the calculation:
| (3) |
where mAPA is the mass of apatite sample and mi is the mass of the ith sample, i—uric acid, calcium oxalate monohydrate, struvite.
To compare different elements with Zn, the equation (1) becomes as
| (4) |
where j: Ca, Br.
Equation (4) helped to compare masses of Ca and Br with Zn. By dividing the calculated masses by the sample masses, similar to equation (3), relative mass concentrations were obtained.
The major source of error in equations (2)–(4) is the error from the measurement of Pk. For error on the relative concentration calculation, error propagation can be employed. For example, if equation (3) is called f function,
| (5) |
then, assuming the error associated with mass measurements is negligible, the standard deviation of f can be calculated as
| (6) |
3. Results
The experimental setup was designed to reveal trace elements that require longer irradiation times during activation and have longer half-lives (T1/2 > 12 h). Counting times were for 3 h, 8 h, and 12 h. As many of the trace elements had overlapping gamma energies, the use of different time segments allowed us to do half-life eliminations of these elements. Elements that had shorter half-lives appeared in the 3 h spectrum. Those elements were then suppressed relative to elements that have longer half-lives due to greater decay in the 8 h and 12 h measurements.
Table 3 summarizes identified elements from the experimental data. A total of 11 elements were found. Na, Br, Zn, and Au were found in all four kidney stones. Apatite kidney stones had all 11 elements present. The fewest elements were found in struvite stones. Additional elements may be present, but were hidden because of experimental limitations.
Table 3.
Elements identified in the four evaluated kidney stones.
| Apatite | Uric acid | Calcium oxalate monohydrate | Struvite | Half life |
|---|---|---|---|---|
| Na | Na | Na | Na | Na-24: 14.9 h |
| K | K | — | K | K-42: 12.3 h |
| Ca | Ca | Ca | — | Ca-47: 14.5 d |
| Br | Br | Br | Br | Br-82: 35.3 h |
| Sm | Sm | Sm | — | Sm-153: 46.3 h |
| Zn | Zn | Zn | Zn | Zn-65: 244.3 d |
| Cd | Cd | Cd | — | Cd-115: 53.5 h Yb-175: 4.2 d |
| Yb | — | — | — | Yb-169: 32 d Au-198: 2.7 d |
| Au | Au | Au | Au | Au-199: 3.1 d |
| Co | — | — | Co | Co-60: 5.3 y |
| Mn | — | — | — | Mn-54: 312.3 d |
Table 4 illustrates the relative concentrations of Zn, Ca, and Br in the four different types of kidney stones. The Zn concentration was found to be the highest in apatite. A positive correlation was suggested by Srivastava et al [2] and Lin et al [6] between Zn and Ca, was found in this study (table 4). The least amount of Zn was found in struvite, which also had no Ca and the highest Br concentration. Apatite had the highest Zn and the lowest Br concentrations. A negative correlation between Zn and Br was found in the apatite, calcium oxalate monohydrate, and struvite stones, although confirmation in a larger sample size is needed. The Br concentration in the struvite stone (which had no Ca) was found to be much higher than that in the other three types of stones.
Table 4.
Comparison of relative element concentrations in four kidney stones.
| Apatite | Uric acid | Calcium oxalate monohydrate | Struvite | |
|---|---|---|---|---|
| Zn | 1 ± 0.0012 | 0.426 35 ± 0.000 68 | 0.593 31 ± 0.000 87 | 0.139 44 ± 0.000 78 |
| Ca | 38.451 ± 0.171 | 2.142 ± 0.076 | 35.271 ± 0.144 | 0 |
| Br | 0.002 869 ± 0.000 012 | 0.000 2879 ± 0.000 0003 | 0.002 998 ± 0.000 006 | 0.010 752 ± 0.000 011 |
Figures 1 through 10 show gamma spectrum for apatite, uric acid, calcium oxalate monohydrate, and struvite type kidney stones. In these figures, peaks identified by finite detector size and annihilation peaks are labeled with black arrows. Peaks which were identified from the experimental data, but were not found by the simulation, are labeled with gray arrows. The gamma spectra show experimental data along with MCNP6 simulated results. Only Na, K, Br, Zn, Cd, Au elements were extracted from the simulation of the experimental setup. This was mainly due to the lack of a neutron activation data library in MCNP6. As gamma lines were scaled for a better representation, they do not represent the concentrations of the elements.
Figure 1.

Apatite kidney stone using NAA method with 3 h counting time.
Figure 10.

Struvite kidney stone using NAA method with 12 h counting time.
4. Discussion
A drawback to our study was the lack of a sufficient number of kidney stone samples, which prohibited us from drawing a firm conclusion on the presence and concentration of the observed trace elements. However, this work presents multiple findings consistent with the literature, thereby demonstrating the feasibility of the technique. Larger scale studies are required to draw firm conclusions.
Because of the detector response and the overlapping gamma lines of many elements, an accurate analysis of complex gamma spectra was a concern. However, MCNP6 provided a fast and accurate check of trace element identifications. As shown in figures 1–10, gamma peaks from the simulation were in good agreement with the peaks from measurements. As an example, some of the gamma peaks from Br-82 and Rb-82m were the same. The half-life of each element was within a detectable range (35.3 h and 6.4 h, respectively), but isotopes were easily identified, as only Br-82 was shown to be present by simulation.
Comparisons of different types of the kidney stones revealed that Br and Zn have an important role. This importance requires further investigation and analysis of the relationship. In addition, an approximate quantitative analysis could be obtained from a reliable simulation. Methods for more accurate quantitative analysis will be developed in future studies.
The experimental setup did allow researchers to compare concentrations of elements without making detailed quantitative analyses. Moreover, measurements of different time periods under the same setup provided approximations of the concentrations of different elements without quantitative calculations that could have caused large errors for small amounts. However, the setup was not designed to reveal elements with a half-life of less than ∼1 h. Elements with short half-lives may or may not have been present in the samples.
5. Conclusion
In this study, we used delayed NAA to examine four different types of kidney stones using an improved method. Most elements identified from this study were in agreement with previous studies that also used NAA. Even though the correlation between Ca and Zn agreed with previous findings, more samples and statistical analyses are required for future study. In addition, high concentrations of Br were identified in struvite kidney stones, but no Ca was found. In addition, a negative correlation between Zn and Br was found in non-uric acid stones.
The described experimental setup (i.e. multiple measurements with different decay time) promises more accurate results than does a single gamma spectrum from neutron activation. Furthermore, the setup allowed researchers to predict concentrations of different elements in the various spectra.
Besides the experimental strength on precision of concentration analysis, MCNP6 makes faster and accurate cross-check of gamma spectrum to eliminate human error. This methodology was used for the first time in kidney stone element identification. As the MCNP6 code is improved, better simulations of experimental results will become available. Analysis of detector resolution could be done that would include detector response to gamma spectra that would improve simulation.
Figure 2.

Apatite kidney stone using NAA method with 8 h counting time.
Figure 3.
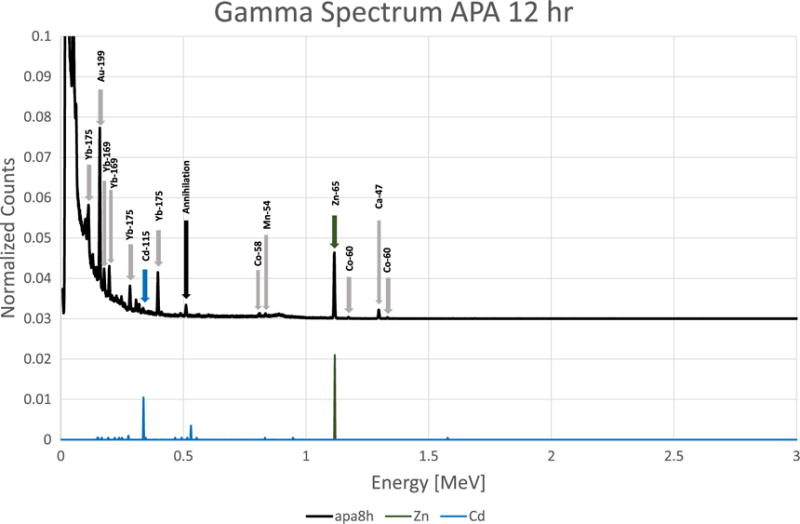
Apatite kidney stone using NAA method with 12 h counting time.
Figure 4.

Uric acid kidney stone using NAA method with 3 h counting time.
Figure 5.

Uric acid kidney stone using NAA method with 8 h counting time.
Figure 6.

Calcium oxalate monohydrate kidney stone using NAA method with 3 h counting time.
Figure 7.

Calcium oxalate monohydrate kidney stone using NAA method with 8 h counting time.
Figure 8.

Struvite kidney stone using NAA method with 3 h counting time.
Figure 9.
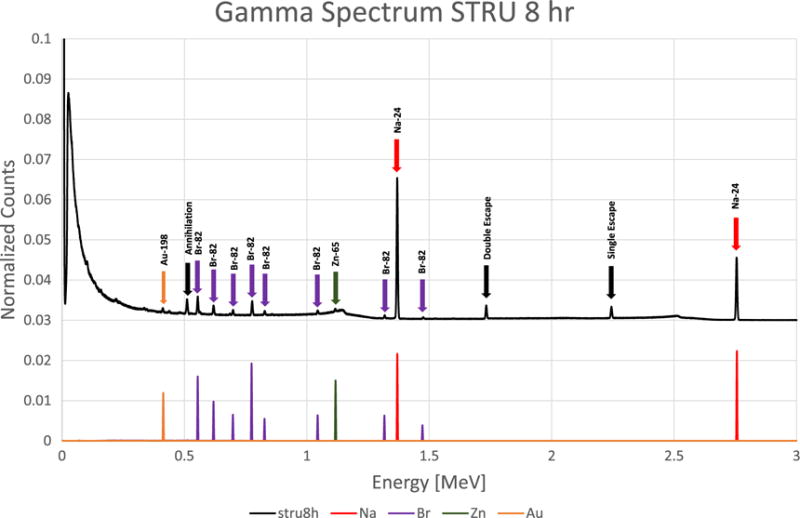
Struvite kidney stone using NAA method with 8 h counting time.
Acknowledgments
This work is supported by the US Nuclear Regulatory Commission (NRC) Faculty Development Grant under Grant No. NRC-HQ-12-G-38-0039.
References
- 1.Romero V, Akpinar H, Assimos DG. Kidney stones: a global picture of prevalence, incidence, and associated risk factors. Rev Urol. 2010;12:e86–e96. [PMC free article] [PubMed] [Google Scholar]
- 2.Srivastava A, Swain KK, Vashisht B, Aggarwal P, Mete U, Acharya R, Wagh DN, Reddy AVR. Studies of kidney stones using INAA, EDXRF and XRD techniques. J Radioanal Nucl Chem. 2014;300:191–4. [Google Scholar]
- 3.Sarmani S, Kuan LL, Bakar MA. Instrumental neutron activation analysis of kidney stones. Biol Trace Elem Res. 1990:26–27. 497–502. doi: 10.1007/BF02992705. [DOI] [PubMed] [Google Scholar]
- 4.Singh VK, Rai PK. Kidney stone analysis techniques and the role of major and trace elements on their pathogenesis: a review. Biophys Rev. 2014;6:291–310. doi: 10.1007/s12551-014-0144-4. [DOI] [PMC free article] [PubMed] [Google Scholar]
- 5.Höbarth K, Koeberl C, Hofbauer J. Rare-earth elements in urinary calculi. Urol Res. 1993;21:261–4. doi: 10.1007/BF00307707. [DOI] [PubMed] [Google Scholar]
- 6.Lin SM, Tseng CL, Yang MH. Determination of major, minor and trace elements in urinary stones by neutron activation analysis. Int J Radiat Appl Instrum A. 1987;38:635–9. doi: 10.1016/0883-2889(87)90130-4. [DOI] [PubMed] [Google Scholar]
- 7.Levinson AA, Nosal M, Davidman M, et al. Trace elements in kidney stones from three areas in the United States. Invest Urol. 1978;15:270. [PubMed] [Google Scholar]
- 8.Bazin D, Chevallier P, Matzen G, Jungers P, Daudon M. Heavy elements in urinary stones. Urol Res. 2007;35:179–84. doi: 10.1007/s00240-007-0099-z. [DOI] [PubMed] [Google Scholar]
- 9.Singh VK, Rai AK, Rai PK, Jindal PK. Cross-sectional study of kidney stones by laser-induced breakdown spectroscopy. Lasers Med Sci. 2009;24:749–59. doi: 10.1007/s10103-008-0635-2. [DOI] [PubMed] [Google Scholar]
- 10.Donev I, Mashkarov S, Maritchkova L, Gotsev G. Quantitative investigation of some trace elements in renal stones by neutron activation analysis. J Radioanal Chem. 1977;37:441–9. [Google Scholar]
- 11.Jaćimović L, Drašković R, Ostojić B. Determination of some trace elements in some human concretions. J Radioanal Chem. 1977;37:415–9. [Google Scholar]
- 12.Giannossi ML, Summa V, Mongelli G. Trace element investigations in urinary stones: a preliminary pilot case in Basilicata (Southern Italy) J Trace Elem Med Biol. 2013;27:91–7. doi: 10.1016/j.jtemb.2012.09.004. [DOI] [PubMed] [Google Scholar]
- 13.Al-Kofahi MM, Hallak AB. Analysis of kidney stones by PIXE and RBS techniques. X-Ray Spectrom. 1996;25:225–8. [Google Scholar]
- 14.Chaudhri MA, Watling J, Khan FA. Spatial distribution of major and trace elements in bladder and kidney stones. J Radioanal Nucl Chem. 2007;271:713–20. [Google Scholar]
- 15.Slojewski M. Major and trace elements in lithogenesis. Cent Eur J Urol. 2011;64:58–61. doi: 10.5173/ceju.2011.02.art1. [DOI] [PMC free article] [PubMed] [Google Scholar]
- 16.Crankovic GM. ASM Handbook (Materials Characterization) 9th. Vol. 10. Materials Park: ASM International; 1986. [Google Scholar]
- 17.Glascock DM. Overview of Neutron Activation Analysis. Columbia: Missouri University Archaeometry Laboratory; 2010. ( http://archaeometry.missouri.edu/naa_overview.html) [Google Scholar]
- 18.Pelowitz DB, editor. MCNP6 user’s manual version 1.0. 2013. (Report LA-CP-13-00634 Los Alamos National Laboratory). [Google Scholar]
- 19.Durkee JW, Jr, et al. MCNPX delayed-gamma feature enhancements LA-UR-10-03383 2010 [Google Scholar]
- 20.Alfassi Z. Activation Analysis. Boca Raton, FL: CRC; 1990. [Google Scholar]
- 21.Fantínová K, Fojtík P. Monte Carlo simulation of the BEGe detector response function for in vivo measurements of 241Am in the skull. Radiat Phys Chem. 2014;104:345–50. [Google Scholar]
- 22.Tsoulfanidis N. Measurement and Detection of Radiation. 2nd. Boca Raton, FL: CRC; 1995. [Google Scholar]