Abstract
The purpose of this study was to examine the association between serum uric acid (sUA) and the incidence of hypertension in nonmetabolic syndrome (non-MetS) subjects.
This was a prospective observational study including 23,525 subjects who had been followed up for at least 5 years. A logistic regression model was used to assess independent risk factors associated with hypertension. An area under the receiver operating characteristic curve (auROC) was generated, and a nomogram was developed to assess diagnostic ability of sUA and the sUA-based score.
We enrolled 11,642 subjects, and 763 (6.55%) were diagnosed with hypertension at the 5-year follow-up. Subjects were classified into 4 groups based on the sUA quarter. Using Q1 as the reference group, Q2, Q3, and Q4 were found to show a higher risk for the development of hypertension with odds ratio of 1.51 (1.15, 1.98), 1.72 (1.30, 2.27), and 2.27 (1.68, 3.06), respectively (P < .001) after adjusting for other known confounding variables. Interaction analysis showed that there was no significant difference between subgroups stratified on the basis of sex, age, body mass index, fasting plasma glucose, and high-density lipoprotein cholesterol except triglycerides (P = .006). The auROCs for sUA and the sUA-based score were 0.627 (0.607, 0.647) and 0.760 (0.742, 0.777), respectively. A nomogram comprising independent risk factors was developed to predict the 5-year risk of hypertension for each subject.
High sUA was significantly associated with the incidence of hypertension in non-MetS subjects adjusting for confounders.
Keywords: incidence of hypertension, nonmetabolic syndrome, serum uric acid
1. Introduction
Hypertension is an important public health challenge globally because of its high prevalence and a strong association with concomitant risks of stroke, cardiovascular disease (CAD), end-stage renal disease, and overall mortality that affects all segments of the population.[1,2] In 2010, the global prevalence of hypertension was estimated to be 29.8% of the world's adult population (30.7% in men and 28.8% in women).[2] A high blood pressure epidemic predisposes to an increased risk of adverse outcomes and associated costs; thus, strategies for prevention and appropriate treatment should be implemented to modify these trends. In addition, the efficacy of various modalities to help identify subjects at high risk has been gaining attention.
Previous studies showed that circulating high uric acid (UA) levels were associated with increased prevalence of hypertension and a high-risk status of cardiovascular complications which frequently leads to poor patient prognosis.[3–6] The potential mechanisms to account for these associations may be diverse; that is, endothelial dysfunction, a vascular smooth muscle cell proliferation, insulin resistance, and impaired endothelial nitric oxide productions.[7] Although evidence has suggested that elevated serum UA (sUA) levels might play a role in the development of hypertension, the relationship between sUA and blood pressure is confounded by numerous factors, and hence this subject continues to remain controversial. What's more, elevated sUA levels are also prevalent in patients with metabolic syndrome (MetS), which return to affect development of hypertension and sUA levels.[8–10] Confirming the involvement of elevated sUA levels in the pathogenesis of hypertension has been difficult, because MetS can confound the relationship between elevated sUA levels and hypertension because they share common pathophysiological features. For these reasons, controlling for MetS is important in clinical studies that examine the association between elevated sUA levels and the incidence of hypertension.
In this study, we aimed to assess the association between sUA levels and the incidence of hypertension in non-MetS subjects. In additional, we developed the sUA-based score and nomogram to assess the prognostic ability of sUA when used in combination with other risk factors.
2. Materials and methods
2.1. Subjects
This was a prospective observational study performed between 2007 and 2010 at the Health Examination Center of the First Affiliated Hospital of Zhejiang Chinese Medical University. We included 23,525 subjects who had been followed up for least 5 years prior to enrollment in this study. Informed consent was obtained from all subjects. They were informed that the data relating to this study would possibly be used for academic purposes. Confidentiality was maintained in all subjects, and all personal or identifying information was eliminated from the data. The study protocol was approved by the Institutional Ethical Review Committee of the First Affiliated Hospital of Zhejiang Chinese Medical University.
Subjects were selected after application of the following exclusion criteria:
Step 1: We excluded 3564 subjects <18 or >60 years of age.
Step 2: We excluded 7612 subjects presenting with any component of MetS (systolic blood pressure/diastolic blood pressure [SBP/DBP] ≥ 140/90 mm Hg or a prior diagnosis of hypertension, body mass index [BMI] ≥ 25 kg/m2, fasting plasma glucose [FPG] ≥ 6.1 mmol/L, triglycerides [TG] ≥ 1.7 mmol/L, high-density lipoprotein cholesterol [HDL-C] < 0.9 mmol/L in men and <1.0 mmol/L in women).
Step 3: We excluded 707 subjects with history of consumption or smoking, or use of medications known to affect components of MetS or sUA levels. After excluding these subjects, 11,642 subjects were enrolled as the study cohort.
2.2. Data collection
A standard protocol for health checkups was followed at the Health Examination Center of Hangzhou, and checkups were performed by senior nursing staff. Clinical examination and data recording were performed in the morning after an overnight fast, and subjects were instructed to refrain from exercise the day prior to their examination.
Both SBP and DBP were measured twice on the right arm by trained medical staff using a noninvasive automated sphygmomanometer (OMRON, Japan) with subjects in a sitting position in a quiet environment. Hypertension was defined as SBP ≥ 140 or DBP ≥ 90 mm Hg or history of intake of antihypertensive medication. BMI was used as an index of body fat and was calculated as the weight (kg) divided by the square of height (m2).
Blood samples were drawn from the antecubital vein for biochemical analysis, primarily to assess FPG, total cholesterol (TC), TG, HDL-C, low-density lipoprotein cholesterol (LDL-C), sUA, and creatinine. The creatinine clearance rate (Ccr) was calculated using the formula: Ccr = (140 − age) × weight (kg)/[72 × serum creatinine (Scr) (mg/dL)] (× 0.85 for women).
2.3. Statistical analysis
All data were tested for normal distribution using the Kolmogorov–Smirnov test and continuous variables of normal were expressed as mean ± standard deviation. Categorical values were expressed as absolute and relative frequencies. The t test or χ2 test was used to evaluate differences between groups. We used a generalized additive model (GAM) to determine the relationship between sUA and the incidence of hypertension. Then subjects were classified into 4 groups based on the sUA quarter: Q1 < 210 μmol/L, 210 μmol/L ≤ Q2 < 257 μmol/L, 257 μmol/L ≤ Q3 < 318 μmol/L, and Q4 ≤ 318 μmol/L. We used a logistic regression model adjusted for confounders to assess independent risk factors associated with the incidence of hypertension. In addition, we generated an area under the receiver operating characteristic curve (auROC), which is a measure of discrimination, to assess the diagnostic ability of sUA in determining the incidence of hypertension. Next, a nomogram was developed to represent results obtained from the multivariate model, estimating decrease of sUA and other independent risk factors from baseline starting from considered covariates. The nomogram was developed using model coefficients to assign points to characteristics and predictions from the model to map cumulative point totals. All statistical analysis was performed using R software version 3.0.1 (R Foundation for Statistical Computing, Vienna, Austria). A P value < .05 (2-sided) was considered statistically significant.
3. Results
3.1. Subject characteristics
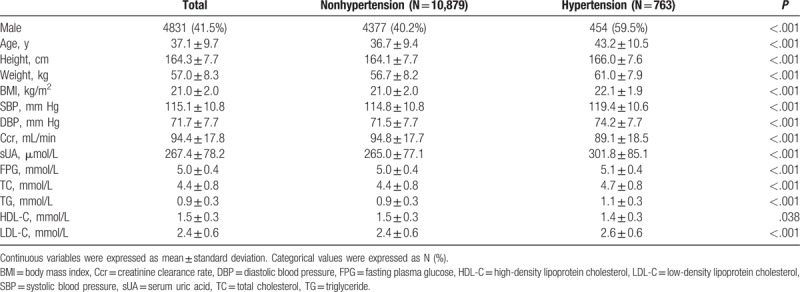
We included 11,642 subjects in our study. Mean age of subjects was 37.1 ± 9.7 years, and 763 (6.55%) were diagnosed with hypertension at the 5-year follow-up. Baseline characteristics of 11,642 subjects stratified on the basis of hypertension are shown in Table 1. Mean age of hypertensive subjects was 36.7 ± 9.4 years and that of nonhypertensive subjects was 43.2 ± 10.5 years (P < .001). Baseline SBP and DBP were higher in those diagnosed with hypertension (119.4 ± 10.6 vs. 114.8 ± 10.8 mm Hg, 74.2 ± 7.7 vs. 71.5 ± 7.7 mm Hg, respectively, both P < .001). And the average SBP and DBP at 5-year were 149.9 ± 9.9 and 95.4 ± 6.2 mm Hg in hypertensive subjects. Table 1 shows higher sUA levels in hypertensive subjects compared with nonhypertensive subjects (301.8 ± 85.1 vs. 265.0 ± 77.1 μmol/L, respectively, P < .001). BMI, Ccr, FPG, TC, TG, and LDL-C values were significantly higher in hypertensive subjects, while the HDL-C value was observed to be lower.
Table 1.
Baseline characteristics of patients.
3.2. Association between sUA and incidence of hypertension
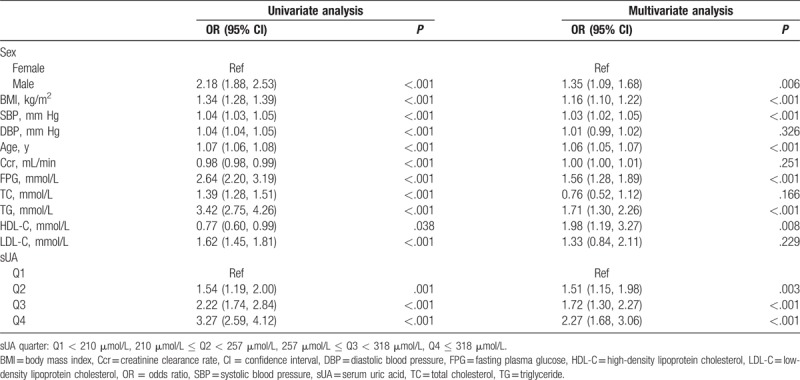
A GAM was used to determine the relationship between sUA and incidence of hypertension. As shown in Fig. 1, sUA demonstrated a positive association with risk of hypertension regardless of adjustments for confounding variables. In addition, we found a turning point in the curve. When the sUA level was >500 μmol/L, the incidence of hypertension showed a sudden increase. To gain a deeper understanding of the relationship between the sUA level and the incidence of hypertension, subjects were classified into 4 groups based on the sUA quarter: Q1 < 210 μmol/L, 210 μmol/L ≤ Q2 < 257 μmol/L, 257 μmol/L ≤ Q3 < 318 μmol/L, Q4 ≤ 318 μmol/L. Higher sUA levels were significantly associated with a higher incidence of newly developed hypertension over a period of 5 years: 3.4% (Q1), 5.2% (Q2), 7.3% (Q3), and 10.3% (Q4), respectively (P < .001). This increasing trend is particularly prominent in the group showing the highest sUA level. As Table 2 shows, considering Q1 as the reference group, Q2, Q3, and Q4 demonstrated a higher risk for hypertension with odds ratios (ORs) of 1.54 (1.19, 2.00), 2.22 (1.74, 2.84), and 3.27 (2.59, 4.12), respectively. Adjusting for other known confounding variables, compared with Q1, ORs of Q2–Q4 were 1.51 (1.15, 1.98), 1.72 (1.30, 2.27), and 2.27 (1.68, 3.06), respectively, which show that sUA was an independent risk factor associated with the incidence of hypertension. Moreover, male sex, BMI, baseline SBP, age, FPG, TG, and HDL-C were demonstrated to be independent risk factors.
Figure 1.
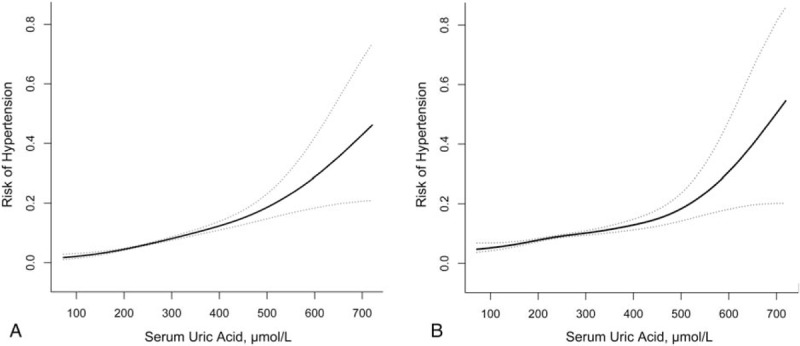
Curve-fitting of serum uric acid and risk of hypertension. (A) Unadjusted and (B) adjusted for age, sex, body mass index, systolic blood pressure, diastolic blood pressure, creatinine clearance rate, fasting plasma glucose, triglycerides, total cholesterol, high-density lipoprotein cholesterol, and low-density lipoprotein cholesterol.
Table 2.
Univariate and multivariate analyses of risk factors for hypertension.
3.3. Interaction between risk factors and the sUA to determine risk of hypertension
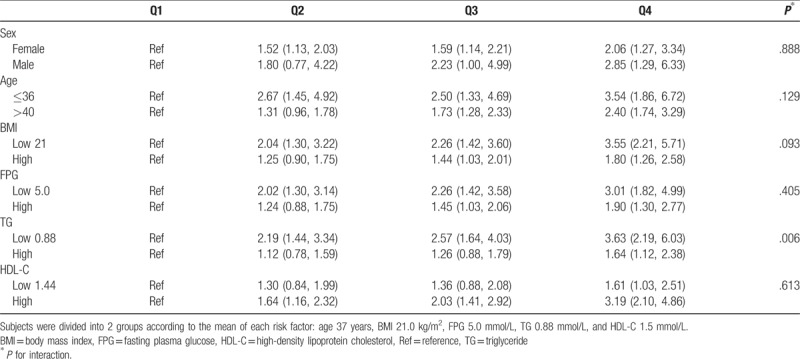
We investigated the interaction between the sUA and other independent risk factors. Stratified analyses were performed based on sex, age, BMI, FPG, TG, and HDL-C as variables. As shown in Table 3, in the high TG group, compared with Q1, the ORs of Q2–Q4 were 1.12 (0.78, 1.59), 1.26 (0.88, 1.79), and 1.64 (1.12, 2.38), respectively, while in the low TG group these values were 2.19 (1.44, 3.34), 2.57 (1.64, 4.03), and 3.63 (2.19, 6.03), respectively. The P value of interaction was 0.006 indicating that the TG level demonstrates a significant interaction with the sUA in terms of development of new hypertension. There were no significant interactions between the remaining subgroups (P > .05 for all comparisons), including sex (P = .888), age (P = .129), BMI (P = .093), FPG (P = .405), and HDL-C (P = .613).
Table 3.
The interaction between risk factors and serum uric acid for risk of hypertension.
3.4. Diagnostic ability of sUA and nomogram analysis
The auROC was generated to assess the diagnostic ability of sUA in determining the incidence of hypertension. Figure 2 shows that the auROC of sUA is 0.627 (0.607, 0.647) with a sensitivity of 0.633 and specificity of 0.560. Next, we developed a new prognosis score based on independent risk factors using a multivariate logistic regression model as shown in Table 2:
 |
Figure 2.
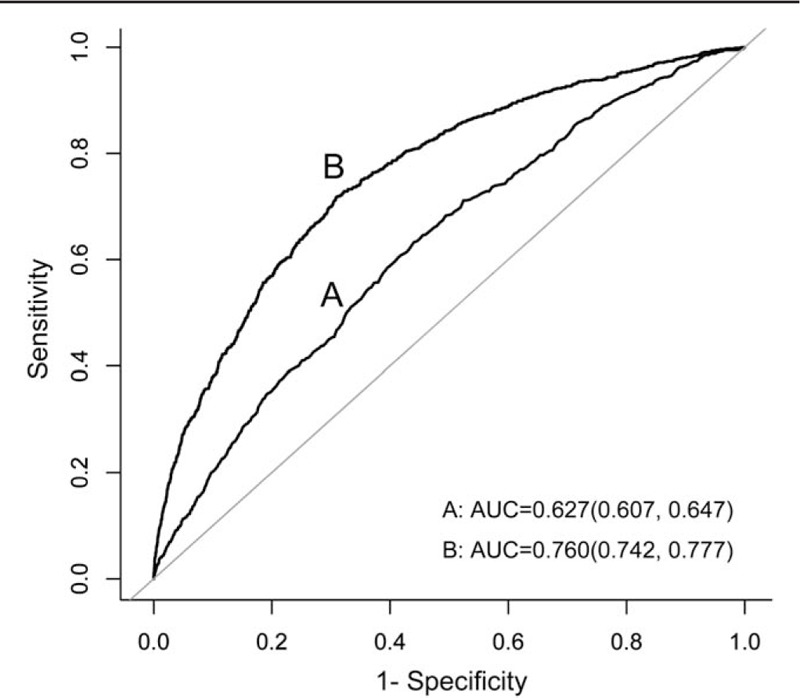
Receiver operating characteristic curve of sUA and sUA-based score for risk of hypertension. The sUA-based score = −17.15606 + 0.00462 × sUA + 0.05323 × AGE + 0.43808 × FPG + 0.43968 × TG + 0.33417 × HDL-C + 0.16260 × BMI + 0.03775 × SBP. BMI = body mass index, FPG = fasting plasma glucose, HDL-C = high-density lipoprotein cholesterol, SBP = systolic blood pressure, sUA = serum uric acid, TG = triglycerides.
The auROC of the score was 0.760 (0.742, 0.777) with a sensitivity of 0.718 and specificity of 0.691. A novel clinical prognostic nomogram was developed to predict the 5-year risk of hypertension for an individual patient (Fig. 3). The risk score ranging from 0 to 350 for an individual patient is the weighted sum of the individual predictors with weights equal to regression coefficients (log hazard ratio) using the logistic model mentioned above.
Figure 3.
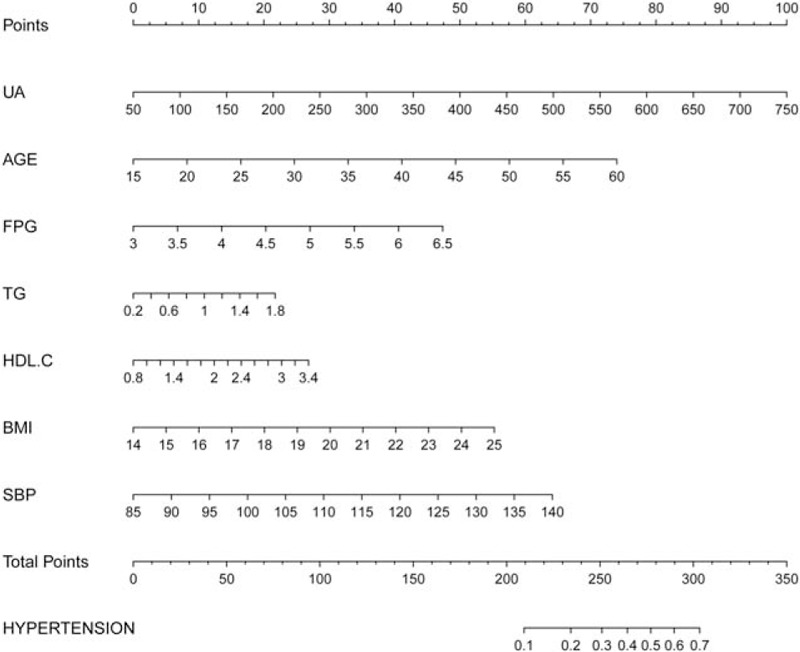
A nomogram to predict 5-year risk of hypertension for an individual patient. The risk score ranging from 0 to 350 for an individual patient is the weighted sum of individual predictors with weights equal to the regression coefficients in the sUA-based score = −17.15606 + 0.00462 × sUA + 0.05323 × AGE + 0.43808 × FPG + 0.43968 × TG + 0.33417 × HDL-C + 0.16260 × BMI + 0.03775 × SBP. BMI = body mass index, FPG = fasting plasma glucose, HDL-C = high-density lipoprotein cholesterol, SBP = systolic blood pressure, sUA = serum uric acid, TG = triglycerides.
4. Discussion
This study indicated that a high sUA level is associated with an increased incidence of hypertension at 5-year follow-up in non-MetS subjects adjusting for confounders. Interaction analysis demonstrated that sUA plays a relative stable role in the development of hypertension. Moreover, we developed a new score based on selected independent risk factors and assessed its diagnostic ability after performing ROC analysis. In addition, a nomogram was developed to predict 5-year risks of hypertension for each patient.
Several studies have reported an association between sUA and hypertension. For instance, a Chinese senior dynamic cohort study, which included 3591 nonhypertensive subjects reported that the 4.69 to 5.58, 5.58 to 6.52, and ≥6.52 mg/dL quartiles yielded hazard ratios (95% confidence interval [CI]] of 1.652 (1.265–2.156), 2.195 (1.705–2.825), and 3.058 (2.399–3.899), respectively, for hypertension compared with the lowest sUA quartile (<4.69 mg/dL).[4] Another study, which included 5748 adolescents between 10 and 15 years of age at baseline with a median 7.2 years of follow-up, demonstrated that a high sUA level was the second or third best predictor for hypertension in both genders (hazard ratio 2.92 for males and 5.22 for females, P < .05), using cut-off points of sUA for adolescent males and females (7.3 and 6.2 mg/dL, respectively).[11] In addition to these studies, others have reported an association between hyperuricemia and the risk of incident prehypertension. A cross-sectional study among 4817 National Health and Nutrition Examination Survey 1999 to 2002 nonhypertensive subjects aged ≥18 years revealed that higher sUA levels were positively associated with prehypertension, independent of smoking, BMI, diabetes, kidney function, and other confounders, with the multivariate OR (95% CI) of sUA (>356.9 mmol/L) being 1.96 (1.38–2.79) compared with quartile 1 (<237.9 mmol/L).[12] Due to the MetS confounding the relationship between elevated sUA levels and hypertension, we included a non-MetS population. Our major founding shows a significant association between sUA and hypertension incidence, consisting with that in MetS population. In addition, interaction analysis revealed the stable impact of sUA on hypertension incidence, independent of the variation in sex, age, BMI, FPG, TG, and HDL-C. All of above demonstrated the stable role of sUA on development of hypertension.
Our study revealed that hyperuricemia was significantly associated with the incidence of hypertension even after adjustment for known confounders. Several potential pathomechanisms explain the association between sUA and the elevated risk of hypertension. One such explanation involves the role of insulin resistance. Elevated insulin levels lead to low urinary ammonium levels and predispose to the precipitation of UA.[13,14] Insulin resistance acts via distinct and independent mechanisms and contributes to the development of several metabolic disorders, whose impact on the development of CAD such as hypertension, has been emphasized worldwide.[13,15,16] Conversely, a study reported by Zhu et al[17] demonstrates that a high sUA level could directly induce insulin resistance in vivo and in vitro by inhibiting IRS1 and Akt insulin signaling. Another possible mechanism is the effect of renal dysfunction mediated by an elevated sUA level. Hyperuricemia causes hypertension and renal injury via a crystal-independent mechanism via stimulation of the renin–angiotensin system and inhibition of neuronal nitric oxide synthase.[18,19] A growing body of evidence lends strength to the hypothesis that an elevated sUA level causes vasoconstriction and vascular remodeling that results in hypertension and contributes to the gradual decline in renal function in at-risk individuals.[20,21] Other mechanisms involve the role of endothelial dysfunction.[19] In rats, sUA-induced endothelial dysfunction was demonstrated to be associated with mitochondrial alterations and decreased intracellular adenosine triphosphate.[22] Interestingly, as the main quantitative determinant of total antioxidant capacity (TAOC), sUA is expected to protect against progression of hypertension. sUA plays 2 edged blade in the procession of hypertension: determinant of antioxidant or MetS. However, studies showed that the correlation of TAOC with CAD was yet weaker than UA.[23] In a cross-sectional study of 968 adults, there were not any significant differences in TAOC and the activity of antioxidant enzymes but UA was increased in CAD group.[24]
This study shows multiple strengths; however, several limitations need to be noted: we showed significant associations between elevated sUA levels and the incidences of hypertension in non-MetS; however, no causal relationship could be inferred because this study was observational. Some key data were not obtained such as information regarding central obesity (i.e., waist/hip ratio), as well as lifestyle and dietary factors, which may be helpful to better understand the relationship between sUA levels and hypertension. Moreover, the role of insulin resistance, renin–angiotensin system, endothelial dysfunction, and oxidative stress were not assessed in the study. We did not obtain information regarding the exact time of first appearance of hypertension in subjects. Further studies including more information about hypertension are warranted.
Our study revealed that hyperuricemia was significantly associated with the incidence of hypertension even after adjustment for known confounders. An interaction analysis revealed the stable impact of sUA on the development of hypertension, and a nomogram showed 5-year risk of development of hypertension in each patient. We propose that future studies should focus on gaining a better understanding of and management of sUA and BP levels to prevent cardiovascular events.
Footnotes
Abbreviations: auROC = area under the receiver operating characteristic curve, BMI = body mass index, CAD = cardiovascular disease, Ccr = creatinine clearance rate, CI = confidence interval, DBP = diastolic blood pressure, FPG = fasting plasma glucose, GAM = generalized additive model, HDL-C = high-density lipoprotein cholesterol, LDL-C = low-density lipoprotein cholesterol, MetS = metabolic syndrome, OR = odds ratio, SBP = systolic blood pressure, sUA = serum uric acid, TAOC = total antioxidant capacity, TC = total cholesterol, TG = triglyceride.
This study was supported by the National Natural Science Foundation of China (No. 81673745).
The authors have no conflicts of interest to disclose.
References
- [1].Collaboration NCDRF. Worldwide trends in blood pressure from 1975 to 2015: a pooled analysis of 1479 population-based measurement studies with 19.1 million participants. Lancet 2017;389:37–55. [DOI] [PMC free article] [PubMed] [Google Scholar]
- [2].Mills KT, Bundy JD, Kelly TN, et al. Global disparities of hypertension prevalence and control: a systematic analysis of population-based studies from 90 countries. Circulation 2016;134:441–50. [DOI] [PMC free article] [PubMed] [Google Scholar]
- [3].Yokokawa H, Fukuda H, Suzuki A, et al. Association between serum uric acid levels/hyperuricemia and hypertension among 85,286 Japanese workers. J Clin Hypertens 2016;18:53–9. [DOI] [PMC free article] [PubMed] [Google Scholar]
- [4].Wei F, Sun N, Cai C, et al. Associations between serum uric acid and the incidence of hypertension: a Chinese senior dynamic cohort study. J Transl Med 2016;14:110. [DOI] [PMC free article] [PubMed] [Google Scholar]
- [5].Li LX, Dong XH, Li MF, et al. Serum uric acid levels are associated with hypertension and metabolic syndrome but not atherosclerosis in Chinese inpatients with type 2 diabetes. J Hypertens 2015;33:482–90. [DOI] [PMC free article] [PubMed] [Google Scholar]
- [6].Prasad M, Matteson EL, Herrmann J, et al. Uric acid is associated with inflammation, coronary microvascular dysfunction, and adverse outcomes in postmenopausal women. Hypertension 2017;69:236–42. [DOI] [PMC free article] [PubMed] [Google Scholar]
- [7].Feig DI, Kang DH, Johnson RJ. Uric acid and cardiovascular risk. N Engl J Med 2008;359:1811–21. [DOI] [PMC free article] [PubMed] [Google Scholar]
- [8].Rizzo M, Obradovic M, Labudovic-Borovic M, et al. Uric acid metabolism in pre-hypertension and the metabolic syndrome. Curr Vasc Pharmacol 2014;12:572–85. [DOI] [PubMed] [Google Scholar]
- [9].Viazzi F, Garneri D, Leoncini G, et al. Serum uric acid and its relationship with metabolic syndrome and cardiovascular risk profile in patients with hypertension: insights from the I-DEMAND study. Nutr Metab Cardiovasc Dis 2014;24:921–7. [DOI] [PubMed] [Google Scholar]
- [10].Bonakdaran S, Kharaqani B. Association of serum uric acid and metabolic syndrome in type 2 diabetes. Curr Diabetes Rev 2014;10:113–7. [DOI] [PubMed] [Google Scholar]
- [11].Sun HL, Pei D, Lue KH, et al. Uric acid levels can predict metabolic syndrome and hypertension in adolescents: a 10-year longitudinal study. PLoS ONE 2015;10:e0143786. [DOI] [PMC free article] [PubMed] [Google Scholar]
- [12].Syamala S, Li J, Shankar A. Association between serum uric acid and prehypertension among US adults. J Hypertens 2007;25:1583–9. [DOI] [PubMed] [Google Scholar]
- [13].Bonora E, Capaldo B, Perin PC, et al. Hyperinsulinemia and insulin resistance are independently associated with plasma lipids, uric acid and blood pressure in non-diabetic subjects. The GISIR database. Nutr Metab Cardiovasc Dis 2008;18:624–31. [DOI] [PubMed] [Google Scholar]
- [14].Abate N, Chandalia M, Cabo-Chan AV, Jr, et al. The metabolic syndrome and uric acid nephrolithiasis: novel features of renal manifestation of insulin resistance. Kidney Int 2004;65:386–92. [DOI] [PubMed] [Google Scholar]
- [15].Ninomiya T, Kubo M, Doi Y, et al. Impact of metabolic syndrome on the development of cardiovascular disease in a general Japanese population: the Hisayama study. Stroke 2007;38:2063–9. [DOI] [PubMed] [Google Scholar]
- [16].Wu SJ, Zhu GQ, Ye BZ, et al. Association between sex-specific serum uric acid and non-alcoholic fatty liver disease in Chinese adults: a large population-based study. Medicine 2015;94:e802. [DOI] [PMC free article] [PubMed] [Google Scholar]
- [17].Zhu Y, Hu Y, Huang T, et al. High uric acid directly inhibits insulin signalling and induces insulin resistance. Biochem Biophys Res Commun 2014;447:707–14. [DOI] [PubMed] [Google Scholar]
- [18].Mazzali M, Hughes J, Kim YG, et al. Elevated uric acid increases blood pressure in the rat by a novel crystal-independent mechanism. Hypertension 2001;38:1101–6. [DOI] [PubMed] [Google Scholar]
- [19].Kanellis J, Kang DH. Uric acid as a mediator of endothelial dysfunction, inflammation, and vascular disease. Semin Nephrol 2005;25:39–42. [DOI] [PubMed] [Google Scholar]
- [20].Feig DI. Serum uric acid and the risk of hypertension and chronic kidney disease. Curr Opin Rheumatol 2014;26:176–85. [DOI] [PubMed] [Google Scholar]
- [21].Canepa M, Viazzi F, Strait JB, et al. Longitudinal association between serum uric acid and arterial stiffness: results from the Baltimore longitudinal study of aging. Hypertension 2017;69:228–35. [DOI] [PMC free article] [PubMed] [Google Scholar]
- [22].Sanchez-Lozada LG, Lanaspa MA, Cristobal-Garcia M, et al. Uric acid-induced endothelial dysfunction is associated with mitochondrial alterations and decreased intracellular ATP concentrations. Nephron Exp Nephrol 2012;121:e71–8. [DOI] [PMC free article] [PubMed] [Google Scholar]
- [23].Bagheri B, Zargari M, Meshkini F, et al. Uric acid and coronary artery disease, two sides of a single coin: a determinant of antioxidant system or a factor in metabolic syndrome. J Clin Diagn Res 2016;10:OC27–31. [DOI] [PMC free article] [PubMed] [Google Scholar]
- [24].Schisterman EF, Faraggi D, Browne R, et al. Minimal and best linear combination of oxidative stress and antioxidant biomarkers to discriminate cardiovascular disease. Nutr Metab Cardiovasc Dis 2002;12:259–66. [PubMed] [Google Scholar]


