Abstract
Improved understanding of liver physiology and pathophysiology is urgently needed to assist the choice of new and upcoming therapeutic modalities for patients with liver diseases. In this review, we focus on functional PET of the liver: 1) Dynamic PET with 2-deoxy-2-[18F]fluoro-D-galactose (18F-FDGal) provides quantitative images of the hepatic metabolic clearance K met (mL blood/min/mL liver tissue) of regional and whole-liver hepatic metabolic function. Standard-uptake-value (SUV) from a static liver 18F-FDGal PET/CT scan can replace K met and is currently used clinically. 2) Dynamic liver PET/CT in humans with 11C-palmitate and with the conjugated bile acid tracer [N-methyl-11C]cholylsarcosine (11C-CSar) can distinguish between individual intrahepatic transport steps in hepatic lipid metabolism and in hepatic transport of bile acid from blood to bile, respectively, showing diagnostic potential for individual patients. 3) Standard compartment analysis of dynamic PET data can lead to physiological inconsistencies, such as a unidirectional hepatic clearance of tracer from blood (K 1; mL blood/min/mL liver tissue) greater than the hepatic blood perfusion. We developed a new microvascular compartment model with more physiology, by including tracer uptake into the hepatocytes from the blood flowing through the sinusoids, backflux from hepatocytes into the sinusoidal blood, and re-uptake along the sinusoidal path. Dynamic PET data include information on liver physiology which cannot be extracted using a standard compartment model. In conclusion, SUV of non-invasive static PET with 18F-FDGal provides a clinically useful measurement of regional and whole-liver hepatic metabolic function. Secondly, assessment of individual intrahepatic transport steps is a notable feature of dynamic liver PET.
Keywords: PET kinetics, liver PET, liver hemodynamics, liver metabolism, hepatobiliary excretion, hepatic drug metabolism, hepatic galactose PET, hepatic glucose PET, bile acid PET, hepatic palmitate PET
Introduction
The liver plays a key role in the regulation of metabolic homeostasis in the body, first-pass metabolism of ingested substances, detoxification processes, and hepatobiliary excretion. Impairment of these functions can lead to serious, and even life-threatening liver failure. Examination of the liver in vivo is difficult because of its “hidden” position between the splanchnic and the systemic circulation. Consequently most standard liver blood tests are quite non-specific. Additionally, knowledge of specific changes in liver functions is increasingly needed in view of the rapid development of novel therapeutic modalities. Some of these challenges may be successfully approached by functional positron emission tomography (PET), which has a unique capability for imaging and quantifying regional and whole-organ functions in vivo [1]. Functional liver PET comprises scanning of the liver following intravenous administration of a positron-emitting radioactive tracer and calculation of physiological parameters using tracer-specific analysis.
In this review, we first discuss how to account for physiological features concerning tracer supply and kinetic modeling, and we then discuss examples of PET studies of hepatic metabolism, hepatobiliary excretory processes, and drugs in the liver.
Tracer supply
Kinetic parameters of hepatic tracer metabolism or hepatobiliary excretion are traditionally estimated from dynamic PET scan data by fitting a compartment model (Figure 1) to the time courses of the radioactivity concentrations in liver tissue, and using the concentration in the blood supply as a model input function. The tracer supply to the liver is dual from the systemic circulation via the hepatic artery (25%) and from the splanchnic circulation via the portal vein (75%). Following intravenous bolus administration of tracer, the arterial blood tracer concentration rapidly increases to a peak and then decreases (Figure 2, left panel, and Figure 3). The concentration of tracer in the hepatic artery (C HA(t)) is identical to that in other arteries, such as the femoral or radial artery C A(t), from which blood can be sampled. The peak of the portal vein concentration of tracer (C PV(t)) is delayed and dispersed compared to that in the HA (Figure 2, left panel, and Figure 3). Blood from the HA and PV mix at the entry of the sinusoids which receives flow-weighted dual-input tracer concentration C dual(t), which can be calculated directly from measured blood concentrations of tracer combined with blood flow measurements of the HA (F HA) and PV (F PV) using the hepatic artery flow fraction, f HA = F HA/(F HA + F PV): C dual(t) = f HA C A(t) + (1 - f HA) C PV(t) [2].
Figure 1.
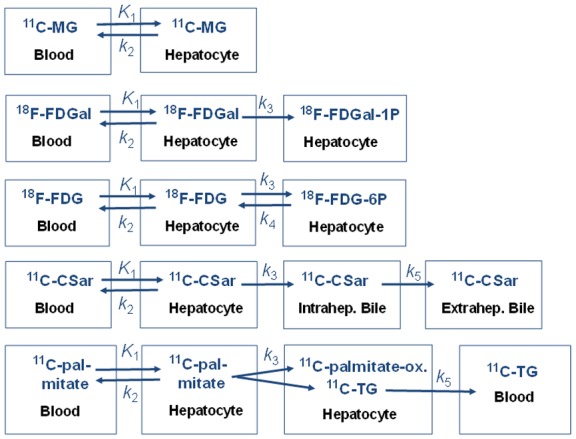
Compartment models fitted to PET data (from top to bottom): 11C-MG undergoes no metabolism; 18F-FDGal undergoes irreversible intracellular phosphorylation; 18F-FDG undergoes reversible intracellular phosphorylation; 11C-CSar undergoes no metabolism but undergoes backflux to blood and hepatobiliary secretion into intra-hepatic and then, extra-hepatic bile. 11C-palmitate undergoes intrahepatic metabolism (esterification, oxidation, production of triglyceride (k 3)) and secretion of metabolites into blood (k 5). Rate constants describe exchange of tracer (and metabolites): K 1 (mL blood/min/mL liver tissue), unidirectional rate constant of transport from blood to hepatocytes (hepatic systemic clearance); k 2 (min-1), backflux of tracer from hepatocytes to blood; k 3 (min-1), metabolism in hepatocytes for 18F-FDGal, 18F-FDG, and 11C-palmitate; and for 11C-CSar transport from hepatocytes into intrahepatic bile canaliculi; k 4 (min-1), dephosphorylation in hepatocytes of 18F-FDG-6-P; k 5 (min-1) for 11C-CSar, transport from intrahepatic bile into extrahepatic bile, and for 11C-palmitate, transport of 11C-triglyceride (11C-TG) from hepatocytes to blood.
Figure 2.

Time courses of the concentrations of 3-O-[11C]methylglucose (11C-MG) in the blood supply to the liver from the HA and PV (left) and dual-input (right). Left: Concentrations measured in the femoral artery (red) and the PV (blue) in a pig experiment following intravenous bolus administration of 11C-MG. The model-derived PV concentration (green) was calculated from the arterial concentration using the PV-model for passage of 11C-MG from the intestinal arteries to the PV (see text). Right: The measured dual-input time courses of the radioactivity concentrations in the blood supply (blue) and that calculated from the measured arterial concentration and the PV-model (green) and the individually measured HA blood flow fractions. (Reproduced from Winterdahl M, et al. Eur J Nucl Med Mol Imaging 2011; 38: 263-270; open access under the CC BY-NC-ND license (http://creativecommons.org/licenses/by-nc-nd/4.0/)).
Figure 3.
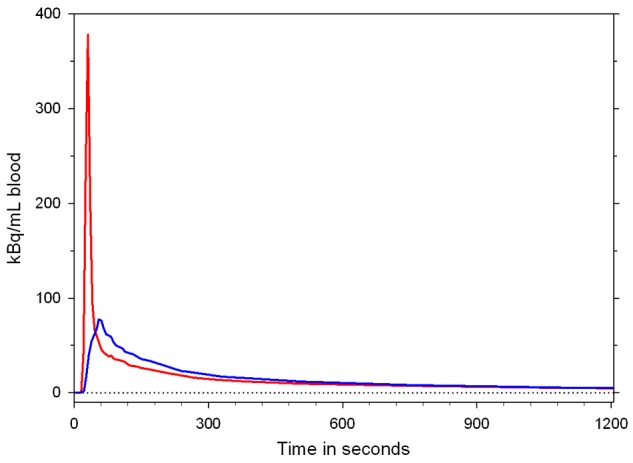
Time courses of concentrations of 18F-FDGal in an artery (red) and the portal vein (blue) after injection of 18F-FDGal in a pig experiment.
In humans, the PV is inaccessible for blood sampling, and we therefore developed a PV-model for the transfer of tracer from the intestinal arteries through the pre-hepatic splanchnic bed to the PV (with no net loss or addition of tracer in the intestines) [3]. The model consists of an impulse-response function with a single tracer-specific parameter (min), which reflects the mean transit time of the tracer through the PV-drained viscera. In pigs, the PV-model provided successful prediction of measured PV concentrations of several tracers (Figure 2, left panel). Consequently, the model-derived C dual(t), using mean f HA = 0.25, was consistent with the measured C dual(t) (Figure 2, right panel) [4].
The kinetic parameters of the rapid transfer of tracer between blood and hepatocytes are estimated from the initial dynamic phase after tracer injection using C dual(t) (K 1 and k 2; Figure 1). This calculation was successfully performed in PET experiments in pigs with blood-sample measured arterial and portal vein tracer concentrations of 2-deoxy-2-[18F]fluoro-D-glucose (18F-FDG) [2], 2-deoxy-2-[18F]fluoro-D-galactose (18F-FDGal) [5], and the bile acid tracer [N-methyl-11C]cholylsarcosine (11C-CSar) [6]. In a PET study of the liver kinetics of 11C-CSar in healthy human participants and patients with liver disease [7], values of K 1 and k 2 for 11C-CSar were estimated using the PV-model transfer parameter for 11C-CSar in pigs [6].
At steady-state after the first minutes after tracer administration, C dual(t) and C A(t) of 18F-FDG [2] and of 18F-FDGal [5], respectively, become similar (Figure 3). Consequently, the hepatic metabolic clearance K met of these carbohydrate tracers (mL blood/min/mL liver tissue), calculated by the graphical Gjedde-Patlak representation of data 10-20 minutes after tracer injection, can be calculated using the C A(t) as input function [2,5] which, for 18F-FDGal in humans, can be extracted by an image-derived input function from the abdominal aorta [8].
Kinetic models
Compartment models
Currently, most analyses of dynamic PET measurements are performed by compartment models that assume uniform tracer concentrations in each compartment at each time point. The rate constants for exchange of tracer and metabolites between the compartments are estimated by fitting a tracer-specific kinetic model (Figure 1) to the time course of radioactivity concentration in liver tissue using C dual(t) or C A(t) as an input function, as mentioned above (Table 1). Although the standard compartment analysis of dynamic PET data has provided valuable insight into liver physiology and pathophysiology, this analysis also shows physiological inconsistencies, as discussed in these three examples:
Table 1.
Models for data analysis
| PET procedure | Blood tracer concentration | Estimated parameters* | |
|---|---|---|---|
| Standard compartment model | Dynamic PET | Dual-input C dual(t) | K 1, k 2, V 0 |
| Gjedde-Patlak linear representation | Dynamic PET | Arterial input | K met |
| Microvascular compartment model | Dynamic PET | Dual-input C dual(t) | F, PS, V b, V c |
| Radioactivity conc. in liver tissue | Static PET | No | SUV |
| Microvascular model | No PET | Dual-input C dual(t), hepatic vein conc | PS, Cl int |
SUV, standardized uptake value (radioactivity concentration kBq/mL liver tissue)/(Injected dose kBq/g body weight); K met, hepatic metabolic clearance (mL blood/min/mL liver tissue); K 1, hepatic unidirectional systemic clearance from blood to hepatocytes (mL blood/min/mL liver tissue); k 2, rate constant for backflux of tracer from hepatocytes to blood (min-1); V 0, vascular volume parameter used in the standard compartment model (mL blood/mL liver tissue); F, hepatic blood perfusion (mL blood/min/mL liver tissue); PS, Permeability-Surface-Area-Product for transport from blood to hepatocytes (mL blood/min/mL liver tissue); V b, blood volume including non-exchanging vessels (mL blood/mL liver tissue); V c, hepatocyte volume (mL/mL liver tissue); Cl int, hepatic intrinsic clearance (mL blood/min/mL liver tissue).
1) The compartment model assumes the transport of tracer from blood to hepatocytes to occur at the blood inlet concentration C dual. This ignores uptake of tracer by the hepatocytes from blood flowing through the sinusoids in vivo and the resulting sinusoidal tracer concentration gradients [9,10].
2) The compartment model assumes backflux of tracer from the hepatocytes directly into the systemic blood circulation (k 2 in Figure 1) and the systemic circulation before it eventually enters the HA and PV. In reality, the backflux of tracer should enter the sinusoid and be available for re-uptake before leaving on the venous side.
3) The transfer of most blood-borne tracers across the hepatocyte plasma membrane is practically unlimited for most PET tracers because of highly fenestrated endothelial cells and numerous efficient transporters on the hepatocyte plasma membrane. The unidirectional clearance of tracer from blood to hepatocytes K 1 (Figure 1) is therefore commonly assumed equal to the hepatic blood perfusion. However, for several tracers, K 1 calculated from compartment modeling of the initial 3-min dynamic PET scan in pigs exceeds the blood perfusion rate [11]. Thus, the liver apparently takes up more tracer than supplied to it by the hepatic blood flow, which is a “supply paradox” [12].
Microvascular compartment model
Because of the abovementioned physiological inconsistencies in the compartment model, we developed a microvascular compartment model that includes more physiology such as tracer uptake from blood into hepatocytes at tracer concentrations along the perfused sinusoids, backflux of tracer from hepatocytes into the sinusoidal blood, and multiple re-uptakes during the passage of tracer through the sinusoid [13]. Using measured data from the 3-min dynamic PET of in vivo pig livers following injection of 3-O-[11C]methylglucose (11C-MG) [2], this new model generated estimates of hepatic blood perfusion that were consistent with independent measurements whereas the standard compartment model overestimated the perfusion. In addition, the microvascular compartment model accurately predicted the time course of tracer concentrations in the liver vein, a prediction fundamentally unobtainable using the standard compartment model because it assumes no return of tracer from hepatocytes into sinusoidal blood. The results of the microvascular compartment model demonstrate that dynamic PET data includes information that cannot be extracted using a standard compartment model. Models that include sinusoidal tracer concentration gradients should be preferred when analyzing the blood-hepatocyte exchange of any tracer. However, the classic microvascular model [14,15] only accounts for unidirectional tracer uptake along the perfused sinusoid with estimates of the hepatocyte plasma membrane permeability surface area (PS) and the overall flow-independent intrinsic clearance (Cl int) of metabolism or hepatobiliary excretion (Table 1), but no backflux. Microvascular compartment models for tracers metabolized in hepatocytes are currently being developed (Munk, unpublished data 2018).
Hepatic carbohydrate metabolism
18F-FDGal PET
Galactose and its 18F-labeled analog 18F-FDGal (Figure 4) are both almost exclusively metabolized in hepatocytes with the rate-limiting step being 1-phosphorylation by galactokinase [10,16,17]. The hepatic removal of galactose in vivo follows Michaelis-Menten saturation kinetics in vivo [10,18,19], and the hepatic galactose removal rate at near-saturating galactose concentration, the galactose elimination capacity (GEC), is used clinically as a measure of the hepatic metabolic function [20,21]. GEC has documented prognostic information for patients with liver diseases [22-26], but it does not provide information on intrahepatic regional variations of the hepatic metabolic function that can be measured by 18F-FDGal PET and may be clinically important.
Figure 4.
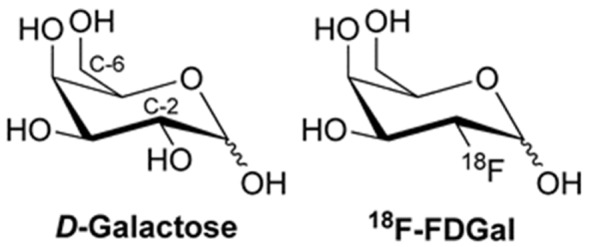
Chemical structures of galactose and 18F-FDGal.
18F-FDGal is easily produced in facilities similar to those used for production of 18F-FDG [27]. Using dynamic PET of the liver and measurements of blood concentrations of 18F-FDGal in an artery and the portal vein (Figure 3), we developed an 18F-FDGal PET method for imaging and quantification of whole-liver and regional hepatic metabolic function by using the hepatic metabolic clearance K met of 18F-FDGal [5]. In healthy human participants [28] and patients with liver disease [19], K met of 18F-FDGal was estimated by the Gjedde-Patlak analysis from 20-min dynamic PET after intravenous administration of the tracer and from image-derived abdominal aorta 18F-FDGal concentration [8]. The K met of 18F-FDGal is predominantly enzyme-determined [19] in contrast to galactose, for which the hepatic systemic clearance (at 1. order kinetics) is predominantly flow-determined in healthy human participants [29]. These differences are due to high and low affinity of the galactokinase for galactose and 18F-FDGal, respectively [16,30]. PET-determined K met of 18F-FDGal can be used as a measure of the in vivo regional hepatic galactokinase activity [28], i.e., a local GEC.
Notably, we recently showed that in both healthy human participants and patients with liver disease, the mean standard-uptake-value (SUV) of 18F-FDGal from a static scan of the liver at 10-20 min after 18F-FDGal injection was linearly related to K met from dynamic scans of the liver (Figure 5) [31]. Consequently, SUV can replace K met for the quantification of whole-liver and regional metabolic function. The average SUV of 18F-FDGal was significantly lower in patients with decompensated cirrhosis than in healthy participants and patients with compensated cirrhosis [31]. We proposed that the regional SUV of 18F-FDGal may be used for preoperative calculation of remnant metabolic liver function, which is of special importance for patients with cirrhosis.
Figure 5.
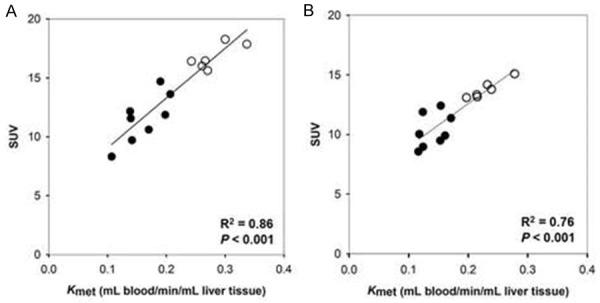
Relationships between SUV and K met of 18F-FDGal PET in healthy humans (open symbols) and patients with cirrhosis (closed symbols) with linear regression lines. Left panel: regional values, right panel: whole-liver values. (Reproduced from Bak-Fredslund KP, et al. EJNMMI Res 2017; 7: 71; open access under the CC BY-NC-ND license (http://creativecommons.org/licenses/by-nc-nd/4.0/)).
Another promising application of 18F-FDGal PET/CT is optimizing the dose-planning of stereotactic body radiotherapy of liver tumors. For patients treated with stereotactic body radiotherapy for colorectal liver metastases, there was a clear correlation between the regional irradiation dose of surrounding non-malignant liver tissue and the reduction in regional SUV of 18F-FDGal after treatment [32]. This finding led to a recent study in patients with liver metastases where it was possible to minimize the radiation dose to areas with the best functioning liver tissue as assessed by 18F-FDGal PET/CT (Figure 6) [33]. Therefore pretreatment 18F-FDGal PET/CT may be used to spare the radiation dose to the surrounding liver tissue in the planning of stereotactic body radiotherapy of liver tumors.
Figure 6.
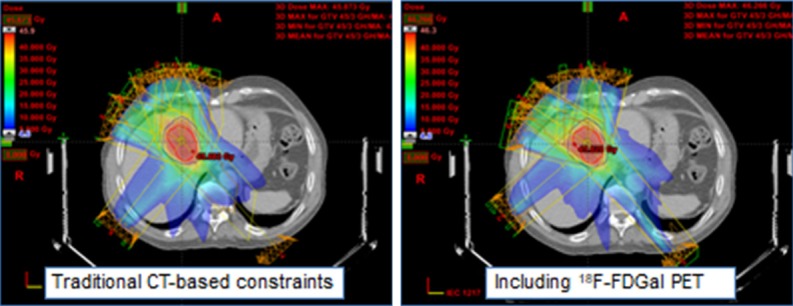
Example of how functional treatment planning using 18F-FDGal PET/CT significantly reduced the radiation dose delivered to regions with the best functioning liver tissue in a patient with colorectal liver metastases.
18F-FDG PET
Hepatic 18F-FDG metabolism is usually analyzed by the K 1-k 4 model shown in Figure 1 or by a K 1-k 3 model using the linear representation of data according to Gjedde-Patlak [2]. However, in the hepatocytes, 18F-FDG-6-phosphate (18F-FDG-6-P) undergoes dephosphorization as well as oxidation to 2-[18F]fluoro-2-deoxy-6-phosphogluconate (18F-FD-6-PG1) [34]. The simple K 1 - k 4 model may still apply to 18F-FDG PET liver studies, but the calculated rate constant for the dephosphorization of 18F-FDG-6-P (k 4) will be somewhat underestimated because a fraction of the metabolites is not 18F-FDG-6-P. The 18F-FDG metabolism is competitively inhibited by glucose and it is not clear how 18F-FDG metabolism quantitatively reflects glucose metabolism [35]. Hence, it is problematic to use 18F-FDG PET to measure this key function of the liver for body metabolic homeostasis.
Studies of hepatic 18F-FDG metabolism may nevertheless be used to show how drugs and hormones may affect hepatic glucose metabolism at the physiological conditions at which it is studied. A recent PET study demonstrated that hepatic 18F-FDG uptake was twice as high in men as in women [36], which may to some extent explain the lower overall glucose disposal observed in women. Compartment modeling of hepatic 18F-FDG metabolism at different concentrations of insulin demonstrated that insulin-resistant individuals have a significantly reduced k 3/k 4 ratio [37]. This kinetics may translate into a rapid dephosphorization or oxidation of glucose and loss of glucose into the circulation. In addition, 18F-FDG PET/CT studies showed that the hepatic 18F-FDG metabolism is inversely related to liver fat content and overall insulin sensitivity [38], which implies that imbalance in intrahepatic phosphorylation/dephosphorization of glucose results in reduced hepatic glucose uptake, adding to overall hyperglycemia in patients with non-alcoholic fatty liver disease. As a final example, the glucose lowering drug exenatide enhanced hepatic 18F-FDG metabolism in patients with non-alcoholic fatty liver disease [39]. Thus, 18F-FDG PET/CT will increasingly be used to determine whether already approved and used antidiabetic drugs have the liver as their primary target organ.
11C-MG PET
3-O-[11C]methylglucose (11C-MG) is taken up from blood by the hepatocytes by the same GLUT-2 transporter as glucose and undergoes backflux to from hepatocytes to blood but it is not metabolized by the hepatocytes [34] (Figure 1). It is therefore a suitable tracer for studies of exchange between blood and hepatocytes as utilized in the abovementioned studies of the microvascular compartment model [12,13].
Hepatobiliary secretion of bile acids
Bile acids play an essential role in the hepatobiliary excretory functions, absorption of lipids from the intestines, and metabolic signaling. Prior to secretion from hepatocytes into bile, bile acids are conjugated (N-acyl amidated) with the amino acids glycine or taurine. Conjugated bile acids undergo enterohepatic circulation 10-15 times daily, with absorption in the terminal ileum into the portal vein. We have developed radiosynthesis methods of various bile acid tracers for PET studies of these processes (Figure 7).
Figure 7.
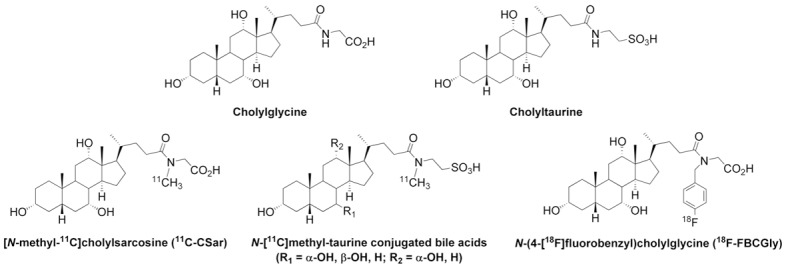
Top: Chemical structures of the endogenous bile acid conjugates cholylglycine and cholyltaurine. Bottom: Chemical structures of 11C-labeled cholylsarcosine, N-methyl-taurine-conjugated bile acids, and 18F-FBCGly.
11C-CSar PET
Frisch et al. developed the radiosynthesis of 11C-CSar (radioactive half-life, 20.4 min) [40] of a conjugate of cholic acid and N-methyl-glycine (sarcosine) that, based on studies of unlabeled cholylsarcosine in animals and humans, has physiochemical and physiological properties similar to endogenous cholylglycine and cholyltaurine, but unlike the endogenous bile acids, cholylsarcosine is not metabolized in vivo [41]. We developed a kinetic model for analysis of the hepatic transport of 11C-CSar from blood to bile in pigs, including flow of 11C-CSar with bile out of the liver (Figure 1) [6]. The model was applied to 11C-CSar PET studies of healthy human participants and patients with liver disease [7], using the PV-model pre-hepatic splanchnic transfer parameter for 11C-CSar determined in pigs [6] for calculation of the PV concentration of 11C-CSar from arterial blood-sample measured concentrations of 11C-CSar. The fit of the kinetic model (Figure 1) to the PET measurements demonstrated that the transport of 11C-CSar from hepatocytes into intrahepatic bile canaliculi (k 3) worked against a concentration gradient of 11C-CSar of about 3,500 in healthy participants and a residence time averaging 2.4 minutes [7]; this finding can be interpreted as the liver parenchyma allows rapid transfer of bile acids from blood to bile, with no significant accumulation in the hepatocytes. In agreement herewith, microvascular modeling of measurements of C dual and hepatic vein concentrations (Table 1) showed high values of the intrinsic hepatic clearance of 11C-CSar of the overall transfer from blood to bile (Cl int; mL blood/min/mL liver tissue) in healthy participants but not in patients with cholestatic liver disease [7]. This finding illustrates that parameters of whole-liver functions can be obtained by microvascular modeling of blood measurements and that quantification of individual intrahepatic transport parameters can be obtained by combined dynamic PET and blood measurements (see Table 1).
PET with N-[11C]methyl-taurine conjugated bile acid tracers
Glycine conjugates dominate in healthy humans, whereas taurine conjugates can dominate in patients with cholestatic liver diseases and in many other species. We have developed the radiosynthesis for the preparation of a range of N-[11C]methyl-taurine conjugated bile acids (Figure 7) [42]. PET/CT studies in pigs showed that the N-[11C]methyl-taurine conjugated tracers were rapidly taken up by the liver and secreted into bile, followed by accumulation in the gallbladder and secretion into the small intestine [42]. We propose that these new bile acid tracers will prove useful for preclinical tests in animals with a naturally high level of taurine-conjugated bile acids and for detailed studies of patients with intrahepatic cholestatic disorders.
PET with 18F-labeled bile acid tracers
The enterohepatic circulation of bile acids is impaired during cholestatic liver diseases and diseases of the terminal ileum. This can lead to compromised absorption of bile acids which in turn can lead to severe diarrhea. The 20.4 min radioactive half-life of 11C-labeled bile acid tracers is too short to enable quantitative studies of the enterohepatic circulation. We therefore developed a radiosynthesis of a novel 18F (radioactive half-life of 109.8 min) labeled derivative of the endogenous bile acid conjugate cholylglycine, N-(4-[18F]fluorobenzyl)-cholylglycine (18F-FBCGly), and we used μPET/MRI of anesthetized rats to show that 18F-FBCGly undergoes enterohepatic circulation with a rapid trans-hepatic transport into bile (Figure 8) [43]. Elevated concentrations of endogenous bile acid conjugates (cholyltaurine), typical for cholestatic liver diseases, markedly delayed trans-hepatic transport and the enterohepatic circulation of 18F-FBCGly. This novel tracer may prove useful for in vivo quantification of the enterohepatic circulation of conjugated bile acids by PET during intrahepatic cholestasis and intestinal bile acid malabsorption. Moreover, as an 18F-tracer with a relatively long half-life, 18F-FBCGly has the advantage of being easily distributed for use in centers without a cyclotron.
Figure 8.
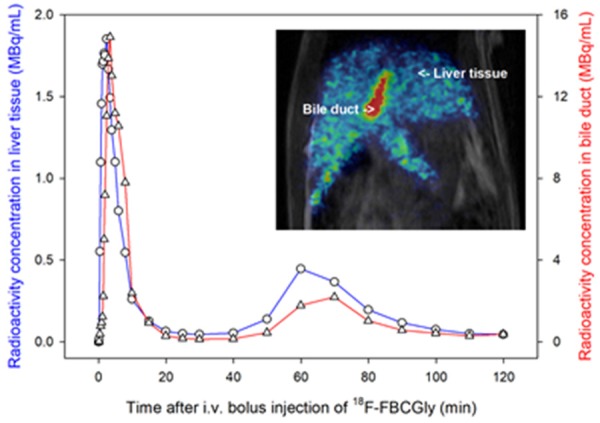
Time courses of radioactivity concentrations of 18F-FBCGly in liver tissue (blue curve) and bile duct (red curve) measured by PET in a rat. Inset is a PET/MR image recorded 2 min after administration of tracer.
Other groups have also reported the development of 18F-labeled tracers derived from bile acids for PET of hepatic transport [44-46] as well as 64Cu-labeled tracer for targeting bile acid receptors [47]. However, none of these tracers have so far been evaluated for PET of the enterohepatic circulation.
Lipid metabolism
11C-palmitate is a labeled natural fatty acid tracer that undergoes intrahepatic esterification, oxidation, secretion of triglyceride into blood, and a rapid recirculation of metabolites in the systemic circulation in humans [48]. A compartment model describing the transfer of 11C-palmitate from blood into hepatocytes and the three metabolic processes (Figure 1) was introduced by Iozzo and co-workers [49] and validated in PET studies of pigs with measurements of 11C-palmitate and metabolites (11C-CO2 and 11C-triglyceride) in arterial, portal and hepatic vein [50]. This approach demonstrated that hepatic lipid oxidation is greater in obese individuals than in lean subjects [51]. Employing 11C-palmitate PET/CT and the same model, we recently tested whether the lipid lowering effect of metformin is caused by increased lipid oxidation as suggested by in vitro and animal studies. However, this effect was not observed, since treatment with metformin for 3 months did not affect the intrahepatic handling of fatty acid in patients with type-2 diabetes or healthy participants [52]. Intriguingly, using 11C-palmitate PET/CT, it was shown that subjects with mutations in a cell membrane fatty acid transporter (CD36) had similar hepatic fatty acid uptake as subjects with the wild-type gene, suggesting that the liver relies on other fatty acid transporters than CD36 [53].
Hepatic fatty acid metabolism assessed by the fatty acid analog 14(R,S)-[18F]fluoro-6-thia-heptadecanoic acid (18F-FTHA) was reduced in patients with impaired insulin glucose tolerance [54], a finding consistent with recent data from our lab [52]. Fatty acid PET/CT therefore shows potential to determine whether the lipid lowering effects of a range of newer anti-diabetic drugs are caused by changes in hepatic fatty acid metabolism or whether these effects are merely by-products of improved glucose homeostasis.
Protein metabolism
Hepatic amino acid metabolism and protein secretion are essential liver functions that may be altered in patients with liver disease, as reflected in reduced plasma protein concentration and waste of muscle tissue in patients with severe cirrhosis. Using dynamic liver PET in pigs with the amino acid 11C-methionine and model analysis by an extended Gjedde-Patlak model, we estimated the values of K met of 11C-methionine and secretion rate of 11C-protein + 11C-metabolites into blood [55]. K met was significantly correlated with the appearance rate of 11C-proteins in plasma and it would be interesting to translate this novel method to human studies for the development of a clinical quantitative test of hepatic protein secretion.
Drugs and the liver
The liver is the main organ responsible for the metabolism of ingested as well as injected drugs. We have already discussed human studies on how metformin affects hepatic 11C-palmitate metabolism and how exenatide affects hepatic 18F-FDG metabolism. Here we discuss three examples of radio-labeled drugs taken up by the liver, as studied by PET:
1) Following the radiosynthesis of 11C-metformin by Sugiyama’s group, the hepatobiliary transport in mice was studied by PET [56] and by PET/MRI [57]. In a recent liver PET study in human subjects, 11C-metformin was similarly avidly taken up by the liver, but in contrast to the mice studies, there was no detectable elimination of 11C-metformin through the bile; instead excretion through the kidneys was observed [58]. These studies contribute to our understanding of the hepatic handling of metformin in vivo and illustrate the importance of species differences for studies of hepatic drug metabolism and drug development.
2) Ribose is a naturally occurring monosaccharide that contributes to the synthesis of DNA, RNA, and energy production via the pentose phosphate pathway. Evdokimov et al. developed a novel ribose-based tracer [18F]-2-deoxy-2-fluororibose (18F-DFR), which is metabolized in the liver by the same enzymes as ribose; 18F-DFR PET was able to distinguish between healthy liver and liver damaged by acetaminophen in mice [59] and has perspectives for direct quantification of a vital liver function when approved for use in humans.
3) In PET studies of anesthetized baboons, 11C-rifampicin and/or its metabolites accumulated in the liver and gallbladder whereas 11C-isoniazid was excreted via the kidneys [60]. To our knowledge, there are no human studies yet, but PET using these tracers may be of interest for studying the mechanisms of hepatotoxicity associated with the standard therapy of tuberculosis with rifampicin and isoniazid.
Finally, we recently reported a case of drug-induced liver injury demonstrated by 11C-CSar PET/CT of a patient under conditions of drug-induced liver injury following treatment with antibiotics for a lung infection and six months after recovery; there was nearly no, or rather slow biliary excretion of 11C-CSar during the phase with liver injury and normalization after recovery (Figure 9); the respective rate constants k 3 were 0.17 min-1 and 0.90 min-1 [61]. These findings show that the patient suffered from reversible impairment of bile acid secretion from the hepatocytes into the intrahepatic bile ducts governed by the Bile Salt Export Pump (BSEP). Thus, 11C-CSar PET/CT shows potential as a useful instrument for diagnosing the cholestatic effects of known drugs as well as drugs under development.
Figure 9.
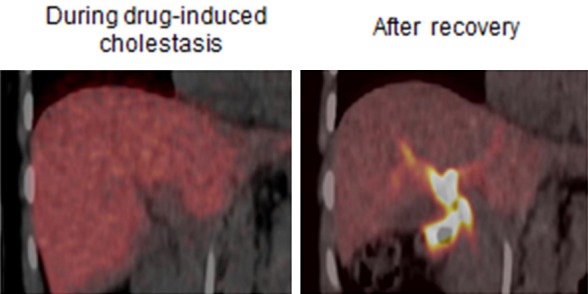
11C-CSar liver PET images of an otherwise healthy patient during drug-induced liver injury (left), and after recovery (right). The images, mean of 11C-concentrations 5-15 minutes after tracer administration, illustrate severely reduced hepatobiliary secretion of 11C-CSar during the cholestatic condition compared to the normal condition after recovery with high 11C-concentration in the intra- and extrahepatic bile ducts.
Conclusions
Functional PET of the liver offers unique possibilities for novel insight into in vivo liver biochemistry, physiology and pathology. The choice of tracer must fit the questions examined and the kinetic model must fit the specific tracer metabolism or hepatobiliary excretion - and include as much physiology/pathophysiology as possible. For estimation of the parameters of the rapid exchange of tracer across the hepatocyte plasma membrane - and transport from hepatocytes into bile of for example bile acid tracers, tracer supply from both the hepatic artery and the portal vein has to be taken into account, typically in terms of the initial flow-weighted dual input concentration after a bolus injection of tracer. Following the initial events, approximate steady-state becomes prevalent and estimation of the steady-state kinetic parameters can typically be estimated by the use of arterial blood concentration only as input function. Today, compartment models assuming spatial and temporal equilibration of tracer concentrations in separate blood and cell compartments are mostly used, but new models are under development that takes into account blood tracer concentration gradients along the liver sinusoids due to uptake from blood into hepatocytes, backflux, reuptake, and possible excretion into bile.
In practice, SUV of non-invasive static PET with 18F-FDGal provides a clinically useful measurement of regional hepatic metabolic function, while the assessment of individual intrahepatic transport steps is a notable feature of the dynamic PET of the liver, as demonstrated here for 11C-CSar and 11C-palmitate, which makes it possible to differentiate between different pathological situations and hence aid in the treatment of patients.
Acknowledgements
The authors would like to thank Prof. Ludvik Bass, Department of Mathematics, University of Queensland St. Lucia, Brisbane, Australia for valuable discussions of this review. The work was supported by The Liver Disease Research Branch of the National Institute of Diabetes and Digestive and Kidney Diseases at the National Institutes of Health (NIH) (R01DK074419).
Disclosure of conflict of interest
None.
References
- 1.Keiding S. Bringing physiology into PET of the liver. J Nucl Med. 2012;53:425–433. doi: 10.2967/jnumed.111.100214. [DOI] [PMC free article] [PubMed] [Google Scholar]
- 2.Munk O, Bass L, Roelsgaard K, Bender D, Hansen S, Keiding S. Liver kinetics of glucose analogs measured in pigs by PET: importance of dual-input blood sampling. J Nucl Med. 2001;42:795–801. [PubMed] [Google Scholar]
- 3.Munk O, Keiding S, Bass L. Impulse-response function of splanchnic circulation with model-independent constraints: theory and experimental validation. Am J Physiol Gastrointest Liver Physiol. 2003;285:G671–G680. doi: 10.1152/ajpgi.00054.2003. [DOI] [PubMed] [Google Scholar]
- 4.Winterdahl M, Keiding S, Sørensen M, Mortensen F, Alstrup A, Munk O. Tracer input for kinetic modelling of liver physiology determined without sampling portal venous blood in pigs. Eur J Nucl Med Mol Imaging. 2011;38:263–270. doi: 10.1007/s00259-010-1620-0. [DOI] [PMC free article] [PubMed] [Google Scholar]
- 5.Sørensen M, Munk O, Mortensen F, Olsen A, Bender D, Bass L, Keiding S. Hepatic uptake and metabolism of galactose can be quantified in vivo by 2-[18F] fluoro-2-deoxy-galactose positron emission tomography. Am J Physiol Gastrointest Liver Physiol. 2008;295:G27–G36. doi: 10.1152/ajpgi.00004.2008. [DOI] [PMC free article] [PubMed] [Google Scholar]
- 6.Sørensen M, Munk O, Ørntoft N, Frisch K, Andersen K, Mortensen F, Alstrup A, Ott P, Hofmann A, Keiding S. Hepatobiliary secretion kinetics of conjugated bile acids measured in pigs by 11C-cholylsarcosine PET. J Nucl Med. 2016;57:961–966. doi: 10.2967/jnumed.115.171579. [DOI] [PubMed] [Google Scholar]
- 7.Ørntoft N, Munk O, Frisch K, Ott P, Keiding S, Sørensen M. Hepatobiliary transport kinetics of the conjugated bile acid tracer 11CCSar quantified in healthy humans and patients by positron emission tomography (PET) J Hepatol. 2017;67:321–327. doi: 10.1016/j.jhep.2017.02.023. [DOI] [PubMed] [Google Scholar]
- 8.Horsager J, Munk O, Sørensen M. Metabolic liver function measured in vivo by dynamic 18F-FDGal PET/CT without arterial blood sampling. EJNMMI Res. 2015;5:32. doi: 10.1186/s13550-015-0110-6. [DOI] [PMC free article] [PubMed] [Google Scholar]
- 9.Munk O, Bass L, Feng H, Keiding S. Determination of regional flow using intravascular PET tracers: microvascular theory and experimental validation for pig livers. J Nucl Med. 2003;44:1862–1870. [PubMed] [Google Scholar]
- 10.Keiding S, Johansen S, Winkler K, Tønnesen K, Tygstrup N. Michaelis Menten kinetics of galactose elimination by the isolated perfused pig liver. Am J Physiol. 1976;230:1302–1313. doi: 10.1152/ajplegacy.1976.230.5.1302. [DOI] [PubMed] [Google Scholar]
- 11.Winterdahl M, Munk O, Sørensen M, Mortensen F, Keiding S. Hepatic blood perfusion measured by 3-min dynamic FDG PET in pigs. J Nucl Med. 2011;52:1119–1124. doi: 10.2967/jnumed.111.088278. [DOI] [PMC free article] [PubMed] [Google Scholar]
- 12.Munk O, Keiding S, Bass L. Capillaries within compartments: Microvascular interpretation of dynamic positron emission tomography data. J Theor Biol. 2003;225:127–141. doi: 10.1016/s0022-5193(03)00227-3. [DOI] [PubMed] [Google Scholar]
- 13.Munk O, Keiding S, Baker C, Bass L. A microvascular compartment model validated using 11C-methylglucose liver PET in pigs. Phys Med Biol. 2018;63:015032. doi: 10.1088/1361-6560/aa9475. [DOI] [PMC free article] [PubMed] [Google Scholar]
- 14.Crone C. The permeability of capillaries in various organs as determined by the use of the ‘indicator diffusion’ method. Acta Physiol Scand. 1963;58:292–305. doi: 10.1111/j.1748-1716.1963.tb02652.x. [DOI] [PubMed] [Google Scholar]
- 15.Bass L, Keiding S, Winkler K, Tygstrup N. Enzymatic elimination of substrates flowing through the intact liver. J theor Biol. 1976;61:393–409. doi: 10.1016/0022-5193(76)90026-6. [DOI] [PubMed] [Google Scholar]
- 16.Ballard F. Kinetic studies with liver galactokinase. Biochem. 1966;101:70–75. doi: 10.1042/bj1010070. [DOI] [PMC free article] [PubMed] [Google Scholar]
- 17.Grün B, Berger U, Oberdorfer F, Hull W, Ostertag H, Friedrich E, Lehmann J, Keppler D. Metabolism and actions of 2-deoxy-2-fluoro-D-galactose in vivo . Eur J Biochem. 1990;190:11–19. doi: 10.1111/j.1432-1033.1990.tb15539.x. [DOI] [PubMed] [Google Scholar]
- 18.Keiding S, Johansen S, Winkler K. Hepatic galactose elimination kinetics in the intact pig liver. Scand J Clin Lab Invest. 1982;42:253–259. [PubMed] [Google Scholar]
- 19.Sørensen M, Mikkelsen K, Frisch K, Villadsen G, Keiding S. Regional metabolic liver function measured by 2-[18F] fluoro-2-deoxy-D-galactose PET/CT in patients with cirrhosis. J Hepatol. 2013;58:1119–1124. doi: 10.1016/j.jhep.2013.01.012. [DOI] [PMC free article] [PubMed] [Google Scholar]
- 20.Tygstrup N. Determination of the hepatic galactose elimination capacity after a single intravenous injection in man. Acta Physiol Scand. 1963;58:162–172. doi: 10.1111/j.1748-1716.1963.tb02638.x. [DOI] [PubMed] [Google Scholar]
- 21.Tygstrup N. Effect of sites of blood sampling in determination of the galactose elimination capacity. Scand J Clin Lab Invest. 1977;37:333–338. doi: 10.3109/00365517709092638. [DOI] [PubMed] [Google Scholar]
- 22.Jepsen P, Vilstrup H, Ott P, Keiding S, Andersen P, Tygstrup N. The galactose elimination capacity and mortality in 781 Danish patients with newly-diagnosed liver cirrhosis: a cohort study. BMJ Gastroenterology. 2009;9:50–56. doi: 10.1186/1471-230X-9-50. [DOI] [PMC free article] [PubMed] [Google Scholar]
- 23.Schmidt L, Ott P, Tygstrup N. Galactose elimination capacity as a prognostic marker in patients with severe acetaminophen-induced hepatotoxicity: 10 years’ experience. Clin Gastroenterol Hepatol. 2004;2:418–424. doi: 10.1016/s1542-3565(04)00128-4. [DOI] [PubMed] [Google Scholar]
- 24.Redaelli C, Dufour J, Wagner M, Schilling M, Hüsler J, Krähenbühl L, Büchler M, Reichen J. Preoperative galactose elimination capacity predicts complications and survival after hepatic resection. Ann Surg. 2002;235:77–85. doi: 10.1097/00000658-200201000-00010. [DOI] [PMC free article] [PubMed] [Google Scholar]
- 25.Merkel C, Marchesini G, Fabbri A, Bianco S, Bianchi G, Enzo E, Sacerdoti D, Zoli M, Gatta A. The course of galactose elimination capacity in patients with alcoholic cirrhosis: possible use as a surrogate marker for death. Hepatology. 1996;24:820–823. doi: 10.1053/jhep.1996.v24.pm0008855183. [DOI] [PubMed] [Google Scholar]
- 26.Ranek L, Andreasen P, Tygstrup N. Galactose elimination capacity as a prognostic index in patients with fulminant liver failure. Gut. 1976;17:959–964. doi: 10.1136/gut.17.12.959. [DOI] [PMC free article] [PubMed] [Google Scholar]
- 27.Frisch K, Bender D, Hansen S, Keiding S, Sørensen M. Nucleophilic radiosynthesis of 2-[18F] fluoro-2-deoxy-D-galactose from Talose triflate and biodistribution in a porcine model. Nuc Med Biol. 2011;38:477–483. doi: 10.1016/j.nucmedbio.2010.11.006. [DOI] [PMC free article] [PubMed] [Google Scholar]
- 28.Sørensen M, Mikkelsen K, Frisch K, Bass L, Bibby B, Keiding S. Hepatic galactose metabolism quantified in humans using 2-[18F] fluoro-2-deoxy-D-galactose PET/CT. J Nucl Med. 2011;52:1566–1572. doi: 10.2967/jnumed.111.092924. [DOI] [PMC free article] [PubMed] [Google Scholar]
- 29.Keiding S. Galactose clearance and liver blood flow. Gastroenterology. 1988;94:477–481. doi: 10.1016/0016-5085(88)90440-4. [DOI] [PubMed] [Google Scholar]
- 30.Winkler K, Bass L, Keiding S, Tygstrup N. The physiologic basis of clearance measurements in hepatology. Scand J Gastroenterol. 1979;14:439–448. [PubMed] [Google Scholar]
- 31.Bak-Fredslund K, Eriksen P, Munk O, Villadsen G, Keiding S, Sørensen M. Metabolic liver function in humans measured by 2-[18F] fluoro-2-deoxy-D-galactose PET/CT-reproducibility and clinical potential. EJNMMI Res. 2017;7:71. doi: 10.1186/s13550-017-0320-1. [DOI] [PMC free article] [PubMed] [Google Scholar]
- 32.Fode M, Petersen J, Sørensen M, Holt M, Keiding S, Høyer M. 2-18F-fluoro-2-deoxy-D-galactose positron emission tomography guided functional treatment planning of stereotactic body radiotherapy of liver tumors. Phys Imaging Radiat Oncol. 2017;1:28–33. [Google Scholar]
- 33.Fode M, Bak-Fredslund K, Petersen J, Worm E, Sørensen M, Høyer M. A phase I study on stereotactic body radiotherapy of liver metastases based on functional treatment planning using positron emission tomography with 2-[18F] fluoro-2-deoxy-D-galactose. Acta Oncol. 2017;56:1614–1620. doi: 10.1080/0284186X.2017.1366051. [DOI] [PubMed] [Google Scholar]
- 34.Bender D, Munk O, Feng H, Keiding S. Metabolites of 18F-FDG and 3-O-11C-methylglucose in pig liver. J Nucl Med. 2001;42:1673–1678. [PubMed] [Google Scholar]
- 35.Trägårdh M, Møller N, Sørensen M. Methodologic considerations for quantitative 18F-FDG PET/CT studies of hepatic glucose metabolism in healthy subjects. J Nucl Med. 2015;56:1366–1371. doi: 10.2967/jnumed.115.154211. [DOI] [PubMed] [Google Scholar]
- 36.Keramida G, Peters A. Fasting hepatic glucose uptake is higher in men than women. Physiol Rep. 2017:5. doi: 10.14814/phy2.13174. [DOI] [PMC free article] [PubMed] [Google Scholar]
- 37.Iozzo P, Geisler F, Oikonen V, Mäki M, Takala T, Solin O, Ferrannini E, Knuuti J, Nuutila P. Insulin stimulates liver glucose uptake in humans: an 18F-FDG PET study. J Nucl Med. 2003;44:682–689. [PubMed] [Google Scholar]
- 38.Borra R, Lautamäki R, Parkkola R, Komu M, Sijens P, Hällsten K, Bergman J, Iozzo P, Nuutila P. Inverse association between liver fat content and hepatic glucose uptake in patients with type 2 diabetes mellitus. Metabolism. 2008;57:1445–1451. doi: 10.1016/j.metabol.2008.05.015. [DOI] [PubMed] [Google Scholar]
- 39.Gastaldelli A, Gaggini M, Daniele G, Ciociaro D, Cersosimo E, Tripathy D, Triplitt C, Fox P, Musi N, DeFronzo R, Iozzo P. Exenatide improves both hepatic and adipose tissue insulin resistance: a dynamic positron emission tomography study. Hepatology. 2016;64:2028–2037. doi: 10.1002/hep.28827. [DOI] [PubMed] [Google Scholar]
- 40.Frisch K, Jakobsen S, Sørensen M, Munk O, Alstrup A, Ott P, Hofmann A, Keiding S. [N-methyl-11C] cholylsarcosine, a novel bile acid tracer for PET/CT of hepatic excretory function: radiosynthesis and proof-of-concept studies in pigs. J Nucl Med. 2012;53:772–778. doi: 10.2967/jnumed.111.098731. [DOI] [PMC free article] [PubMed] [Google Scholar]
- 41.Schmassmann A, Angellotti M, Ton-Nu H, Schteingart C, Marcus S, Rossi S, Hofmann A. Transport, metabolism, and effect of chronic feeding of cholylsarcosine, a conjugated bile acid resistant to deconjugation and dehydroxylation. Gastroenterology. 1990;98:163–174. doi: 10.1016/0016-5085(90)91306-q. [DOI] [PubMed] [Google Scholar]
- 42.Schacht A, Sørensen M, Munk O, Frisch K. Radiosynthesis of N-11C-methyl-taurine-conjugated bile acids and biodistribution studies in pigs by PET/CT. J Nucl Med. 2016;57:628–633. doi: 10.2967/jnumed.115.161711. [DOI] [PubMed] [Google Scholar]
- 43.Frisch K, Stimson DHR, Venkatachalam T, Pierens GK, Keiding S, Reutens D, Bhalla R. N-(4-[18F] fluorobenzyl)cholylglycine, a novel tracer for PET of enterohepatic circulation of bile acids: radiosynthesis and proof-of-concept studies in rats. Nucl Med Biol. 2018 doi: 10.1016/j.nucmedbio.2018.04.004. 27th April (In press) [DOI] [PubMed] [Google Scholar]
- 44.Jia L, Jiang D, Hu P, Li X, Shi H, Cheng D, Zhang L. Synthesis and evaluation of 18F-labeled bile acid compound: a potential PET imaging agent for FXR-related diseases. Nucl Med Biol. 2014;41:495–500. doi: 10.1016/j.nucmedbio.2014.03.016. [DOI] [PubMed] [Google Scholar]
- 45.Testa A, Dall’Angelo S, Mingarelli M, Augello A, Schweiger L, Welch W, Elmore C, Sharma P, Zanda M. Design, synthesis, in vitro characterization and preliminary imaging studies on fluorinated bile acid derivatives as PET tracers to study hepatic transporters. Bioorg Med Chem. 2017;25:963–976. doi: 10.1016/j.bmc.2016.12.008. [DOI] [PubMed] [Google Scholar]
- 46.Lombaerde SD, Neyt S, Kersemans K, Verhoeven J, Devisscher L, Vlierberghe HV, Vanhove C, Vos FD. Synthesis, in vitro and in vivo evaluation of 3β-[18F] fluorocholic acid for the detection of drug-induced cholestasis in mice. PLoS One. 2017;12:e0173529. doi: 10.1371/journal.pone.0173529. [DOI] [PMC free article] [PubMed] [Google Scholar]
- 47.Chong H, Chen Y, Kang C, Sun X, Wu N. Novel 64Cu-radiolabeled bile acid conjugates for targeted PET imaging. Bioorg Med Chem Lett. 2015;25:1082–1085. doi: 10.1016/j.bmcl.2015.01.008. [DOI] [PMC free article] [PubMed] [Google Scholar]
- 48.Christensen NL, Jakobsen S, Schacht AC, Munk OL, Alstrup AKO, Tolbod LP, Harms HJ, Nielsen S, Gormsen LC. Whole-body biodistribution, dosimetry, and metabolite correction of [11C] palmitate: a PET tracer for imaging of fatty acid metabolism. Mol Imaging. 2017;16:1536012117734485. doi: 10.1177/1536012117734485. [DOI] [PMC free article] [PubMed] [Google Scholar]
- 49.Iozzo P, Bucci M, Roivainen M, Någren K, Järvisalo M, Kiss J, Guiducci L, Fielding B, Naum A, Borra R, Virtanen K, Savunen T, Salvadori P, Ferrannini E, Knuuti J, Nuutila P. Fatty acid metabolism in the liver, measured by positron emission tomography, is increased in obese individuals. Gastroenterology. 2010;139:846–856. doi: 10.1053/j.gastro.2010.05.039. [DOI] [PubMed] [Google Scholar]
- 50.Guiducci L, Järvisalo M, Kiss J, Någren K, Viljanen A, Naum A, Gastaldelli A, Savunen T, Knuuti J, Salvadori P, Ferrannini E, Nuutila P, Iozzo P. [11C] palmitate kinetics across the splanchnic bed in arterial, portal and hepatic venous plasma during fasting and euglycemic hyperinsulinemia. Nucl Med Biol. 2006;33:521–528. doi: 10.1016/j.nucmedbio.2006.02.003. [DOI] [PubMed] [Google Scholar]
- 51.Hames K, Vella A, Kemp B, Jensen M. Free fatty acid uptake in humans with CD36 deficiency. Diabetes. 2014;63:3606–3614. doi: 10.2337/db14-0369. [DOI] [PMC free article] [PubMed] [Google Scholar]
- 52.Gormsen L, Søndergaard E, Christensen N, Jakobsen S, Nielsen E, Munk O, Tolbod L, Jessen N, Nielsen S. Metformin does not affect postabsorptive hepatic free fatty acid uptake, oxidation or resecretion in humans: a 3-month placebo-controlled clinical trial in patients with type 2 diabetes and healthy controls. Diabetes Obes Metab. 2018 doi: 10.1111/dom.13244. [Epub ahead of print] [DOI] [PubMed] [Google Scholar]
- 53.Iozzo P, Turpeinen A, Takala T, Oikonen V, Bergman J, Grönroos T, Ferrannini E, Nuutila P, Knuuti J. Defective liver disposal of free fatty acids in patients with impaired glucose tolerance. J Clin Endocrinol Metab. 2004;89:3496–3502. doi: 10.1210/jc.2003-031142. [DOI] [PubMed] [Google Scholar]
- 54.DeGrado T, Wang S, Holden J, Nickles R, Taylor M, Stone C. Synthesis and preliminary evaluation of 18F-labeled 4-thia palmitate as a PET tracer of myocardial fatty acid oxidation. Nuc Med Biol. 2000;27:221–231. doi: 10.1016/s0969-8051(99)00101-8. [DOI] [PubMed] [Google Scholar]
- 55.Horsager J, Lausten S, Bender D, Munk O, Keiding S. Hepatic metabolism of 11C-methionine and secretion of 11C-protein measured by PET in pigs. Am J Nucl Med Mol Imaging. 2017;7:167–173. [PMC free article] [PubMed] [Google Scholar]
- 56.Hume W, Shingaki T, Takashima T, Hashizume Y, Okauchi T, Katayama Y, Hayashinaka E, Wada Y, Kusuhara H, Sugiyama Y, Watanabe Y. The synthesis and biodistribution of [11C] metformin as a PET probe to study hepatobiliary transport mediated by the multi-drug and toxin extrusion transporter 1 (MATE1) in vivo. Bioorg Med Chem. 2013;21:7584–7590. doi: 10.1016/j.bmc.2013.10.041. [DOI] [PubMed] [Google Scholar]
- 57.Jensen J, Sundelin E, Jakobsen S, Gormsen L, Munk O, Frøkiær J, Jessen N. [11C] -labeled metformin distribution in the liver and small intestine using dynamic positron emission tomography in mice demonstrates tissue-specific transporter dependency. Diabetes. 2016;65:1724–1730. doi: 10.2337/db16-0032. [DOI] [PubMed] [Google Scholar]
- 58.Gormsen L, Sundelin E, Jensen J, Vendelbo M, Jakobsen S, Munk O, Christensen MH, Brøsen K, Frøkiær J, Jessen N. In vivo imaging of human 11C-metformin in peripheral organs: dosimetry, biodistribution, and kinetic analyses. J Nucl Med. 2016;57:1920–1926. doi: 10.2967/jnumed.116.177774. [DOI] [PubMed] [Google Scholar]
- 59.Evdokimov N, Clark P, Flores G, Chai T, Faull K, Phelps M, Witte O, Jung M. Development of 2-deoxy-2-[18F] fluororibose for positron emission tomography imaging liver function in vivo . J Med Chem. 2015;58:5538–5547. doi: 10.1021/acs.jmedchem.5b00569. [DOI] [PubMed] [Google Scholar]
- 60.Liu L, Xu Y, Shea C, Fowler J, Hooker J, Tonge P. Radiosynthesis and bioimaging of the tuberculosis chemotherapeutics isoniazid, rifampicin and pyrazinamide in baboons. J Med Chem. 2010;53:2882–2891. doi: 10.1021/jm901858n. [DOI] [PMC free article] [PubMed] [Google Scholar]
- 61.Ørntoft N, Frisch K, Ott P, Keiding S, Sørensen M. Functional assessment of hepatobiliary secretion by 11C-cholylsarcosine positron emission tomography. Biochim Biophys Acta. 2018;1864:1240–1244. doi: 10.1016/j.bbadis.2017.11.016. [DOI] [PubMed] [Google Scholar]


