Abstract
Amyloid beta (Aβ) plaques are not specific to Alzheimer’s disease and occur with aging and neurodegenerative disorders. Soluble brain Aβ may be neuroprotective and increases in response to neuroinflammation. Sepsis is associated with neurocognitive compromise. The objective was to determine, in a rat endotoxemia model of sepsis, whether neuroinflammation and soluble Aβ production are associated with Aβ plaque and hyperphosphorylated tau deposition in the brain. Male Sprague Dawley rats received a single intraperitoneal injection of 10 mg/kg of lipopolysaccharide endotoxin (LPS). Brain and blood levels of IL-1β, IL-6, and TNFα and cortical microglial density were measured in LPS-injected and control animals. Soluble brain Aβ and p-tau were compared and Aβ plaques were quantified and characterized. Brain uptake of [18F]flutemetamol was measured by phosphor imaging. LPS endotoxemia resulted in elevations of cytokines in blood and brain. Microglial density was increased in LPS-treated rats relative to controls. LPS resulted in increased soluble Aβ and in p-tau levels in whole brain. Progressive increases in morphologically-diffuse Aβ plaques occurred throughout the interval of observation (to 7-9 days post LPS). LPS endotoxemia resulted in increased [18F]flutemetamol in the cortex and increased cortex: white matter ratios of activity. In conclusion, LPS endotoxemia causes neuroinflammation, increased soluble Aβ and Aβ diffuse plaques in the brain. Aβ PET tracers may inform this neuropathology. Increased p-tau in the brain of LPS treated animals suggests that downstream consequences of Aβ plaque formation may occur. Further mechanistic and neurocognitive studies to understand the causes and consequences of LPS-induced neuropathology are warranted.
Keywords: Lipopolysaccharide, LPS, sepsis, neuroinflammation, amyloid beta, phosphorylated tau, brain
Introduction
The classical amyloid cascade hypothesis of Alzheimer’s disease (AD) states that aggregation of soluble amyloid beta (Aβ) monomers into fibrillar plaques sequentially leads to hyperphosphorylated tau protein filaments, neurofibrillary tangles, gliosis, neuronal loss, and ultimately dementia [1]. Fibrillar Aβ-avid positron emission tomography (PET) imaging may allow early diagnosis of AD in individuals in the appropriate clinical context [2-6]. However, Aβ plaque formation is not specific to AD, and can be seen in the setting of aging and other neurodegenerative disorders, such Parkinson’s disease and traumatic brain injury [7-9]. Up to a third of cognitively normal patients, particularly the elderly, may also demonstrate increased Aβ neuritic plaques on PET [10,11]. Although the clinical significance of Aβ plaque formation in cognitively normal subjects is not well understood, numerous studies have supported that increased fibrillar Aβ when identified on PET is a risk factor for future cognitive decline [12-16].
Acute or chronic systemic inflammatory conditions could be a mechanism by which Aβ plaques progressively accumulate in the brain and result, or be associated with, neurocognitive difficulties. Many neurodegenerative disorders have an inflammatory component [17]. The link between systemic inflammatory conditions and brain health is also well supported [18]. Sepsis, a severe systemic inflammatory condition, results in both short and long term neurocognitive dysfunction [19-21]. Acutely, sepsis is associated with endothelial activation, blood brain barrier disruption, cerebral edema, expression of inflammatory mediators, and culminates in acute mitochondrial dysfunction and oxidative damage [19,22,23]. E. Coli endotoxin lipopolysaccharide endotoxin (LPS), an important mediator of gram-negative sepsis, may increase soluble Aβ levels in the brain in an acute phase response to oxidative injury [24,25]. Soluble Aβ monomeric species may protective against oxidative damage by inducing mitochondrial dysfunction [26-30]. However, the critical link between acute inflammatory events, soluble Aβ production, Aβ plaque formation and long-term cognitive dysfunction has not been made. The objective of this study was to assess, in a rat sepsis model, the association between experimental LPS-induced acute systemic inflammation, secondary neuroinflammation, increased soluble Aβ production, and Aβ plaque and phosphorylated tau (p-tau) deposition in the brain. Rats have been previously studied in sepsis models of neuroinflammation [25]. Systemically administered LPS is an accepted animal model of sepsis, and avoids the progressive morbidity of other sepsis models, such as cecal ligation and puncture [31].
Materials and methods
Overall study design
Male Sprague Dawley rats received a single intraperitoneal injection of 10 mg/kg of lipopolysaccharide endotoxin (LPS). Plasma and brain levels of IL-1β, IL-6, and TNFα in LPS-injected and control animals were compared by ELISA at intervals from 2 h to 7-9 d post LPS. Microglial density was established by Iba-1 immunostaining in the cerebral cortex 24 h following LPS administration. Soluble brain Aβ monomer levels were measured by immunoblotting at 24 h, 3 d and 7-9 d post LPS and p-tau was measured by immunoblotting at 24 h in whole brain homogenates. Aβ plaques in the cerebral cortex were quantified following immunostaining for multiple known plaque components and morphologically characterized by confocal microscopy. Following intravenous administration of [18F]flutametamol, radioactivity in the cortex and corpus callosum was measured by phosphor imaging digital autoradiography.
Study site and assurances
Animal experiments were performed with the approval of and compliance with the policies of the University of Utah Institutional Animal Care and Use Committee, which adhere to the National Institutes of Health Guide for the Care and Use of Laboratory Animals. All efforts were made to minimize suffering.
Animal husbandry
Two-month-old (250 g) male Sprague Dawley rats were purchased from Harlan Laboratories (Denver, CO). Rats were housed 2 per cage in HEPA-filtered clear plastic Theron #8 expanded rat cages (Theron Caging Systems, Inc, Hazelton, PA) with Paperchip bedding (Shepard Specialty Papers, Watertown, TN) under pathogen free conditions within a room operating on a 12 hour light/dark cycle (light onset at 7:00 am). Water and food were freely available. Animal welfare and body weight were assessed daily.
Inflammatory stimulus
Rats received a single intraperitoneal injection of 10 mg/kg of LPS (Sigma Aldrich, St. Louis, MO). Control animals received no injection. Rats were euthanized at intervals from 2 h to 7-9 d post LPS administration. A minimum of 5 rats were utilized per cohort (4 for microglial assessments). Additional rats were utilized for some cohorts to provide sufficient tissue for analytical comparisons.
Tissue preparation
Whole blood samples were removed from euthanized rats, placed in heparinized tubes and centrifuged at 2000 rpm for 10 minutes. The supernatant plasma was removed and stored at -80°C until assayed.
The brains were immediately removed from euthanized animals and divided along the mid sagittal plane. One hemisphere was flash frozen in isobutene, embedded at -23°C and stored at -80°C. Cryomicrotome sections were obtained at 20 mm thickness for plaque immunostaining, mounted on glass slides, air-dried and stored at -80°C. The other hemisphere was placed in 5 volumes (w:v) of RIPA extraction buffer including proteinase inhibitor (ThermoFisher Scientific, Rockford, IL), homogenized on ice for 30 s, sonicated for 10 s, incubated on ice for 4 h, and then centrifuged at 14,000 rpm for 20 min. Aliquots of supernatant were frozen at -80°C until assayed. For phosphor imaging, cryomicrotome brain sections were mounted on slides and used immediately.
Cytokine assays
Protein assays on plasma and brain homogenates were performed by Pierce BCA Protein Assay Kit (ThermoFisher Scientific, Rockford, IL). ELISA assays of peripheral blood plasma and of brain homogenates for IL-1β, TNFα, and IL-6 were performed according to kit protocols (NEOGEN Corporation, Lexington, KY). The microplates were read at 450 nm. The standard curves and data were calculated using GraphPad Prism software (La Jolla, CA).
Immunohistochemistry for microglial density
Microglial density was determined in cortical regions of the brains from control rats and those at 24 h post LPS administration. Cryomicrotome sections were fixed with 4% paraformaldehyde and immunostained with a rabbit polyclonal antibody to ionized calcium binding adapter molecule 1 (Iba1, Wako Chemicals USA, Inc.) diluted to 1:400 in blocking buffer. Fluorescent secondary antibody (Alexa Fluor 488) staining was imaged with a laser scanning confocal microscope (Olympus FV1000). Controls omitting primary antibody showed no fluorescence. The mean number of microglia in 10 separate 20X fields was measured per animal.
Soluble Aβ 1-42 and phosphorylated tau
Soluble monomeric Aβ 1-42 peptide and phosphorylated tau (p-tau) protein levels were measured in whole brain homogenates by immunoblot (western blot) analysis. Soluble Aβ was measured at 24 h, 3 d and 7-9 d post LPS. Phosphorylated tau was measured at 24 h post LPS. For Aβ mouse monoclonal Aβ (1-42) specific antibody (AnaSpec, Inc., Fremont, CA) was used. For p-tau, Thr181 rabbit polyclonal antibody was used (Santa Cruz Biotechnology Inc, CA). Western blots were performed using Amersham ECL Plus Western Blotting Detection Reagents and corresponding protocol (GE Healthcare Life Sciences, Pittsburgh, PA). Intensity of the specific bands were measured using a Fujifilm LAS-3000 image analysis system (Fujifilm Medical Systems, Stamford, CT) relative to control brain in young rats using Multi Gauge software, in reference to authentic Aβ (1-42) monomer (16.5 kD) and normalized to β-actin.
Aβ plaque identification and characterization
At 24 h, 3 d and 7-9 d post LPS, Aβ plaques were quantified by immunostaining of formic acid treated mid-sagittal 20 mm cryomicrotome cortical brain sections according to a published protocol [32]. The average number of plaques in the parietal cortex was recorded in each rat from three 10× microscopic fields in each of 3 adjacent brain slices. Further characterization of Aβ plaques was performed by confocal microscopy in 4 rats 24 h post LPS administration. Cryomicrotome sections were blocked with goat serum. For Aβ (1-42), mouse monoclonal antibody against rat Aβ (1-42) specific antibody (AnaSpec Inc, Fremont, CA) was labeled with Alexa fluor 488 (green) anti-mouse IgG labeling kit reagent (Invitrogen, Eugene, CA) according to kit instructions. Diffuse Aβ plaques are also known to contain microglia as well as other proteins, such as cytokines, Apolipoprotein E (ApoE) and complement components [33-36]. In addition to Aβ, co-immunostaining was also performed with combinations of 2 of following 4 additional targets to facilitate 3-color confocal microscopic imaging of the same slides: microglia (Iba-1), cytokine IL-1β, Apo-E and complement C-3. The primary antibodies were mouse monoclonal antibody against rat Iba-1 (Abcam, Inc, Cambridge, MA), rabbit polyclonal antibody against human and rat IL-1β (Abcam, Inc, Cambridge, MA), mouse monoclonal antibody directed against the amino acid 31-353 internal region of ApoE of conserved human origin (Santa Cruz, Inc, Fremont, CA), and mouse monoclonal antibody against human and rat C3 (Thermo Scientific, Pittsburgh, PA). These were labeled with Alexa Flour secondary antibodies (Invitrogen, Eugene, CA) with complementary wavelengths according to kit instructions. Brain sections were incubated with the antibodies at a 1:100 dilution at room temperature for 1 h. The images were taken using a confocal laser-scanning microscope (Olympus FV1000).
Autoradiography of systemically administered [18F]flutemetamol
[18F]flutemetamol was produced using an automated synthesis procedure. The isolation, synthesis, purification and formulation of [18F]flutemetamol was performed on the GE Healthcare FASTlab synthesis module (GE Healthcare AS, Oslo, Norway) using disposable sterile cassette kits (GE Healthcare, Chicago IL). Three days after LPS injection, the rats were injected with 1.5 mCi (55.5 MBq) [18F]flutemetamol by tail vein. Sixty minutes later, animals were euthanized, brains removed and 20 mm cryomicrotome sections were mounted on slides (as above). The 18F activity in the cortex and corpus callosum in 3 regions within 3 adjacent brains slices per rat was normalized to exact total activity:body weight. Activity in specific brain regions was quantified by phosphor imaging using a Fujifilm BAS-5000 image analysis system and protocol (Fujifilm Medical Systems, Stamford, CT), and plotted against standard curves generated by scanned samples of known dilutions of 18F.
Statistical analysis
Differences in mean values between cohorts of animals were compared by one-way ANOVA (Mann-Whitney for microglial density) with type I error protection by Dunnett (against control) or Bonferroni or tests. Comparisons between numbers of Aβ plaques in LPS treated rats and controls (all values being zero) was made by one-sample T-tests. A statistically significant difference was defined as p < 0.05.
Results
Adverse events
Rats exhibited some decrease in overall activity following LPS administration. All had returned to normal activity by 48 h post LPS injection. Animals maintained food and water intake following LPS, were weighed daily and demonstrated no weight loss following LPS. No animals died as a result of the LPS administration.
Endotoxemia resulted in systemic inflammation and secondary neuroinflammation
A single high dose of intraperitoneal LPS resulted in a systemic inflammatory response as well as secondary neuroinflammation with inflammatory cytokines in the blood and brain (Table 1). Although LPS was given as a single IP injection, evidence of cerebral and systemic inflammation persisted throughout the interval of observation (to 7-9 d post LPS). LPS resulted in an increase in IL-1β levels in the plasma and brain (Figure 1). Plasma IL-1β levels peaked at 2.1 times greater than control levels at 4 h post LPS. Thereafter increased levels of plasma IL-1β decreased only slightly, remaining statistically significant at 1.8 times greater than control levels at 7-9 d. There was a more striking increase in IL-1β levels in the brain following LPS, peaking at 7.9 times control levels at 24 h and thereafter decreasing rapidly but remaining approximately 2 times greater than control levels to 7-9 d post LPS (statistically significant). Plasma and brain levels of IL-6 were also elevated following IP administration of LPS (Figure 2). Plasma levels of IL-6 transiently peaked at 5 times control levels at 2-4 h post LPS (statistically significant) and thereafter dropped to control levels by 24 h. The magnitude of increase in IL-6 in the brains of LPS animals was 2 times greater than control levels, peaking at 24 h but continuing through 7-9 d post LPS. LPS endotoxemia also resulted in increased plasma and brain levels of TNFα (Figure 3). Plasma TNFα peaked transiently at 2.5 times control levels, statistically significant only at 4 h post LPS. TNFα levels in the brain showed a slight but statistically significant increase over control levels for rats only at 24 h post LPS injection, statistically significant at 1.6 times control levels. Overall, plasma levels of cytokines tended to peak early after LPS administration, at 2-4 h and brain levels peaked later, at 24 h post LPS.
Table 1.
Cytokine levels, as determined by ELISA, in the brain and plasma of control rats and those at intervals following a single intraperitoneal injection of 10 mg/kg LPS
| IL-1β | |||||
|
| |||||
| Interval from LPS injection | N | Brain mean pg/mg (SE) | Brain p = LPS vs. control | Plasma mean pg/ml (SE) | Plasma p = LPS vs. control |
|
| |||||
| Control | 13 | 11.43 (0.85) | 621.10 (117.74) | ||
| 2 h | 5 | 14.19 (0.76) | < 0.02 | 651.87 (175.68) | NS |
| 4 h | 5 | 17.97 (0.72) | < 0.01 | 1283.74 (109.07) | < 0.05 |
| 24 h | 8 | 89.90 (10.79) | < 0.0001 | 1245 (211.90) | < 0.05 |
| 3 d | 8 | 23.36 (3.79) | < 0.01 | 1058.42 (96.61) | < 0.05 |
| 7-9 d | 8 | 22.84 (2.51) | < 0.001 | 1142.00 (182.69) | < 0.05 |
|
| |||||
| IL-6 | |||||
|
| |||||
| Interval from LPS injection | N | Brain mean pg/mg (SE) | Brain p = LPS vs. control | Plasma mean pg/ml (SE) | Plasma p = LPS vs. control |
|
| |||||
| Control | 13 | 11.41 (1.06) | 780.05 (119.69) | ||
| 2 h | 5 | 8.79 (0.93) | NS | 3805.66 (531.03) | < 0.0001 |
| 4 h | 5 | 9.40 (0.29) | NS | 3903.92 (507.27) | < 0.0001 |
| 24 h | 8 | 22.47 (0.79) | < 0.0001 | 652.83 (17.24) | NS |
| 3 d | 8 | 16.01 (1.05) | < 0.01 | 634.12 (26.67) | NS |
| 7-9 d | 8 | 18.67 (1.09) | < 0.001 | 655.27 (17.31) | NS |
|
| |||||
| TNFα | |||||
|
| |||||
| Interval from LPS injection | N | Brain mean pg/mg (SE) | Brain p = LPS vs. control | Plasma mean pg/ml (SE) | Plasma p = LPS vs. control |
|
| |||||
| Control | 13 | 13.19 (0.86) | 224.63 (16.70) | ||
| 2 h | 5 | 12.18 (0.82) | NS | 168.67 (20.59) | NS |
| 4 h | 5 | 12.65 (0.66) | NS | 571.91 (97.28) | < 0.0001 |
| 24 h | 8 | 18.87 (1.81) | < 0.01 | 281.14 (31.97) | NS |
| 3 d | 8 | 14.61 (1.86) | NS | 235.57 (17.04) | NS |
| 7-9 d | 8 | 13.52 (1.60) | NS | 218.67 (19.43) | NS |
SE = standard error of the mean.
Figure 1.
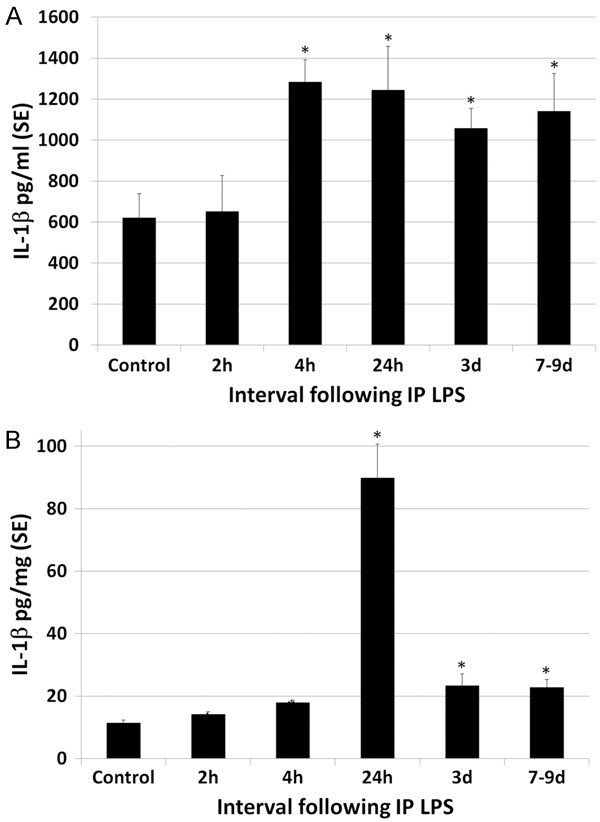
Effect of LPS on plasma and brain levels of IL-1β. A. LPS resulted in an increase in plasma IL-1β levels, which peaked at 2.1 times greater than control levels at 4 h post LPS. Thereafter increased levels of plasma IL-1β decreased only slightly, remaining at 1.8 times greater than control levels at 7-9 d. B. There was more striking increase in IL-1β levels in the brain following LPS, peaking at 7.9 times control levels at 24 h and thereafter decreasing rapidly but remaining approximately 2 times greater than control levels to 7-9 d post LPS. Statistically significant differences noted: mean vs. control (*).
Figure 2.
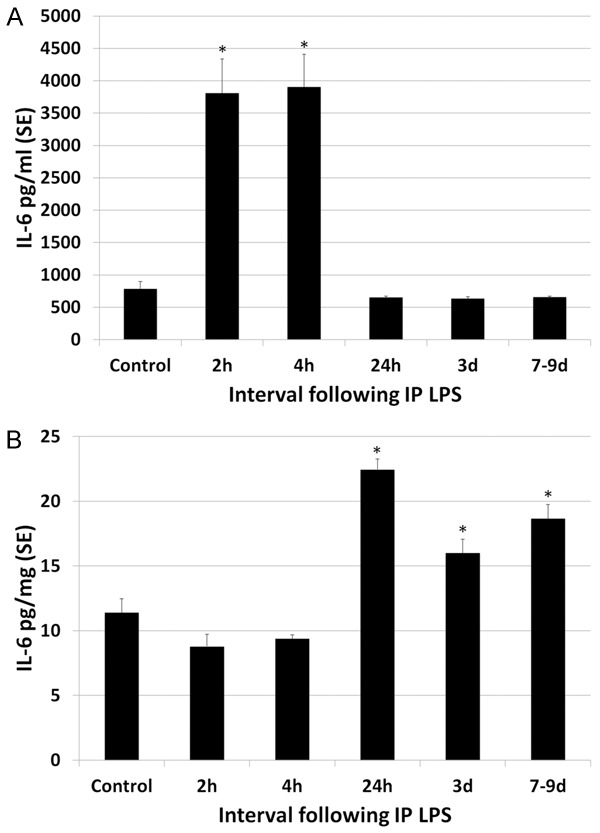
Effect of LPS on plasma and brain levels of IL-6. A. Plasma levels of IL-6 transiently peaked at 5 times control levels at 2-4 h post LPS and thereafter dropped to control levels by 24 h. B. The magnitude of increase in IL-6 in the brains of LPS animals was 2 times greater than control levels, peaking at 24 h but continuing through 7-9 d post LPS. Statistically significant differences noted: (*).
Figure 3.
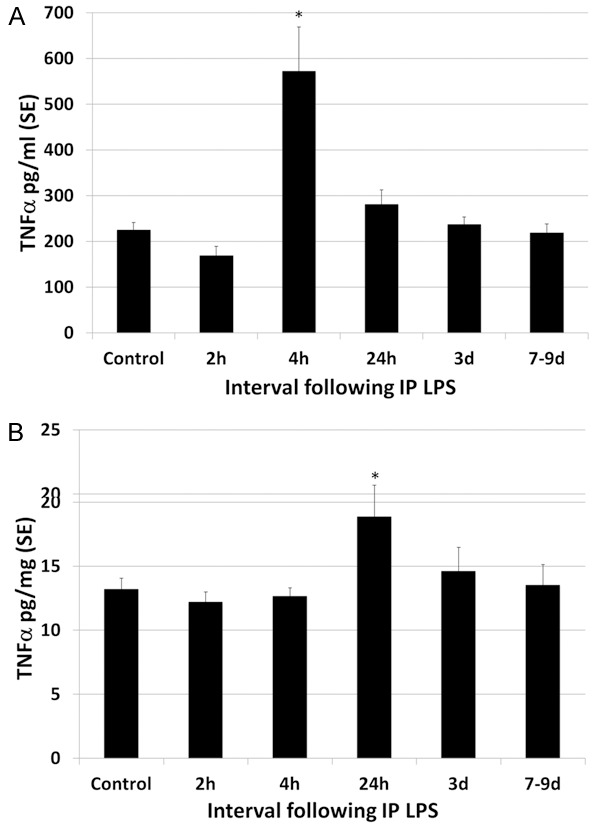
Effect of LPS on plasma and brain levels of TNFα. A. Plasma levels of TNFα peaked transiently at 2.5 times control levels, statistically significant only at 4 h post LPS. B. TNFα levels in the brain showed a slight but statistically significant increase over control levels for rats only at 24 h post LPS injection, at 1.6 times control levels. Thereafter, TNFα levels decreased to control levels. Statistically significant differences noted: (*).
Further evidence that LPS endotoxemia produces secondary neuroinflammation was also supported by the observation that microglial density increased in the brain of rats following LPS treatment, compared to controls (Figure 4). Cortical microglia were quantified 24 h post LPS administration and were 1.9 times greater in LPS-treated than control rats. The mean number of microglia per 20X microscopic field was 8.5 (SE 1.45) for control rats and 16.15 (SE 2.09) for LPS treated rats, a difference that was statistically significant (p < 0.0001).
Figure 4.
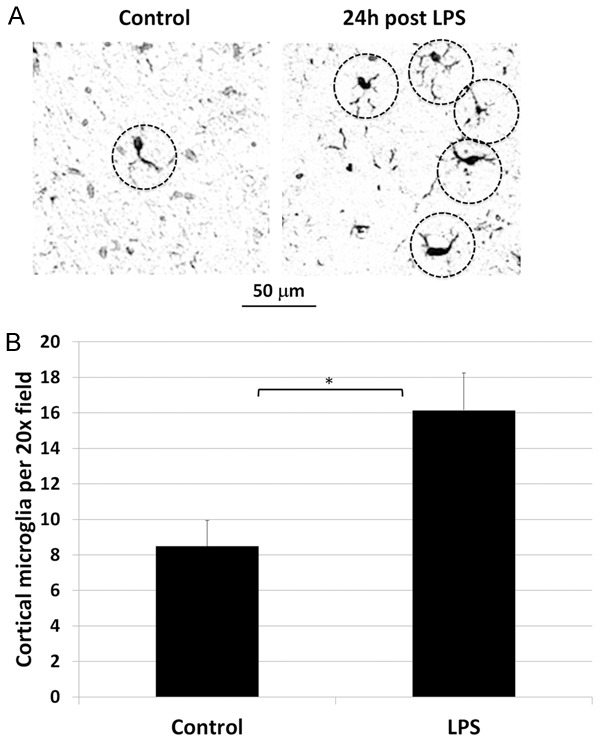
Effect of LPS on cortical microglial density. A. Representative photomicrograph of Iba-1 immunostained cortex of control (left) and LPS-treated (right) rats show cell bodies with elongated processes (dashed circles), typical in shape of microglia, visually more numerous in the LPS treated rat. B. Cortical microglia were quantified 24 h post LPS administration and were significantly increased at 1.9 times control levels. Statistically significant difference noted: (*).
LPS increases soluble Aβ peptide in the brain
Systemic administration of a single high dose of LPS resulted in an increase in soluble Aβ in the brain. Following systemic administration of LPS, soluble Aβ (1-42) monomer in whole brain homogenates peaked at 24 h, with levels 2 times higher than control levels (Table 2, Figure 5). Beyond 1 d post LPS, soluble Aβ levels progressively decreased but remained higher than controls (statistically significant) for the interval of observation (to 7-9 d post LPS).
Table 2.
Western Blot analysis of relative band intensities of soluble Aβ monomer in whole brain homogenates of control rats and those at various intervals following the intraperitoneal administration of 10 mg/kg LPS
| Effect of LPS on soluble Aβ monomer in the brain | |||
|---|---|---|---|
|
| |||
| Interval from LPS injection | N | Relative band intensity (SE) | p = LPS vs. control |
| Control | 11 | 1.00 (0.07) | |
| 24 h | 10 | 1.98 (0.17) | < 0.0001 |
| 3 d | 8 | 1.74 (0.13) | < 0.0001 |
| 7-9 d | 8 | 1.53 (0.09) | < 0.001 |
SE = standard error of the mean.
Figure 5.
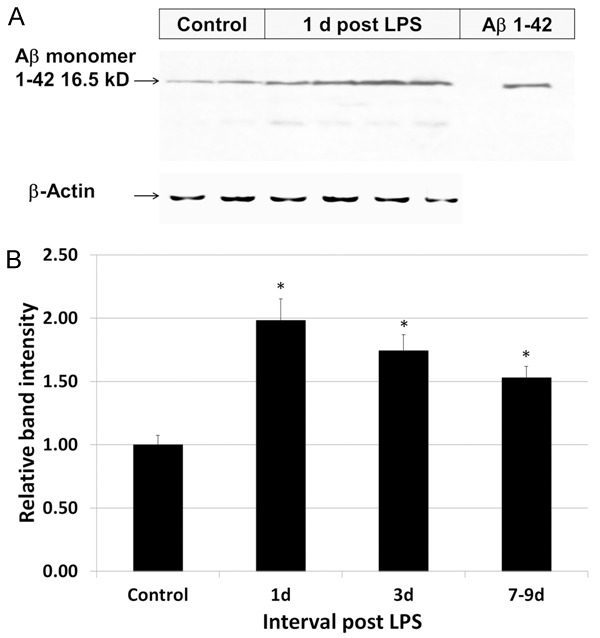
Effect of LPS on soluble Aβ (1-42) levels in the brain. A. A representative western blot (immunoblot) of whole brain homogenates demonstrates an increase in relative band intensities of soluble Aβ (1-42) 16.5 kD (monomeric) peptide in control rats and in those 24 h following LPS administration. B. Displayed graphically, systemic administration of LPS resulted in increases in soluble Aβ1-42 peptide in whole brain homogenates, peaking at 24 h at 2 times higher than control levels. Beyond 1 d post LPS, soluble Aβ monomeric levels progressively decreased but remained higher than controls for the interval of observation (to 7-9 d). Statistically significant differences noted: (*).
LPS results in progressive increase in Aβ diffuse plaques in the brain
As shown in Table 3 and Figure 6, LPS-treated rats developed discrete focal plaques of Aβ immunostaining in the cerebral cortex. Control animals had no identifiable plaques. Whereas soluble Aβ levels declined slightly beyond 24 h, Aβ plaque density continued to rise progressively over time throughout the interval of observation.
Table 3.
Comparison of plaque density (mean number of plaques per 10X objective field) in various brain regions of control rats and those at various intervals following the intraperitoneal administration of 10 mg/kg LPS
| Effect of LPS on Aβ plaques in the cortex | |||
|---|---|---|---|
|
| |||
| 1 d post LPS | 3 d post LPS | 7-9 d post LPS | |
| N | 8 | 8 | 8 |
| Cortex mean number of plaques/10× field (SE) | 8.96 (1.85) | 14.87 (0.81) | 19.42 (0.61) |
| p vs. control (0) | < 0.01 | < 0.0001 | < 0.0001 |
| p vs. previous time point | < 0.05 | < 0.001 | |
SE = standard error of the mean.
Figure 6.
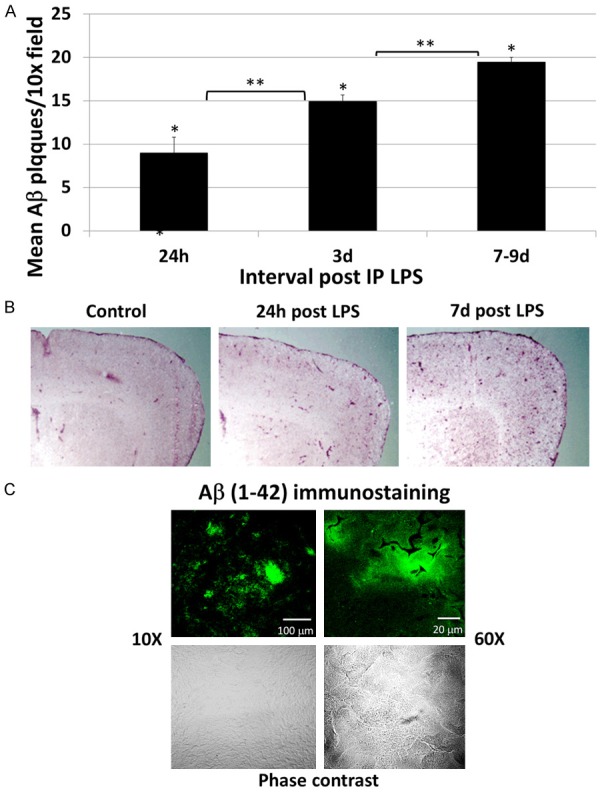
LPS induces Aβ plaque deposition in the brain. A. LPS treated rats showed a progressive increase in cortical Aβ plaque deposition throughout the interval of observation (7-9 d). All values were significantly increased over control rats, which had no identifiable plaques. B. Representative low power (macroscopic) images of similar areas of the brain in a control rat (left), at 3 d post LPS (center) and at 7 d post LPS (right) show diffuse increased punctate Aβ staining of the cortex in the LPS treated rats. C. Representative Aβ (1-42) immunostained sections of the brain of a rat 24 h post LPS are shown by confocal microscopy at 10× (left panel) and 60× (right panel) magnification. Upper panels show fluorescence immunostaining and the lower panels show the same regions under phase contrast. Discrete immunostained aggregates with ill-defined margins are morphologically consistent with diffuse plaques.
As shown by confocal microscopy (Figure 7), the Aβ plaques were morphologically consistent with diffuse plaques, with ill-defined margins and lacking a dense core. Diffuse plaques are inflammatory foci that have long been known to contain microglia and other proteins in addition to Aβ, such as microglia, cytokines, ApoE and complement components [33-36]. Immuno co-staining of slides confirmed co-localization of Aβ (1-42), microglia (Iba-1), C3 and ApoE, further confirming that these focal deposits of Aβ are consistent with diffuse plaques.
Figure 7.
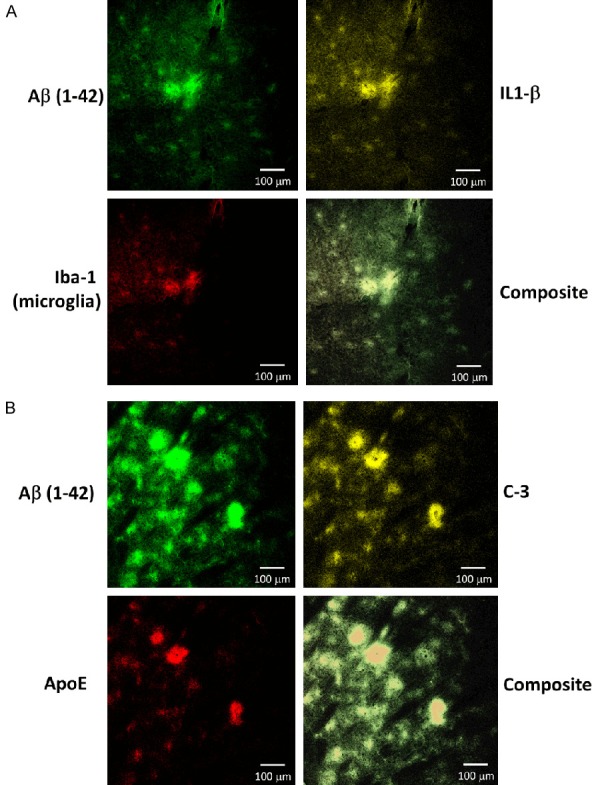
LPS administration result in formation of cortical aggregates with ill-defined margins that contain multiple components known to be present in diffuse plaques, including Aβ, microglia, IL-1β, ApoE and complement C-3. Representative 3-color confocal microscopic images are shown at 10× magnification. A. There is co-localization of Aβ (1-42) (upper left, green) with IL-1β (upper right, yellow) and Iba-1 (microglia, lower left, red). B. There is co-localization of Aβ (1-42) (upper left, green) with complement C3 (upper right, yellow) and ApoE (lower left, red).
Brain uptake of [18F]flutemetamol is increased in LPS-treated rats
[18F]flutemetamol activity in the frontal cortex and the ratio of cortex:corpus callosum activity was measured by phosphor imaging in control rats and in those 3 d post LPS administration (Table 4, Figure 8). As in humans, there is non-specific white matter uptake of 18F-flutemetamol in rats, best shown in the corpus callosum. Three days post LPS administration, there was 2.2 times more uptake of [18F]flutemetamol in the cortex of LPS-treated rats than in control rats (statistically significant). Uptake of 18F-flutemetamol in the corpus callosum was 20% higher, overall, in LPS-treated than control rats and visually apparent in some animals, but the difference was not statistically significant (Figure 8). Cortex:corpus callosum ratios were 1.7 times higher (statistically significant) in LPS-treated than control rats. The pattern suggests that [18F]flutemetamol uptake in the cortex is reflective of Aβ plaque accumulation in the brain in response to LPS-induced endotoxemia, an important mediator of systemic and neuroinflammation in sepsis.
Table 4.
Comparison of [18F]flutemetamol activity in various brain regions, as well as ratios (%) between brain regions and corpus callosum in control rats and those 3 d post intraperitoneal injection of 10 mg/kg LPS
| Effect of LPS on [18F]flutemetamol uptake in the brain | |||
|---|---|---|---|
|
| |||
| Control | 3 d post LPS | p = LPS vs. control | |
| N | 8 | 8 | 8 |
| Cortex mCi/g (SE) | 1.12 (0.06) | 2.49 (0.31) | < 0.05 |
| Corpus Callosum mCi/g (SE) | 4.60 (0.35) | 5.69 (0.73) | NS |
| Ratio (%) Cortex: Corpus Callosum (SE) | 24.68 (1.33) | 43.93 (2.07) | < 0.0001 |
SE = standard error of the mean.
Figure 8.
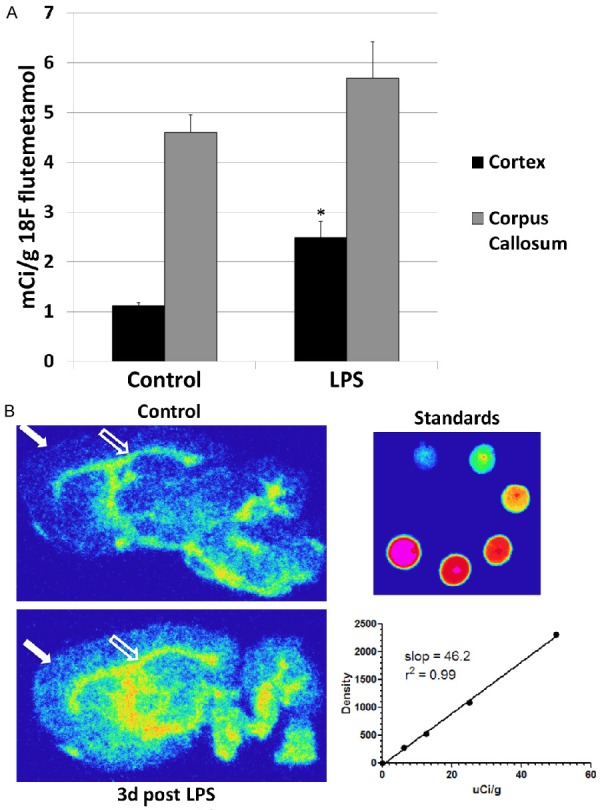
LPS administration results in increased cortical uptake of [18F]flutemetamol. A. Shown graphically are comparisons between control rats and those 3 d following LPS administration. There is a significant increase in cortical uptake of [18F]flutemetamol in the LPS-treated rat. A slight but not significant increase was also observed in the corpus callosum (white matter) with LPS administration. There was a statistically significant difference in the cortex:corpus callosum ratio of uptake (data not shown). Statistically significant differences noted: (*). B. Representative phosphor digital autoradiographic images through comparable sagittal brain slices harvested 60 min after the intravenous administration of [18F]flutemetamol in a control rat (upper left panel) and in one 3 d post IP LPS administration (lower left). There is visually appreciable increased deposition of 18F in the cortex (closed arrow) of the LPS treated rat compared to the control (a statistically significant difference). Increased uptake in the white matter corpus callosum (open arrow) in the LPS treated rat is also visually appreciable but this did not prove to be statistically significant. Standards of dilutions of slices of known activities of [18F]flutemetamol, and the corresponding standard curve are shown at lower right.
LPS increases p-tau content in the brain
The relative content of phosphorylated tau (p-tau) was measured in whole brain homogenates in control rats and in those 24 h post LPS (Figure 9). Relative band intensity of by Western Blot (immunoblot) analysis for control rats was 1.0 (SE 0.19), compared to 2.01 (SE 0.92) for LPS-treated rats, a difference that was statistically significant (p < 0.01).
Figure 9.
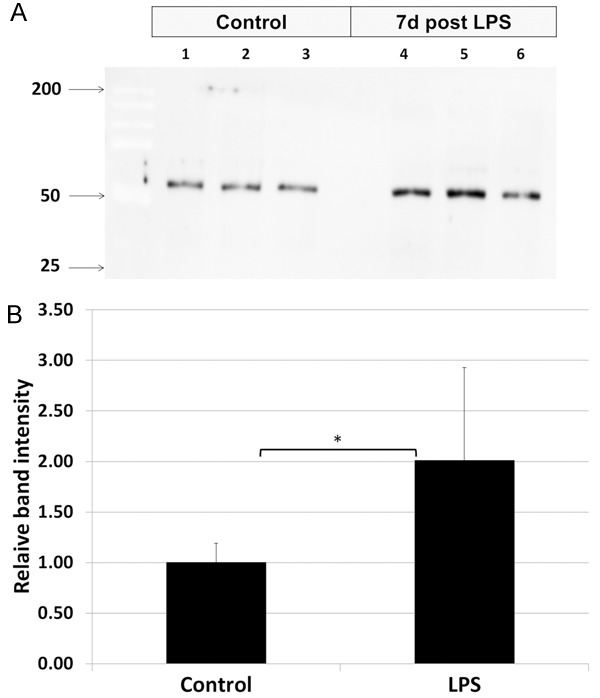
Effect of LPS administration on content of phosphorylated tau in the brain. Phosphorylated tau was measured by western blot analysis in whole brain homogenates of control rats and those 24 h post systemic administration of LPS. A. A representative western blot (immunoblot) shows an increase in relative intensity of bands staining positive for phosphorylated tau in LPS-treated rats, compared to controls. B. Graphically displayed, there was 2 times greater in LPS treated rats than in controls. Statistically significant differences noted: (*).
Discussion
The current study strengthens evidence for a link between acute systemic inflammation, secondary neuroinflammation and the deposition of Aβ plaques in the brain. This could theoretically provide a mechanistic basis by which sepsis produces long term neurocognitive compromise. It has been previously reported that Aβ peptide forms in the brains of septic rats and is associated with neurocognitive compromise [25]. The current study makes additional contributions to this field, confirming that fibrillogenic Aβ (1-42) peptide species derived from amyloid precursor protein (APP) accumulate in the brain in response to LPS, an important mediator of gram negative sepsis. In addition, our study shows that LPS results in the development of additional lesions that are constituents of other neurodegenerative disorders, such as AD. These include the accumulation of Aβ plaques and phosphorylated tau in the brain. Although it is tempting to postulate that these lesions could result in some of the same downstream neuropathology as is seen in AD, including the development of hyperphosporylated tau filaments, neurofibrillary tangles, gliosis and ultimately neuronal loss and dementia, there are many unanswered questions that must be addressed before these conclusions can be reached.
The plaques observed in this study in the LPS treated rats were morphologically consistent with diffuse plaques. Diffuse plaques are not specific for AD and can also be seen in cognitively intact elderly patients. Dense core-based plaques are more specific and required for the diagnosis of AD and are surrounded by dystrophic neurites (neuritic plaques). There are some opinions that diffuse plaques represent an earlier stage of plaque development that subsequently may progress to the formation of neuritic plaques [37,38]. However, this progressive theory of plaque development is, at this point, theoretical. Increased levels of p-tau, which is another feature of AD, are also seen in the LPS-treated rats. However, a full mapping of the topographical and cell-associated distribution of the Aβ plaques and p-tau with adjacent neurite morphology resulting from LPS exposure remain to be performed. Whether the Aβ plaques and p-tau eventually clear with time is also unknown.
One proposed mechanism for Aβ accumulation in the brain in patients with AD is reduced clearance of Aβ across the BBB into the systemic circulation [39]. However, peripheral administration of LPS may alter Aβ levels in the brain via inhibition of Aβ clearance by multiple mechanisms related to the inflammatory process [40]. There are many reports of cognitive dysfunction following both critical illness and both acute and chronic inflammatory disease, suggesting a link between systemic inflammation and secondary neuroinflammation [41-46]. This link has been best supported in sepsis, which results in both acute and chronic neurological dysfunction [22]. Acutely, sepsis is often associated with delirium [19], which is followed by sustained long-term cognitive impairment in many cases, particularly in the elderly population [47,48]. Seventy percent of survivors with adult respiratory distress syndrome, a common complication of sepsis, have neurocognitive impairment at hospital discharge, and up to 45% have demonstrable neurocognitive impairment at 1 year [44]. The pathophysiology of septic encephalopathy is likely multifactorial [23,49,50]. There is a lack of understanding of the mechanisms and the long-term consequences of sepsis on cognitive function. The current research showing a link between severe systemic LPS-induced inflammation and Aβ deposition in the brain may provide possible clues as to the pathogenesis of sepsis-induced encephalopathy and support broader research in the neurocognitive consequences of other systemic inflammatory diseases.
The results of this study also support the concept that PET scanning with Aβ plaque avid radiopharmaceuticals, for example [18F]flutemetamol, may be useful in tracking the accumulation of Aβ deposits in the brain in both humans and animal models of sepsis and other inflammatory diseases. Amyloid PET may also provide a mechanism to evaluate the efficacy of potentially mitigating therapies directed against the neuroinflammatory consequences of sepsis. Aβ-avid PET radiopharmaceuticals show increased binding in the brains of many cognitively normal adults, and up to 35% of cognitively normal seniors [9,10]. This finding has led to scientific and ethical debate over the significance of this finding and the advisability of screening cognitively normal patients with amyloid-binding PET imaging [10]. However, there is ongoing evidence to support that an increase in cortical Aβ plaque, as defined by Aβ-binding PET, is associated with a risk for future cognitive decline in elderly patients [14,15]. It must be stressed that the current research report is not claiming that sepsis leads to the development of AD. However, that inflammatory or pro-inflammatory conditions precede both the development of AD and mild cognitive impairment is a currently popular theory [51]. Aβ-binding PET imaging may provide a safe, non-invasive way not only to identify early phase Alzheimer’s disease, but also to study other conditions that may contribute to Aβ brain pathology, such as sepsis and potentially other systemic inflammatory conditions in humans and animal models.
Conclusions
This research increases our knowledge of the role of systemic inflammatory disease in secondary neuroinflammation and in Aβ pathophysiology. LPS-induced acute systemic inflammation results in secondary neuroinflammation, elevations in soluble Aβ peptide and phosphorylated tau, progressively increasing Aβ diffuse plaque deposition in the brain, and increased uptake of cortical [18F]flutemetamol. Unanswered questions include the neurocognitive significance of the findings and whether the Aβ plaques and other pathologic features that form in response to LPS eventually clear with time. Whether similar findings can be confirmed in humans as a consequence of sepsis or other acute or chronic systemic inflammatory conditions also remains to be determined. Amyloid-β PET may provide a non-invasive mechanism to better understand this process in human sepsis survivors and to explore the effects of potentially mitigating therapies.
Acknowledgements
This work was supported by a grant from the National Institutes of Health (NIH RO1NS092458). Additional support was provided by the Center for Quantitative Cancer Imaging, Huntsman Cancer Institute, University of Utah. R.S.R. was supported by a Coordenacao de Aperfeicoamento de Pessoal de Nivel Superior (CAPES) fellowship and F.A.B. by a Conselho Nacional de Pesquisa (CNPq) fellowship. The authors declare no competing financial interests.
Disclosure of conflict of interest
None.
References
- 1.Karran E, Mercken M, De Strooper B. The amyloid cascade hypothesis for Alzheimer’s disease: an appraisal for the development of therapeutics. Nat Rev Drug Discov. 2011;10:698–712. doi: 10.1038/nrd3505. [DOI] [PubMed] [Google Scholar]
- 2.Mason NS, Mathis CA, Klunk WE. Positron emission tomography radioligands for in vivo imaging of Aβ plaques. J Labelled Comp Radiopharm. 2013;56:89–95. doi: 10.1002/jlcr.2989. [DOI] [PMC free article] [PubMed] [Google Scholar]
- 3.Ossenkoppele R, Prins ND, Pijnenburg YA, Lemstra AW, van der Flier WM, Adriaanse SF, Windhorst AD, Handels RL, Wolfs CA, Aalten P, Verhey FR, Verbeek MM, van Buchem MA, Hoekstra OS, Lammertsma AA, Scheltens P, van Berckel BN. Impact of molecular imaging on the diagnostic process in a memory clinic. Alzheimers Dement. 2013;9:414–421. doi: 10.1016/j.jalz.2012.07.003. [DOI] [PubMed] [Google Scholar]
- 4.Rabinovici GD, Jagust WJ. Amyloid imaging in aging and dementia: testing the amyloid hypothesis in vivo. Behav Neurol. 2009;21:117–128. doi: 10.3233/BEN-2009-0232. [DOI] [PMC free article] [PubMed] [Google Scholar]
- 5.Petrella JR. Neuroimaging and the search for a cure for Alzheimer disease. Radiology. 2013;269:671–691. doi: 10.1148/radiol.13122503. [DOI] [PubMed] [Google Scholar]
- 6.Johnson KA, Minoshima S, Bohnen NI, Donohoe KJ, Foster NL, Herscovitch P, Karlawish JH, Rowe CC, Carrillo MC, Hartley DM, Hedrick S, Pappas V, Thies WH. Appropriate use criteria for amyloid PET: a report of the amyloid imaging task force, the society of nuclear medicine and molecular imaging, and the Alzheimer’s association. J Nucl Med. 2013;54:476–90. doi: 10.2967/jnumed.113.120618. [DOI] [PubMed] [Google Scholar]
- 7.Ferrer I. Defining Alzheimer as a common age-related neurodegenerative process not inevitably leading to dementia. Prog Neurobiol. 2012;97:38–51. doi: 10.1016/j.pneurobio.2012.03.005. [DOI] [PubMed] [Google Scholar]
- 8.Johnson VE, Stewart W, Smith DH. Widespread τ and amyloid-β pathology many years after a single traumatic brain injury in humans. Brain Pathol. 2012;22:142–149. doi: 10.1111/j.1750-3639.2011.00513.x. [DOI] [PMC free article] [PubMed] [Google Scholar]
- 9.Braak H, Braak E. Cognitive impairment in Parkinson’s disease: amyloid plaques, neurofibrillary tangles, and neuropil threads in the cerebral cortex. J Neural Transm Park Dis Dement Sect. 1990;2:45–57. doi: 10.1007/BF02251245. [DOI] [PubMed] [Google Scholar]
- 10.Chételat G, La Joie R, Villain N, Perrotin A, de La Sayette V, Eustache F, Vandenberghe R. Amyloid imaging in cognitively normal individuals, at-risk populations and preclinical Alzheimer’s disease. Neuroimage Clin. 2013;2:356–365. doi: 10.1016/j.nicl.2013.02.006. [DOI] [PMC free article] [PubMed] [Google Scholar]
- 11.Fleisher AS, Chen K, Liu X, Roontiva A, Thiyyagura P, Ayutyanont N, Joshi AD, Clark CM, Mintun MA, Pontecorvo MJ, Doraiswamy PM, Johnson KA, Skovronsky DM, Reiman EM. Using positron emission tomography and florbetapir F18 to image cortical amyloid in patients with mild cognitive impairment or dementia due to Alzheimer disease. Arch Neurol. 2011;68:1404–1411. doi: 10.1001/archneurol.2011.150. [DOI] [PubMed] [Google Scholar]
- 12.Aizenstein HJ, Nebes RD, Saxton JA, Price JC, Mathis CA, Tsopelas ND, Ziolko SK, James JA, Snitz BE, Houck PR, Bi W, Cohen AD, Lopresti BJ, DeKosky ST, Halligan EM, Klunk WE. Frequent amyloid deposition without significant cognitive impairment among the elderly. Arch Neurol. 2008;65:1509–1517. doi: 10.1001/archneur.65.11.1509. [DOI] [PMC free article] [PubMed] [Google Scholar]
- 13.Landau SM, Mintun MA, Joshi AD, Koeppe RA, Petersen RC, Aisen PS, Weiner MW, Jagust WJ Alzheimer’s Disease Neuroimaging Initiative. Amyloid deposition, hypometabolism, and longitudinal cognitive decline. Ann Neurol. 2012;72:578–586. doi: 10.1002/ana.23650. [DOI] [PMC free article] [PubMed] [Google Scholar]
- 14.Vlassenko AG, Mintun MA, Xiong C, Sheline YI, Goate AM, Benzinger TL, Morris JC. Amyloid-beta plaque growth in cognitively normal adults: longitudinal [11C] Pittsburgh compound B data. Ann Neurol. 2011;70:857–861. doi: 10.1002/ana.22608. [DOI] [PMC free article] [PubMed] [Google Scholar]
- 15.Stonnington CM, Chen K, Lee W, Locke DE, Dueck AC, Liu X, Roontiva A, Fleisher AS, Caselli RJ, Reiman EM. Fibrillar amyloid correlates of preclinical cognitive decline. Alzheimers Dement. 2014;10:e1–8. doi: 10.1016/j.jalz.2013.01.009. [DOI] [PMC free article] [PubMed] [Google Scholar]
- 16.Doraiswamy PM, Sperling RA, Johnson K, Reiman EM, Wong TZ, Sabbagh MN, Sadowsky CH, Fleisher AS, Carpenter A, Joshi AD, Lu M, Grundman M, Mintun MA, Skovronsky DM, Pontecorvo MJ AV45-A11 Study Group; AV45-A11 Study Group. Florbetapir F 18 amyloid PET and 36-month cognitive decline: a prospective multicenter study. Mol Psychiatry. 2014;19:1044–51. doi: 10.1038/mp.2014.9. [DOI] [PMC free article] [PubMed] [Google Scholar]
- 17.Lyman M, Lloyd DG, Ji X, Vizcaychipi MP, Ma D. Neuroinflammation: the role and consequences. Neurosci Res. 2014;79:1–12. doi: 10.1016/j.neures.2013.10.004. [DOI] [PubMed] [Google Scholar]
- 18.Rosano C, Marsland AL, Gianaros PJ. Maintaining brain health by monitoring inflammatory processes: a mechanism to promote successful aging. Aging Dis. 2012;3:16–33. [PMC free article] [PubMed] [Google Scholar]
- 19.Ebersoldt M, Sharshar T, Annane D. Sepsis-associated delirium. Intensive Care Med. 2007;33:941–050. doi: 10.1007/s00134-007-0622-2. [DOI] [PubMed] [Google Scholar]
- 20.Siami S, Annane D, Sharshar T. The encephalopathy in sepsis. Crit Care Clin. 2008;24:67–82. viii. doi: 10.1016/j.ccc.2007.10.001. [DOI] [PubMed] [Google Scholar]
- 21.Hopkins RO, Weaver LK, Chan KJ, Orme JF Jr. Quality of life, emotional, and cognitive function following acute respiratory distress syndrome. J Int Neuropsychol Soc. 2004;10:1005–1017. doi: 10.1017/s135561770410711x. [DOI] [PubMed] [Google Scholar]
- 22.Lamar CD, Hurley RA, Taber KH. Sepsis-associated encephalopathy: review of the neuropsychiatric manifestations and cognitive outcome. J Neuropsychiatry Clin Neurosci. 2011;23:237–241. doi: 10.1176/jnp.23.3.jnp237. [DOI] [PubMed] [Google Scholar]
- 23.Bozza FA, D’Avila JC, Ritter C, Sonneville R, Sharshar T, Dal-Pizzol F. Bioenergetics, mitochondrial dysfunction, and oxidative stress in the pathophysiology of septic encephalopathy. Shock. 2013;39(Suppl 1):10–16. doi: 10.1097/SHK.0b013e31828fade1. [DOI] [PubMed] [Google Scholar]
- 24.Lee JW, Lee YK, Yuk DY, Choi DY, Ban SB, Oh KW, Hong JT. Neuro-inflammation induced by lipopolysaccharide causes cognitive impairment through enhancement of beta-amyloid generation. J Neuroinflammation. 2008;5:37. doi: 10.1186/1742-2094-5-37. [DOI] [PMC free article] [PubMed] [Google Scholar]
- 25.Schwalm MT, Pasquali M, Miguel SP, Dos Santos JP, Vuolo F, Comim CM, Petronilho F, Quevedo J, Gelain DP, Moreira JC, Ritter C, Dal-Pizzol F. Acute brain inflammation and oxidative damage are related to long-term cognitive deficits and markers of neurodegeneration in sepsis-survivor rats. Mol Neurobiol. 2013;49:380–385. doi: 10.1007/s12035-013-8526-3. [DOI] [PubMed] [Google Scholar]
- 26.Obrenovich ME, Joseph JA, Atwood CS, Perry G, Smith MA. Amyloid-beta: a (life) preserver for the brain. Neurobiol Aging. 2002;23:1097–1099. doi: 10.1016/s0197-4580(02)00038-6. [DOI] [PubMed] [Google Scholar]
- 27.Giuffrida ML, Caraci F, De Bona P, Pappalardo G, Nicoletti F, Rizzarelli E, Copani A. The monomer state of beta-amyloid: where the Alzheimer’s disease protein meets physiology. Rev Neurosci. 2010;21:83–93. doi: 10.1515/revneuro.2010.21.2.83. [DOI] [PubMed] [Google Scholar]
- 28.Giuffrida ML, Caraci F, Pignataro B, Cataldo S, De Bona P, Bruno V, Molinaro G, Pappalardo G, Messina A, Palmigiano A, Garozzo D, Nicoletti F, Rizzarelli E, Copani A. Beta-amyloid monomers are neuroprotective. J Neurosci. 2009;29:10582–10587. doi: 10.1523/JNEUROSCI.1736-09.2009. [DOI] [PMC free article] [PubMed] [Google Scholar]
- 29.Spuch C, Ortolano S, Navarro C. New insights in the amyloid-Beta interaction with mitochondria. J Aging Res. 2012;2012:324968. doi: 10.1155/2012/324968. [DOI] [PMC free article] [PubMed] [Google Scholar]
- 30.Chen JX, Yan SS. Role of mitochondrial amyloid-beta in Alzheimer’s disease. J Alzheimers Dis. 2010;20(Suppl 2):S569–78. doi: 10.3233/JAD-2010-100357. [DOI] [PubMed] [Google Scholar]
- 31.Fink MP. Animal models of sepsis. Virulence. 2014;5:143–53. doi: 10.4161/viru.26083. [DOI] [PMC free article] [PubMed] [Google Scholar]
- 32.Ly PT, Cai F, Song W. Detection of neuritic plaques in Alzheimer’s disease mouse model. J Vis Exp. 2011 doi: 10.3791/2831. [DOI] [PMC free article] [PubMed] [Google Scholar]
- 33.Namba Y, Tomonaga M, Kawasaki H, Otomo E, Ikeda K. Apolipoprotein E immunoreactivity in cerebral amyloid deposits and neurofibrillary tangles in Alzheimer’s disease and kuru plaque amyloid in Creutzfeldt-Jakob disease. Brain Res. 1991;541:163–166. doi: 10.1016/0006-8993(91)91092-f. [DOI] [PubMed] [Google Scholar]
- 34.Eikelenboom P, Hack CE, Rozemuller JM, Stam FC. Complement activation in amyloid plaques in Alzheimer’s dementia. Virchows Arch B Cell Pathol Incl Mol Pathol. 1989;56:259–622. doi: 10.1007/BF02890024. [DOI] [PubMed] [Google Scholar]
- 35.Veerhuis R, Janssen I, Hack CE, Eikelenboom P. Early complement components in Alzheimer’s disease brains. Acta Neuropathol. 1996;91:53–60. doi: 10.1007/s004019570001. [DOI] [PubMed] [Google Scholar]
- 36.Eikelenboom P, Veerhuis R, van Exel E, Hoozemans JJ, Rozemuller AJ, van Gool WA. The early involvement of the innate immunity in the pathogenesis of late-onset Alzheimer’s disease: neuropathological, epidemiological and genetic evidence. Curr Alzheimer Res. 2011;8:142–150. doi: 10.2174/156720511795256080. [DOI] [PubMed] [Google Scholar]
- 37.Ellison D, Love S. Dementias. In: Ellison D, Love S, Chimelli L, Harding B, Lowe J, Vinters HV, Brandner S, Yong W, editors. Neuropathology: a reference text of CNS pathology. Edinburgh, UK: Mosby; 2004. pp. 551–584. [Google Scholar]
- 38.Hardy J, Allsop D. Amyloid deposition as the central event in the aetiology of Alzheimer’s disease. Trends Pharmacol Sci. 1991;12:383–388. doi: 10.1016/0165-6147(91)90609-v. [DOI] [PubMed] [Google Scholar]
- 39.Zlokovic BV, Deane R, Sagare AP, Bell RD, Winkler EA. Low-density lipoprotein receptor-related protein-1: a serial clearance homeostatic mechanism controlling Alzheimer’s amyloid β-peptide elimination from the brain. J Neurochem. 2010;115:1077–1089. doi: 10.1111/j.1471-4159.2010.07002.x. [DOI] [PMC free article] [PubMed] [Google Scholar]
- 40.Erickson MA, Hartvigson PE, Morofuji Y, Owen JB, Butterfield DA, Banks WA. Lipopolysaccharide impairs amyloid β efflux from brain: altered vascular sequestration, cerebrospinal fluid reabsorption, peripheral clearance and transporter function at the blood-brain barrier. J Neuroinflammation. 2012;9:150. doi: 10.1186/1742-2094-9-150. [DOI] [PMC free article] [PubMed] [Google Scholar]
- 41.Rosano C, Marsland AL, Gianaros PJ. Maintaining brain health by monitoring inflammatory processes: a mechanism to promote successful aging. Aging Dis. 2012;3:16–33. [PMC free article] [PubMed] [Google Scholar]
- 42.Pandharipande PP, Girard TD, Jackson JC, Morandi A, Thompson JL, Pun BT, Brummel NE, Hughes CG, Vasilevskis EE, Shintani AK, Moons KG, Geevarghese SK, Canonico A, Hopkins RO, Bernard GR, Dittus RS, Ely EW BRAIN-ICU Study Investigators. Long-term cognitive impairment after critical illness. N Engl J Med. 2013;369:1306–1316. doi: 10.1056/NEJMoa1301372. [DOI] [PMC free article] [PubMed] [Google Scholar]
- 43.Jackson JC, Mitchell N, Hopkins RO. Cognitive functioning, mental health, and quality of life in ICU survivors: an overview. Anesthesiol Clin. 2011;29:751–764. doi: 10.1016/j.anclin.2011.09.012. [DOI] [PubMed] [Google Scholar]
- 44.Mikkelsen ME, Christie JD, Lanken PN, Biester RC, Thompson BT, Bellamy SL, Localio AR, Demissie E, Hopkins RO, Angus DC. The adult respiratory distress syndrome cognitive outcomes study: long-term neuropsychological function in survivors of acute lung injury. Am J Respir Crit Care Med. 2012;185:1307–1315. doi: 10.1164/rccm.201111-2025OC. [DOI] [PMC free article] [PubMed] [Google Scholar]
- 45.Shin SY, Julian L, Katz P. The relationship between cognitive function and physical function in rheumatoid arthritis. J Rheumatol. 2013;40:236–243. doi: 10.3899/jrheum.120871. [DOI] [PMC free article] [PubMed] [Google Scholar]
- 46.Meade T, Manolios N, Cumming SR, Conaghan PG, Katz P. Cognitive impairment in rheumatoid arthritis: a systematic review. Arthritis Care Res (Hoboken) 2018;70:39–52. doi: 10.1002/acr.23243. [DOI] [PubMed] [Google Scholar]
- 47.Adam N, Kandelman S, Mantz J, Chrétien F, Sharshar T. Sepsis-induced brain dysfunction. Expert Rev Anti Infect Ther. 2013;11:211–221. doi: 10.1586/eri.12.159. [DOI] [PubMed] [Google Scholar]
- 48.Iwashyna TJ, Ely EW, Smith DM, Langa KM. Long-term cognitive impairment and functional disability among survivors of severe sepsis. JAMA. 2010;304:1787–1794. doi: 10.1001/jama.2010.1553. [DOI] [PMC free article] [PubMed] [Google Scholar]
- 49.Semmler A, Hermann S, Mormann F, Weberpals M, Paxian SA, Okulla T, Schäfers M, Kummer MP, Klockgether T, Heneka MT. Sepsis causes neuroinflammation and concomitant decrease of cerebral metabolism. J Neuroinflammation. 2008;5:38. doi: 10.1186/1742-2094-5-38. [DOI] [PMC free article] [PubMed] [Google Scholar]
- 50.Navarro A, Sánchez Del Pino MJ, Gómez C, Peralta JL, Boveris A. Behavioral dysfunction, brain oxidative stress, and impaired mitochondrial electron transfer in aging mice. Am J Physiol Regul Integr Comp Physiol. 2002;282:R985–992. doi: 10.1152/ajpregu.00537.2001. [DOI] [PubMed] [Google Scholar]
- 51.Ferretti MT, Cuello AC. Does a pro-inflammatory process precede Alzheimer’s disease and mild cognitive impairment? Curr Alzheimer Res. 2011;8:164–74. doi: 10.2174/156720511795255982. [DOI] [PubMed] [Google Scholar]


