Abstract
Quantitative analysis of glucose consumption measured by maximum standardized uptake value (SUVmax) in lung adenocarcinoma (LA) remains in discussion and metabolic information provided by FDG-PET is not included in cancer staging. The first aim of this work was to evaluate the correlation between SUVmax and different histologic subtypes of LA. The second aim was to establish the correlation between SUVmax and TNM, genetic mutations and prognostic. Glucose consumption of primary tumor was quantified using SUVmax in 112 patients with histologically-confirmed LA. Specimens were classified according to the IASLC/ATS/ERS into in situ -AIS-, minimally invasive -MIA-, invasive (lepidic, papillary, acinar, solid and micropapillary) and invasive mucinous adenocarcinoma. Tumors were grouped according to three histological grades; low-grade: AIS, MIA, intermediate-grade: lepidic, acinar, papillary and high-grade: micropapillary, solid and mucinous. Comparisons between SUVmax and histologic subtypes were performed with Kruskal-Wallis followed by a Dunn’s test. Overall (OS) and disease-free survival (DFS) were calculated. SUVmax was histologically-dependent (P<0.001): AIS 0.5±0.1, MIA 1.1±0.9 lepidic 3.3±3.1, acinar 8.6±6.7, papillary 3.9±5.1, micropapillary 4.9±3.4, solid 10.4±5.4 and invasive mucinous 2.7±1.2. SUVmax was associated with TNM stage in stage IA and IB. SUVmax was significantly lower in patients with K-RAS and EGFR mutation. Low SUVmax was associated with low-grade histology and with a higher OS and DSF compared to high SUVmax (intermediate and high-grade histology). SUVmax on FDG-PET is a powerful information in the presurgical evaluation of LA patients. It provides prognostic data and should be considered in the staging algorithm of patients with LA.
Keywords: Lung adenocarcinoma, 18F-fluorodeoxyglucose positron emission tomography (18F-FDG PET), maximum standardized uptake value (SUVmax), histologic classification, staging, prognostic
Introduction
Lung cancer is the leading cause of cancer-related mortality worldwide and lung adenocarcinoma (LA) is the most frequently diagnosed subtype. Nowadays TNM stage is the strongest prognostic factor of LA and the main tool to tailor treatment. Traditionally LA staging has been mainly based on morphological criteria, although it is well known the importance of metabolic aspects in the cancer process [1,2]. 18F-fluorodeoxyglucose positron emission tomography (18F-FDG-PET) has been included in the evaluation of lung cancer patients because of the key role of this technique in the detection of nodal and distance metastases [3-6].
LA is an example of tumor heterogeneity, with different cell subtypes coexisting within the same tumor, with different behaviours and different treatment outcomes. Quantitative analysis obtained with 18F-FDG-PET could be useful information in the process of characterizing tumor heterogeneity.
Otto Warburg in 1924 described the increased uptake of glucose in the presence of oxygen by tumor cells, (“Warburg effect” or aerobic glycolysis) [7,8]. Since then we have come a long way to integrate changes in glucose metabolism by tumor cells in the clinical study of the oncological patient.
18F-FDG-PET is a molecular “in vivo” imaging technique used in the evaluation of oncological patients. FDG is a glucose analogue that is uptaked by tumor cells proportionally to their glucose consumption, which is increased following the Warburg effect. This metabolic information has been correlated with cell differentiation [9], proliferation [10], genetic expression [11], circulating tumor cells [12], hypoxia [13] and prognosis [14-18]. The maximum standard uptake value (SUVmax) is a widely used parameter to quantify glucose consumption by tumor cells.
The landscape of lung cancer pathology has been dramatically improved over the past decade, and is now driven by the principles of personalized medicine and genetics. In 2011, the International Association for the Study of Lung Cancer (ASLC), the American Thoracic Society (ATS) and the European Respiratory Society (ERS) proposed a new histological classification of lung adenocarcinoma. One of the significant changes of this new classification was that invasive adenocarcinomas are classified according to the predominant pattern after the use of comprehensive histologic subtyping to estimate the percentages of the various components in a semiquantitative fashion in 5%-10% increments. The recognition patterns of adenocarcinoma are lepidic, acinar, papillary, and solid [19,20]. Some studies have shown a correlation between histological subtypes of LA by IASLC/ATS/ERS classification and glucose consumption of the tumor, measured by FDG-PET. Moreover some studies have demonstrated that it is feasible to establish a grading criterion of these patients in high, intermediate and low grade glucose consumers with prognostic implications [21-26].
In this study we have assessed the correlation between the IASLC/ATS/ERS histological classification and SUVmax in a series of patients with LA undergoing elective surgical removal of the primary tumor in our center. Due to the heterogeneity of LA, the second predominant pattern was also considered in this correlation. In addition, we explored the correlation between SUVmax and tumor stage, the molecular findings and the prognostic value.
Material and methods
Patients
We performed a retrospective analysis of 112 patients with histologically-confirmed LA in whom a whole-body. 18F-FDG PET/CT scanning was performed preoperatively between 2008 and 2014. Disease stage was based on 7th edition of the American Joint Committee on Cancer tumor, node, metastasis (TNM), staging manual [1]. Clinical TNM stage was determined based on physical examination, CT scan, 18F-FDG PET/CT, bronchoscopy and/or CT-guided biopsy and in some cases by means of mediastinoscopy. In situ subtype was not included in the stage and the survival analysis. Patients with clinical stage IIIB and IV were excluded from the study. Patients were followed for cancer recurrence and survival for a minimum of 16 months after surgery. Information was obtained by reviewing the medical records of all patients.
Imaging protocol of 18F-FDG PET scans
18F-FDG PET/CT was performed using integrated PET-CT scanner (Discovery ST, GE Medical Systems). Patients were fasted for a minimum of 6 h prior to the procedure. Patients with blood glucose concentrations exceeding 160 mg/mL before radiotracer injection were excluded from the analysis. Images were obtained from base of the skull to mid-thigh level, 60 min after intravenous administration of 5.29 MBq/kg (0.14 mCi/kg).
18F-FDG. CT used for attenuation correction was followed by a PET study. PET images were reconstructed by using a standard ordered-subset expectation maximization algorithm (20 subsets, 2 iterations). PET/CT images were interpreted by an experienced specialist in nuclear medicine in association with a radiologist. For determination of SUVmax, a region of interest (ROI) was manually placed over the tumor site on the hottest transaxial slice. Activity concentration within the ROI was determined and expressed as SUV, where SUV is the ratio of the activity in the tissue to the decay corrected activity injected into the patient. All SUV measurements were normalized for patient body weight.). SUVmax was used as the reference measurement, and was determined by considering the tumor uptake given by the maximum pixel value within a region of interest in the tumor. Primary lesions were considered pathological (i.e. positive) if there was a localized area of higher FDG uptake than the surrounding normal tissue.
Histological evaluation
Tumors were classified according to the IASLC/ATS/ERS classification as: (1) adenocarcinoma-in-situ (AIS); (2) minimally invasive adenocarcinoma (MIA); and invasive adenocarcinoma, which was further subdivided according the predominant pattern of growth into (3) lepidic predominant (LPA), (4) acinar predominant (APA), (5) papillary predominant (PPA), (6) micropapillary predominant (MPA), (7) solid predominant (SPA), and (8) invasive mucinous predominant (IMA). Tumors were grouped according to the histological tumor grade based on predominant subtype as: low grade (adenocarcinoma in situ, MIA or lepidic predominant adenocarcinoma), intermediate grade (papillary or acinar predominant) and high grade (micropapillary, mucinous or solid predominant) [27,28]. We also considered the second pattern in the tumor as the second predominant pattern of growth.
Gene expression
All resected tumors were analyzed for genetic alteration including EGFR, K-RAS and ALK. EGFR and K-RAS were identified by polymerase chain reaction (PCR) (direct sequencing and Therascreen kit) and ALK rearrangement by fluorescence in situ hybridization (FISH) (Vysis ALK FISH break-apart kit). These are the mutated genes routinely detected in our centre, the rest of the tumors with other possible mutations were considered “wild type”.
Statistical analysis
Comparisons between SUVmax and histologic LA subtypes were performed using the Kruskal-Wallis test followed by a Dunn’s multiple comparison tests. The Mann Whitney-U test was used to assess differences when two groups were studied. Linear regression analysis was performed to evaluate the influence of the size of the tumor. Overall survival (OS) and disease-free survival (DFS) were calculated using the Kaplan-Meier method. A p value <0.05 was considered statistically significant.
Results
Patient characteristics
Patient baseline demographic data and clinical characteristics are listed in Table 1. We analysed 81 men and 31 women, with a mean (± SD) age of 71±18.7 years. The median tumor size was 21.1 mm (range 4-58 mm). The most frequent subtype was acinar predominant (50%) followed by solid predominant (13%), lepidic predominant (13%), papillary predominant (13%), invasive mucinous predominant (6%), micropapillary predominant (4%) and in situ and MIA (both 4%) (Table 1). The mean follow-up was 45 months (range 16-108 months). At the time of analysis, 87 patients were alive, 67 of them (60%) without evidence of disease. The estimated median OS was 81.2 months (95% confidence interval [CI] 72.3-90.1) and the DFS 67.8 months (95% CI, 58.1-77.3).
Table 1.
Clinico-pathological characteristics of 112 patients with lung adenocarcinoma. Association between SUVmax of the primary tumor and IASLC/ATS/ERS subtypes, stage, disease free survival (DFS) and overall survival (OS) are showed
| Subtype | N (%) | Female (%) | SUVmax (mean) | Pathological stage (%) | DFS (%) | OS (%) | |||||
|---|---|---|---|---|---|---|---|---|---|---|---|
|
| |||||||||||
| Is | IA | IB | IIA | IIB | IIIA | 4 years | 4 years | ||||
| AIS | 4 (3.8) | 2 (1.9) | 0.5±01 | 4 (100) | 100 | 100 | |||||
| MIA | 4 (3.8) | 2 (1.9) | 1.1±0.9 | 4 (100) | 100 | 100 | |||||
| LPA | 13 (12.6) | 6± (5.8) | 3.3±3.1 | 8 (61.5) | 2 (15.4) | 1 (7.7) | 0 | 2 (20) | 77 | 84.6 | |
| APA | 51 (50.5) | 14 (13.6) | 8.6±6.7 | 19 (35) | 16 (33) | 6 (12) | 5 (10) | 5 (10) | 59 | 76 | |
| PPA | 13 (12.7) | 4 (3.9) | 3.9±5.1 | 7 (53.8) | 2 (15) | 2 (15) | 1 (7.7) | 1 (7.7) | 77 | 69 | |
| MPA | 5 (4.4) | 0 | 4.9±3.4 | 0 | 2 (40) | 2 (40) | 0 | 1 (20) | 0 | 60 | |
| SPA | 15 (13.4) | 3 (2.9) | 10.4±5.4 | 3 (20) | 5 (33) | 3 (20) | 3 (20) | 1 (7) | 47 | 66 | |
| IMA | 7 (6.2) | 0 | 2.7±1.2 | 2 (28.5) | 1 (14) | 1 (14) | 2 (28.5) | 1 (14) | 13 | 85 | |
| Total | 112 (100) | 31 (28) | 4.81±5 | 4 | 43 | 28 | 15 | 11 | 11 | 56 | 75 |
AIS: adenocarcinoma-in-situ; MIA: minimally invasive adenocarcinoma; LPA: lepidic predominant; PAP: acinar predominant; PPA; papillary predominant; MPA: micropapillary predominant; SPA: solid predominant; IMA: invasive mucinous predominant.
Association between SUVmax and histological grade
Significant differences (P<0.0001) between SUVmax and the different histologic subtypes were observed. Solid predominant subtype showed the highest SUVmax (mean SUVmax 10.4±5.4) (Figure 1). In situ and MIA predominant subtype showed the lower mean SUVmax (mean SUVmax 0.5±0.1 and 1.1±0.9, respectively; Table 1; Figure 2A).
Figure 1.
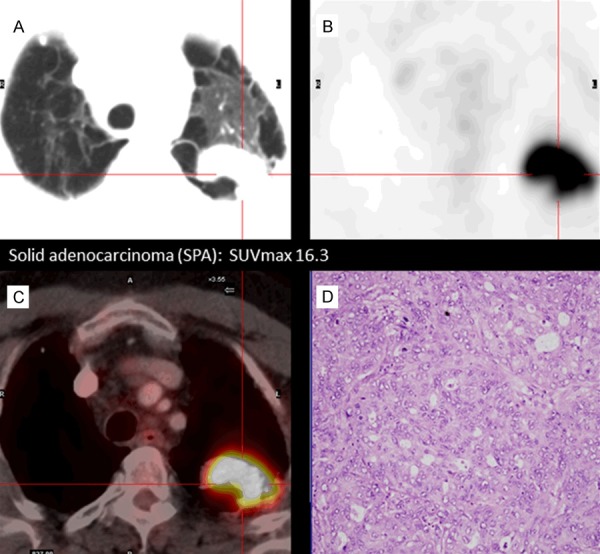
Correlation between histological adenocarcinoma subtype and 18F-FDG uptake by tumor cells. The figure presents an example of solid adenocarcinoma (SPA) subtype. This subtype shows a highest FDG uptake: CT images (A), PET images, SUVmax 16.3 (B), PET-CT fusion images (C) and histological sample (D) in which high cellularity can be observed.
Figure 2.
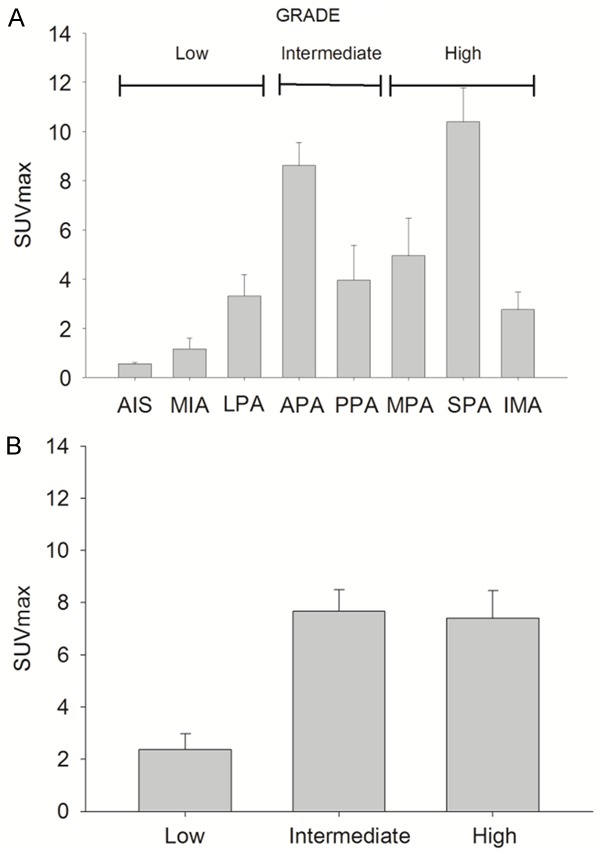
Maximum standardized value (SUVmax) of the different histological subtypes of lung adenocarcinoma. Solid predominant (SPA) subtype showed the highest SUVmax (10.4±5.4), with lower SUVmax values for “in situ” subtype (AIS) (0.5±0.1) and minimally invasive adenocarcinoma (MIA) (1.1±0.9). Mucinous subtype (IMA) had a low SUVmax 2.7±1.2) despite the fact of being included in the high histologic grade (A). Association between (SUVmax) of the different histologic lung adenocarcinoma grades (low, intermediate and high grade). Tumors with low-grade had the lowest SUVmax (2.4±2.7). The inclusion of IMA in the high-grade group was the reason for the lack of significant difference between intermediate (7.6±6.6) and high grade (7.4±5.5) (B).
Tumors with high or intermediate histological grade had a higher mean SUVmax 7.4±5.5; and 7.6±6.6 respectively, compared with low histological grade SUVmax 2.4±2.7. Significant differences in SUVmax were detected between the low histological grade and the other two groups (Figure 2B). Acinar predominant subtype showed a high variability SUVmax values. No differences were observed in SUVmax between solid and acinar subtypes. Due to the high variability in SUVmax observed in these patients, the second histological pattern was analysed. This analysis showed a slight but significant increase in SUVmax in patients with predominant acinar accompanied by a second growth pattern of intermediate or high grade (SUVmax 11.1±6.6) compared to those that were accompanied by a second pattern of low histological grade (SUVmax 7.24±6.5) (Figure 3A).
Figure 3.
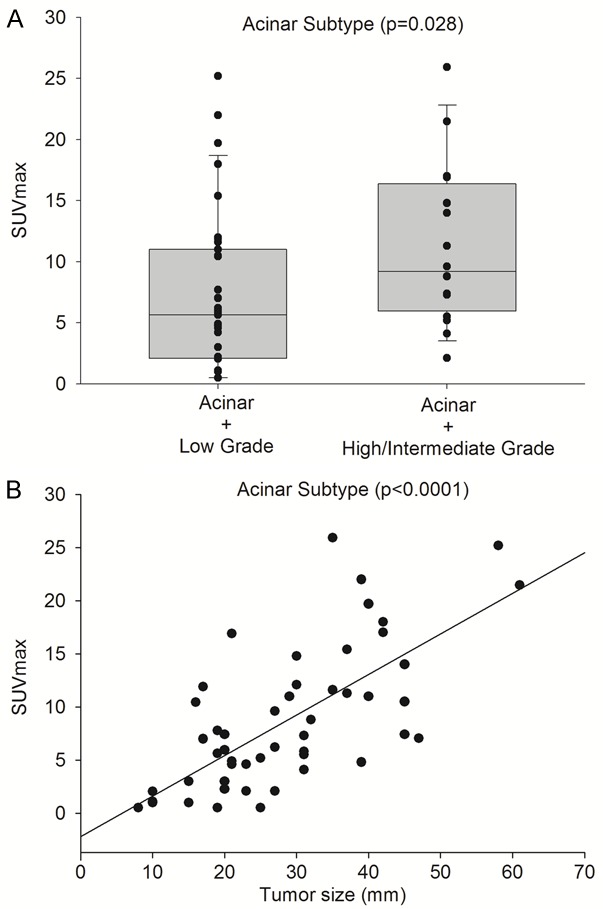
Acinar predominant subtype accompanied by a second growth pattern intermediate or high grade showed higher SUVmax (11.1±6.6) than acinar subtype accompanied by a second low grade growth pattern (7.2±6.5), P=0.028 (A). SUVmax in the acinar predominant subtype showed the strongest correlated with tumor dimensions (B).
Association between SUVmax and pathological tumor stage
Statistically significant differences in SUVmax between different stages were observed (P<0.0001). Stage IA had the lowest SUVmax (3.4±4.1) compared to the other stages. Similar SUVmax values were observed in stage IB (8.7±6.0), IIA (7.9±6.0, IIB (11.6±7.8) and IIIA (7.1±5.3). Figure 4 shows the SUVmax obtained in each pathological tumor stage. No differences were observed between negative nodal diseases (stage IB SUVmax 8.7±6 and positive nodal involvement stage IIA SUVmax 7.9±6.0; P=0.160).
Figure 4.
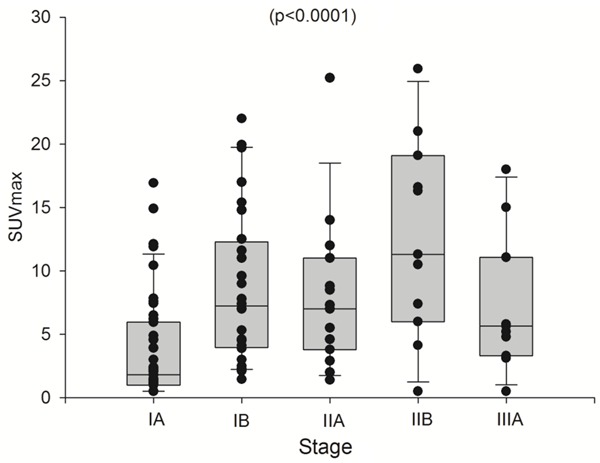
Statistically significant differences in SUVmax were observed between the different TNM stages (3.4±4.1 for stage IA, 8.7±6.0 for stage IB, 7.9±6.0 for stage IIA, 11.6±7.8 for stage IIB and 7.1±5.3 for stage IIIA).
Association between SUVmax and gene mutation
None gene mutation was detected in 67 patients (wild-type group) but 24 patients had EGFR and 15 K-RAS mutations. Only 5 patients had rearrangement of ALK. One sample from one patient was not available for this study. Due to this distribution we considered only patients from the wild type group, EGFR and K-RAS mutations for statistical purposes. Significant differences (P<0.01) in SUVmax were obtained between EGFR (3.7±4.2), K-RAS (4.3±3.8) mutations and wild-type group (8.0±6.7) (Figure 5). Low SUVmax values were observed in EGFR mutation. The biological significance of this observation is still unknown.
Figure 5.
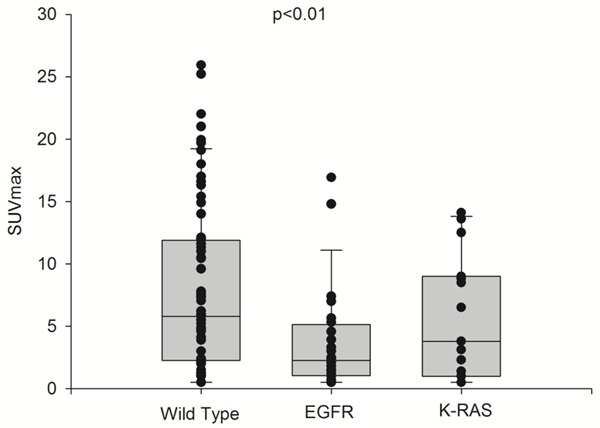
Statistically significant difference in SUVmax values between EGFR mutation (3.7±4.2), K-RAS mutation (4.3±3.8) and wild-type (8.0±6.7).
Association between SUVmax, histological grade and prognosis
As shown in Figure 5, DFS (P=0.02) and OS (P=0.06) at 4 years were 33% and 77%, respectively, in patients with histologic high grade, 57% and 64% in patients with histologic intermediate grade (histological grades with higher SUVmax), and 80% and 87% in patients with histologic low grade (histological grade with lower SUVmax) (Figure 6). OS at 4 years was 100% deaths in MPA, 34% in solid subtype, and 15% in mucinous subtype.
Figure 6.
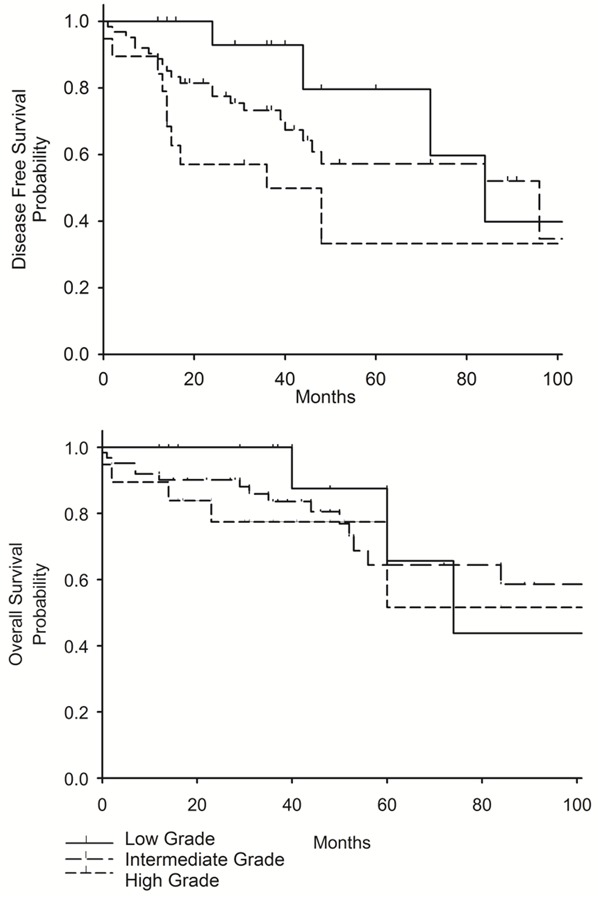
Kaplan-Meier curves showing significantly better disease free survival (DFS) (P=0,02) and overall survival (OS) (P=0,06) at 4 years for in patients with low histologic grade tumors as compared to patients with intermediate and high grade suptypes.
Discussion
In the present study we investigated the correlation between SUVmax and the histological subtype of LA, both with the predominant histological pattern and the accompanied pattern.
A positive correlation between glucose metabolism of tumor cells assessed by 18F-FDG PET and the histological subtype of LA was found. Similar data have been recently reported by other authors [21-24]. Low mean SUVmax values were observed in AIS, MIA, LPA and IMA whereas high SUVmax values in APA, PPA and MPA were documented. The highest mean SUVmax was obtained in patients with the SPA subtype. Accordingly, low glucose uptake was associated to low grade histological profiles except in the case of IMA where a low SUV value was obtained despite a high grade profile (Figure 7). Mucinous adenocarcinomas have low cellular density and abundant mucin inside of them [29]. In this particular subtype, low 18F-FDG uptake is expected and SUVmax is reduced. Our results are similar to those reported by Nakamura et al. [21] except for IMA where a higher SUVmax value was obtained.
Figure 7.
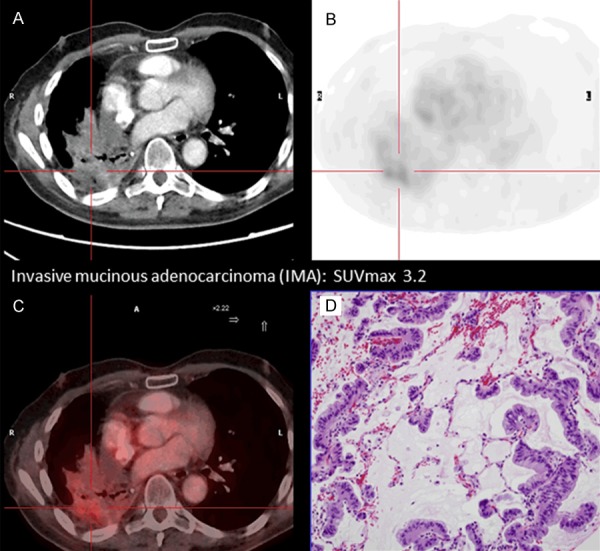
The figure presents an example of invasive mucinous adenocarcinoma (IMA) subtype. This subtype shows low FDG uptake, despite a high grade profile and a bad prognosis: CT images (A), PET images, SUVmax 3.2 (B), PET-CT fusion images (C) and histological sample (D) in which low cellularity and mucin inside can be observed.
Our findings showed different glucose consumption (SUVmax) in different histologic grades [21-23]. Histology and SUVmax correlation was affected by the prevalence of acinar pattern in this sample and the reduced number of cases for some specific subtypes, such as MPA (5 cases).
As a consequence, we classified our cases in 3 main groups following prognostic histologic criteria [27,28]. AIS+MIA+LPA were included in the low grade group, APA+PPA in the intermediate grade group, and SPA+MPA+IMA in the high grade group. It was found that low SUVmax was clearly associated with the low grade histological group. Interestingly, similar mean SUVmax were observed in both intermediate and high grade groups. However, it should be noted that data in the high grade group were different in SPA+MPA and IMA. All these histological grade profiles are included in the same group and the resulting mean value is the average between a high SUVmax values in SPA+MPA and a low SUVmax in IMA (Figure 2A). Inclusion of IMA in the high grade group caused that the differences in the glucose uptake between the intermediate and high grade were not different. Differences between intermediate and high grade tumors were observed in two previous studies [23,24]. However, in these two studies IMA tumors were excluded from the analysis. It is important to notice that SUVmax values can be similar between different grades. For example the SUVmax of LPA (low grade), PPA (intermediate grade) and MPA (high grade) are almost the same. As it was discussed above SUVmax is gradual between grades but PET-FDG can also be considered a complementary tool to differentiate histological subtypes such as SPA and IMA within the same grade.
As shown by other authors [21-24] we also found significant differences in SUVmax values and in the DFS and OS among the three groups (Figure 6). These results support that different LA subtypes and different histologic tumor grade have different glucose consumptions.
It is important to remark that a high histological variability in the accompanied pattern is often observed in the acinar subtype. Acinar subtype in our population was the most common and accounted for more than 50% of the cases. Taking into account this variability we decided to analyze the possible influence of the second accompanied pattern on SUVmax. A higher SUVmax was observed in tumors with a second histological pattern of intermediate or high grade compared to those that were accompanied by a second lower grade subtype. This observation suggests that the SUVmax is not only the consequence of the predominant pattern but also the accompanied pattern can also determine the SUVmax value. The clinical significance of this finding is unknown. Kadota el al. [23] reported similar results in a subanalysis of 18 patients with intermediate tumor grade who had higher SUVmax than the remaing patients. They found that this second pattern had a high-grade histology or high mitotic count. Accordingly, it may speculate that this second pattern with worse prognostic indicators may be useful to guide the management of these tumors.
Significant differences between stage according to TNM and SUVmax were observed. SUVmax values increased mainly in the initial states IA (SUVmax 3.4±4.0) and IB (SUVmax 8.6±6.0). These results are consistent with those reported by Cerfolio et al. [22], which showed a SUVmax increase related to the T status increase in patients who were node negative. Two main factors could justify the correlation between glucose uptake and both stages: the tumor size (Figure 3B) and the predominant histological subtype. The mean size of IA tumors was 16 mm (stage IA <20 mm), and 29 mm in IB (stage IB 20-50 mm). Tumor size has been considered a critical factor that may affect SUVmax, especially in smaller lesions. The smaller lesions tended to have lower SUVmax than larger lesions of the same histologic subtype.
The predominant histologic subtype in stage IA was lepidic (61.5%), whereas in stage IB was solid (42%), and different SUVmax values may be expected in these two histological subtypes.
Some publications have reported a higher SUVmax of the primary tumor in cases with lymph node involvement than in those without nodal involvement but this is a controversial argument [30,31]. Muto el al. [31] obtained a different SUVmax in primary lung adenocarcinoma without/with nodal metastases (SUVmax 2.2 vs. 4.9, respectively). However, they did not found a correlation between SUVmax values obtained in N1 versus N2 involvement. They concluded that SUVmax is useful in predicting LN involvement but would not be useful in predicting the extent of disease. Other authors reported a trend of steady increase in SUVmax of primary NSCLC in N0 vs. N1 as well as in N0 vs. N2 [32].
In our study, there were 14 patients with N1 involvement and 9 with N2 involvement. With this limited amount of n values we could not establish a correlation between primary tumor SUVmax and nodal involvement or nodal extension. The majority of patients included in our study had negative preoperative results in the clinical staging process or at maximum N1 involvement. Pathological study of resected lymph nodes showed a reduced number of tumor cells that were probably difficult to detect using PET. Muto et al. [31] proposed to omit lymph node dissection in cases where SUVmax of primary NSCLC was less than 1. In our series we reported a patient with SUVmax 0.5 and N2 involvement. However, in the remaining patients with nodal involvement, the SUVmax of the primary lesion was higher than 1.4.
Higher SUVmax in the primary lesion was associated with worse outcome. There was a significant positive correlation between SUVmax and DFS in the three groups with different histologic prognosis (low, intermediate and high grade). DFS was significantly longer in the low histological grade group as compared with intermediate or high histological grades. Also, OS was less favourable in patients with SUVmax >7. This might be a consequence of the worse histological subtype, higher tumor size and higher stage among in patients with higher SUVmax values.
Conclusion
Lung adenocarcinoma represents a heterogeneous disease with different metabolic profiles and different behaviours in the different subtypes. Quantitative analysis by SUVmax 18F-FDG PET offers an approach of the glucose consumption in the primary lesion, providing information with prognostic value that improves the treatment planning in each particular LA case.
Consequently the quantitative analysis of glucose consumption by tumor cell, measured by SUVmax, can be a criterion to be considered in the presurgical evaluation of these patients. Maybe metabolic profile of tumor cells should be incorporated into future LA staging together with other criteria.
Acknowledgements
We thank Marta Pulido, MD, for editing the manuscript.
Disclosure of conflict of interest
None.
References
- 1.Edge SB, Byrd DR, Compton CC, Fritz AG, Greene F, Trotti A, editors. AJCC Cancer Staging Manual and Handbook. 7th edition. New York: Springer; 2009. pp. 253–270. [Google Scholar]
- 2.Graziano SL. Non-small cell lung cancer. Lung Cancer. 1997;17:37–58. doi: 10.1016/s0169-5002(97)00639-9. [DOI] [PubMed] [Google Scholar]
- 3.Taus A, Aguiló R, Curull V, Suárez-Piñera M, Rodríguez-Fuster A, Rodriguez de Dios N, Zuccarino F, Vollmer I, Sánchez-Font A, Belda-Sanchis J, Arriola E. Impact of 18F-FDG PET/CT in the treatment of patients with non-small cell lung cancer. Arch Bronconeumol. 2014;50:99–104. doi: 10.1016/j.arbres.2013.09.017. [DOI] [PubMed] [Google Scholar]
- 4.Maeda R, Isowa N, Onuma H, Miura H, Harada T, Touge H, Tokuyasu H, Kawaski Y. The maximum standardized 18F-fluorodeoxyglucose uptake on positron emission tomography predicts lymph node metastasis and invasiveness in clinical stage IA non-small cell lung cancer. Interact Cardiovasc Thorac Surg. 2009;9:79–82. doi: 10.1510/icvts.2008.201251. [DOI] [PubMed] [Google Scholar]
- 5.van Tinteren H, Hoekstra OS, Smit EF, van den Bergh JH, Schreurs AJ, Stallaert RA, van Velthoven PC, Comans EF, Diepenhorst FW, Verboom P, van Mourik JC, Postmus PE, Boers M, Teule GJ. Effectiveness of positron emission tomography in the preoperative assessment of patients with suspected non-small-cell lung cancer: the PLUS multicentre randomised trial. Lancet. 2002;359:1388–1393. doi: 10.1016/s0140-6736(02)08352-6. [DOI] [PubMed] [Google Scholar]
- 6.Pak K, Park S, Cheon GJ, Kang KW, Kim IJ, Lee DS, Kim EE, Chung JK. Update on nodal staging in non-small cell lung cancer with integrated positron emission tomography/computed tomography: a meta-analysis. Ann Nucl Med. 2015;29:409–19. doi: 10.1007/s12149-015-0958-6. [DOI] [PubMed] [Google Scholar]
- 7.Warburg O. On the origin of cancer cells. Science. 1956;123:309–314. doi: 10.1126/science.123.3191.309. [DOI] [PubMed] [Google Scholar]
- 8.Warburg O. On respiratory impairment in cancer cells. Science. 1956;124:269–270. [PubMed] [Google Scholar]
- 9.Higashi K, Ueda Y, Sakurai A, Mingwang X, Xu L, Murakami M, Seki H, Oguchi M, Taki S, Nambu Y, Tonami H, Katsuda S, Yamamoto I. Correlation of Glut-1 glucose transporter expression with (18)F-FDG uptake in non-small cell lung cancer. Eur J Nucl Med. 2000;27:1778–1785. doi: 10.1007/s002590000367. [DOI] [PubMed] [Google Scholar]
- 10.Vesselle H, Schmidt RA, Pugsley JM, Li M, Kohlmyer SG, Vallires E, Wood DE. Lung cancer proliferation correlates with [F-18] fluorodeoxyglucose uptake by positron emission tomography. Clin Cancer Res. 2000;6:3837–3844. [PubMed] [Google Scholar]
- 11.Lee EY, Khon PL, Lee VH. Metabolic phenotype of stage IV lung adenocarcinoma: relationship with epidermal growth factor receptor mutation. Clin Nucl Med. 2015;40:190–195. doi: 10.1097/RLU.0000000000000684. [DOI] [PubMed] [Google Scholar]
- 12.Nair VS, Keu KV, Luttgen MS, Kolatkar A, Vasanawala M, Kuschner W, Bethel K, Iagaru AH, Hoh C, Shrager JB, Loo BW Jr, Bazhenova L, Nieva J, Gambhir SS, Kuhn P. An observational study of circulating tumor cells and 18F-FDG PET uptake in patients with treatment-naive non-small cell lung cancer. PLoS One. 2013;8:e67733. doi: 10.1371/journal.pone.0067733. [DOI] [PMC free article] [PubMed] [Google Scholar]
- 13.van Baardwijk A, Dooms C, van Suylen RJ, Verbeken E, Hochstenbag M, Dehing-Oberije C, Rupa D, Pastorekova S, Stroobants S, Buell U, Lambin P, Vansteenkiste J, De Ruysscher D. The maximum uptake of (18)F-deoxyglucose on positron emission tomography scan correlates with survival, hypoxia inducible factor-1alpha and GLUT-1 in non-small cell lung cancer. Eur J Cancer. 2007;43:1392–1398. doi: 10.1016/j.ejca.2007.03.027. [DOI] [PubMed] [Google Scholar]
- 14.Kim DH, Jung JH, Son SH, Kim CY, Hong CM, Oh JR, Jeong SY, Lee SW, Lee J, Ahn BC. Prognostic significance of intraumoral metabolic hetereogeneity on 18 F-FDG PET/CT in pathological N0 non-small cell lung cancer. Clin Nucl Med. 2015;40:708–714. doi: 10.1097/RLU.0000000000000867. [DOI] [PubMed] [Google Scholar]
- 15.Berghmans T, Dusart M, Paesmans M, Hossein-Foucher C, Buvat I, Castaigne C, Scherpereel A, Mascaux C, Moreau M, Roelandts M, Alard S, Meert AP, Patz EF Jr, Lafitte JJ, Sculier JP. Primary tumor standardized uptake value (SUVmax) measured on fluorodeoxyglucose positron emission tomography (FDG-PET) is of prognostic value for survival in non-small cell lung cancer (NSCLC): a systematic review and meta-analysis (MA) by the European lung cancer working party for the IASLC lung cancer staging project. J Thorac Oncol. 2008;3:6–12. doi: 10.1097/JTO.0b013e31815e6d6b. [DOI] [PubMed] [Google Scholar]
- 16.Wang D, Zhang M, Gao X. Prognostic value of baseline 18F-FDG PET/CT functional parameters in patients with advanced lung adenocarcinoma stratified by EGFR mutation status. PLoS One. 2016;11:e0158307. doi: 10.1371/journal.pone.0158307. [DOI] [PMC free article] [PubMed] [Google Scholar]
- 17.Chen F, Yao Y, Ma C, Ma X, Wang Z, Lv T, Xiao X, Yin J, Song Y. Ratio of maximum standardized uptake value to primary tumor size is a prognostic factor in patients with advanced non-small cell lung cancer. Transl Lung Cancer Res. 2015;4:18–26. doi: 10.3978/j.issn.2218-6751.2014.11.02. [DOI] [PMC free article] [PubMed] [Google Scholar]
- 18.Kim MH, Lee JS, Mok JH, Lee K, Kim KU, Park KH, Kim SJ, Lee MK. Metabolic burden measured by 18F-Fluorodeoxyglucose positron emission to mography/computed tomography is a prognostic factor in patients with small cell lung cancer. Cancer Res Treat. 2014;42:165–171. doi: 10.4143/crt.2014.46.2.165. [DOI] [PMC free article] [PubMed] [Google Scholar]
- 19.Travis WD, Brambilla E, Noguchi M, Nicholson AG, Geisinger KR, Yatabe Y, Powell CA, Beer D, Riely G, Garg K, Austin JH, Rusch VW, Hirsch FR, Jett J, Yang PC, Gould M American Thoracic Society. International association for the study of lung cancer/American thoracic society/European respiratory society international multidisciplinary classification of lung adenocarcinoma. J Thorac Oncol. 2011;6:244–285. doi: 10.1097/JTO.0b013e318206a221. [DOI] [PMC free article] [PubMed] [Google Scholar]
- 20.Travis WD, Brambilla E, Noguchi M, Nicholson AG, Geisinger K, Yatabe Y, Powell CA, Beer D, Riely G, Garg K, Austin JH, Rusch VW, Hirsch FR, Jett J, Yang PC, Gould M American Thoracic Society. International association for the study of lung cancer/American thoracic society/European respiratory society: international multidisciplinary classification of lung adenocarcinoma: executive summary. Proc Am Thorac Soc. 2011;8:381–385. doi: 10.1513/pats.201107-042ST. [DOI] [PubMed] [Google Scholar]
- 21.Nakamura H, Saji H, Shinmyo T, Tagaya R, Kurimoto N, Koizumi H, Takagi M. Close association of IASLC/ATS/ERS lung adenocarcinoma subtypes with glucose-uptake in positron emission tomography. Lung Cancer. 2015;87:28–33. doi: 10.1016/j.lungcan.2014.11.010. [DOI] [PubMed] [Google Scholar]
- 22.Cerfolio RJ, Bryant AS, Ohja B, Bartolucci AA. The maximum standardized uptake values on positron emission tomography of a non-small cell lung cancer predict stage, recurrence, and survival. J Thorac Cardiovasc Surg. 2005;130:151–159. doi: 10.1016/j.jtcvs.2004.11.007. [DOI] [PubMed] [Google Scholar]
- 23.Kadota K, Colovos C, Suzuki K, Rizk NP, Dunphy MS, Zabor EC, Sima CS, Yoshizawa A, Travis WD, Rusch VW, Adusumilli PS. FDG-PET SUVmax combined with IASLC/ATS/ERS histologic classification improves the prognostic stratification of patients with stage I lung adenocarcinoma. Ann Sur Oncol. 2012;19:3598–3605. doi: 10.1245/s10434-012-2414-3. [DOI] [PMC free article] [PubMed] [Google Scholar]
- 24.Chiu CH, Yeh YC, Lin KH, Wu YC, Lee YC, Chou TY, Tsai CM. Histological subtypes of lung adenocarcinoma have differential 18F-fluorodeoxyglucose uptakes on the positron emission tomography/computed tomography scan. J Thorac Oncol. 2011;6:1697–1703. doi: 10.1097/JTO.0b013e318226b677. [DOI] [PubMed] [Google Scholar]
- 25.Takahashi Y, Takashima S, Watanabe S, Tomita Y, Hakucho T, Miyake C, Morimoto D, Hosoki T, Nakanishi K, Higashiyama M. F18-FDG PET-CT analyses of small peripheral adenocarcinoma of the lung. Acta Radiol. 2013;54:164–168. doi: 10.1258/ar.2012.120138. [DOI] [PubMed] [Google Scholar]
- 26.Steiger S, Arvanitakis M, Sick B, Weder W, Hillinger S, Burger IA. Analysis of prognostic value of various PET metrics in preoperative FDG PET for early stage bronchial carcinoma for progression free and overall survival: significantly increased glycolysis is a predictive value. J Nucl Med. 2017;58:1925–1930. doi: 10.2967/jnumed.117.189894. [DOI] [PubMed] [Google Scholar]
- 27.Yoshizawa A, Motoi N, Riely GJ, Sima CS, Gerald WL, Kris MG, Park BJ, Rusch VW, Travis WD. Impact of proposed IASLC/ATS/ERS classification of lung adenocarcinoma: prognostic subgroups and implications for further revision of staging based on analysis of 514 stage I cases. Mod Pathol. 2011;24:653–664. doi: 10.1038/modpathol.2010.232. [DOI] [PubMed] [Google Scholar]
- 28.Sica G, Yoshizawa A, Sima CS, Azzoli CG, Downey RJ, Rusch VW, Travis WD, Moreira AL. A grading system of lung adenocarcinomas based on histologic pattern is predictive of disease recurrence in stage I tumors. Am J Surg Pathol. 2010;34:1155–1162. doi: 10.1097/PAS.0b013e3181e4ee32. [DOI] [PubMed] [Google Scholar]
- 29.Berger KL, Nicholson SA, Dehdashti F, Siegel BA. FDG PET evaluation of mucinous neoplasms correlation of FDG uptake with histopathologic features. AJR. 2000;174:1005–1008. doi: 10.2214/ajr.174.4.1741005. [DOI] [PubMed] [Google Scholar]
- 30.Wang Y, Ma S, Dong M, Yao Y, Liu K, Zhou J. Evaluation of the factors affecting the maximum standardized uptake value of metastatic lymph nodes in different histological types of non-small cell lung cancer on PET-CT. BMC Pulm Med. 2015;15:20. doi: 10.1186/s12890-015-0014-2. [DOI] [PMC free article] [PubMed] [Google Scholar]
- 31.Muto J, Hida Y, Kaga K, Ohtaka K, Okamoto S, Tamaki N, Nakada-Kubota R, Hirano S, Matsui Y. Use of maximum standardized uptake value on fluorodeoxyglucose positron-emission tomography in predicting lymph node involvement in patients with primary non-small lung cancer. Anticancer Res. 2014;34:805–810. [PubMed] [Google Scholar]
- 32.Al-Sarraf N, Gately K, Lucey J, Aziz R, Doddakula K, Wilson L, McGovern E, Young V. Clinical implication and prognostic significance of standardised uptake value of primary non-small cell lung cancer on positron emission tomography: analysis of 176 cases. Eur J Cardiothorac Surg. 2008;34:892–897. doi: 10.1016/j.ejcts.2008.07.023. [DOI] [PubMed] [Google Scholar]


