Abstract
16α-[18F]Fluoro-17β-estradiol ([18F]FES) and 21-[18F]-Fluoro-16α,17α-[(R)-(1’-α-furylmethylidene)dioxyl]-19-norpregn-4-ene-3,20-dione ([18F]FFNP) are being investigated as imaging biomarkers for breast cancer patients. Quantitative positron emission tomography (PET) reflects both total receptor content and binding affinity. To study factors that may alter radiopharmaceutical binding and impact PET accuracy, assays that can separate receptor amount from binding affinity are needed. The study purpose was to quantify the binding parameters of [18F]FES and [18F]FFNP in breast cancer. Estrogen receptor-alpha (ER) and progesterone receptor (PR) positive breast cancer cell lines (MCF-7 and T47D) were used to measure [18F]FES and [18F]FFNP binding parameters via saturation and competitive binding curves. The equilibrium dissociation constant (Kd) and total receptor density (Bmax) were determined using nonlinear regression of the saturation binding curves. Half-maximal inhibitory concentration (IC50) was determined using nonlinear regression of the competitive binding curves. Linear correlation between increasing cell number and tracer uptake was observed for both [18F]FES and [18F]FFNP (R2=0.99 and 0.91, respectively). Using [18F]FES, the Kd for ER in MCF-7 cells was 0.13±0.02 nM with a Bmax of 1901±89.3 fmol/mg protein and IC50 of 0.085 nM (95% CI: 0.069-0.104 nM). Using [18F]FFNP, the Kd for PR in T47D cells was 0.41±0.05 nM with a Bmax of 1984±75.6 fmol/mg protein and IC50 of 2.6 nM (95% CI: 2.0-3.4 nM). The ligand binding function of ER and PR can be quantified using [18F]FES and [18F]FFNP and are comparable to previous studies using tritiated radioligands. [18F]FES and [18F]FFNP can be used in cell-based assays to quantify receptor-radioligand binding affinity, which cannot be obtained from a single PET examination.
Keywords: Estrogen receptor, progesterone receptor, breast cancer, [18F]FES, [18F]FFNP, radioligand binding affinity, equilibrium dissociation constant, Kd
Introduction
Advances in early detection and treatment of breast cancer have led to a steady decrease in mortality, however recurrent and metastatic disease continues to be problematic [1]. The majority of deaths due to breast cancer occur in women with estrogen receptor alpha-positive (ER) disease. Endocrine-based therapies are aimed at directly antagonizing ER function or reducing endogenous estradiol levels. Due to the well-recognized diversity and complexity of ER signaling mechanisms, it is inevitable that some patients will have disease that has circumvented the standard methods for blocking ER function and have become endocrine insensitive [2]. This important shift in receptor functionality cannot be directly measured by current clinical diagnostic approaches.
Functional imaging provides a useful tool for detecting biomarkers with predictive power for therapy response [3]. 16α-[18F]Fluoro-17β-estradiol ([18F]FES) is a radiolabeled estrogen that binds to ER [4,5]. A recent study showed that [18F]FES binds specifically to the ligand binding domain of ER [6]. Positron emission tomography (PET) imaging coupled with [18F]FES has been studied in patients with ER+ metastatic breast cancer and may be useful for predicting clinical benefit from endocrine therapy [7,8].
Another biomarker for endocrine sensitivity is the classic estrogen-regulated target gene progesterone receptor (PR) [9,10]. A radiolabeled progestin, 21-[18F]-fluoro-16α,17α-[(R)-(1’-α-furylmethylidene)dioxyl]-19-norpregn-4-ene-3,20-dione ([18F]FFNP), has been developed to image PR [11,12]. Preclinical data indicate that [18F]FFNP PET imaging can quantify changes in PR expression and distinguish endocrine-sensitive from endocrine-resistant mouse mammary carcinomas [13,14]. A small “first-in-human” feasibility study demonstrated that [18F]FFNP PET imaging of breast cancer patients is safe and can identify PR+ tumors as defined by standard immunohistochemistry [15].
Coupling these investigational radiopharmaceuticals with PET imaging is proving to be useful in the clinical setting [16,17]. In vivo steroid hormone receptor quantification via a standardized uptake value reflects a combination of the amount of receptor protein and the binding affinity of the receptor for the imaging agent (i.e. binding potential), as well as pharmacokinetic variables such as plasma protein binding and metabolism of the tracer [18]. To study mechanistic factors that may alter binding of these radiopharmaceuticals and impact the diagnostic accuracy of PET imaging, assays that can separate receptor amount from binding affinity are needed. The purpose of this study was to establish cell-based assays to quantify the radioligand binding parameters of [18F]FES and [18F]FFNP for investigating the ligand binding function of steroid hormone receptors in breast cancer.
Materials and methods
Cell culture
Experiments were performed under a protocol approved by the Office of Biological Safety. ER+ MCF-7 cells were obtained from the Mallinckrodt Institute of Radiology Pre-Clinical PET/CT Imaging Facility (Washington University School of Medicine). PR+ T47D cells were obtained from the American Type Culture Collection. Authentication was performed using short tandem repeat analysis. MCF-7 and T47D cells were cultured in Dulbecco’s Modified Eagle medium (DMEM; Corning) and Roswell Park Memorial Institute (RPMI; Corning), respectively. Media was supplemented with 10% fetal bovine serum (FBS; Corning) and 1% penicillin/streptomycin (Gibco). Cells were maintained at 37°C with either 5% or 10% CO2.
Radiopharmaceuticals
[18F]FES and [18F]FFNP were synthesized by the UW-Madison Radiopharmaceutical Production Facility using modifications of previously described methods [14,19]. Briefly, [18F]FES was synthesized by adding 1 mg FES precursor, 3-methoxymethyl-16beta,17beta-epiestriol-O-cyclic sulfone (ABX Advanced Biochemical Compounds) in 0.3 mL anhydrous acetonitrile into a vial containing dried mixture of [18F]fluoride ion, 5 mg Kryptofix® 2.2.2 and 1 mg K2CO3. Radiolabeling was performed at 110°C for 10 min. Hydrolysis using 0.1 mL of 1 N HCl and 0.9 mL acetonitrile was conducted at 100°C for 15 min. After neutralization with 0.1 mL of 1 N NaOH and 1 mL 1 N sodium acetate, the crude product was purified with HPLC (high-performance liquid chromatography) with a Luna C18(2) 10 × 250 mm (5 µm) column (Mobile phase: aqueous 50% ethanol solution).
[18F]FFNP was synthesized by adding 4 mg FFNP precursor, 16α,17α-[(R)-(1’-α-furyl methylidene)dioxyl]-21-[[(methyl)sulfonyl]oxyl]-19-norpregn-4-ene-3,20-dione (ABX Advanced Biochemical Compounds), in 0.6 mL anhydrous acetonitrile into the vial containing dried mixture of [18F]fluoride ion, 2 mg Kryptofix® 2.2.2 and 0.4 mg K2CO3. Radiolabeling was performed at 85°C for 5 min. After mixing with a pre-cooled (5°C) solution of 1 mL acetonitrile and 2 mL H2O, the crude product was purified with HPLC with a Luna C18(2) 10 X 250 mm (5 µm) column (Mobile phase : aqueous 60% acetonitrile solution).
For both tracers, the HPLC collection was purified with a C18 cartridge to remove trace amount of organic solvents. The purified products were formulated in 0.9% sodium chloride injection containing 10% ethanol injection and sterilized with a sterile, pyrogen-free sterile membrane filter into a 30 mL sterile empty vial.
For [18F]FES, the radiochemical purity of final product at end of synthesis is >99% and the specific activity exceeded 55.3 GBq/µmol (1495 mCi/µmol). [18F]FES is stable for 6 hours at the drug strength no more than 14.6 mCi/mL and the radiochemical purity at 6 h post synthesis is >98%. For [18F]FFNP, the radiochemical purity of the final product at the end of synthesis is >99% with the specific activity exceeding 74 GBq/µmol (2000 mCi/µmol). [18F]FFNP is stable for 6 hours at the drug strength no more than 6 mCi/mL and the radiochemical purity at 6 h post synthesis is >97%. Chemical structures and representative HPLC chromatograms of [18F]FES and [18F]FFNP are shown in Figures 1 and 2, respectively.
Figure 1.
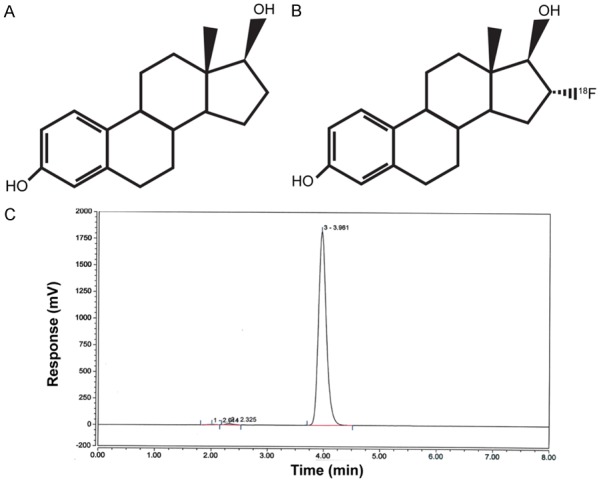
Chemical structures of 17β-estradiol (A) and [18F]FES (B). Representative HPLC chromatogram for [18F]FES (C).
Figure 2.
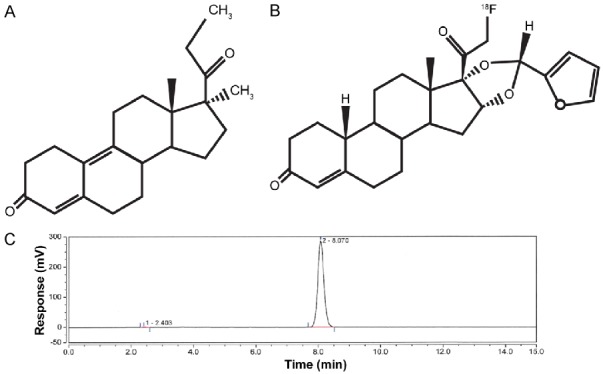
Chemical structures of promegestone (R5020) (A) and [18F]FFNP (B). Representative HPLC chromatogram for [18F]FFNP (C).
[18F]FES and [18F]FFNP binding assays
For linearity assays, cells were serially diluted 1:2 from 1.50 × 10⁵ to 4.688 × 10³ per well in a 24-well plate. After adhering overnight, cells were washed with phosphate-buffered saline (PBS) and phenol-free media containing 10% charcoal/dextran stripped FBS, 2% L-glutamine, and 1% penicillin/streptomycin (ss-media) was added to the cells for 24 h. MCF-7 and T47D cells were then incubated with either 0.037 MBq (1 μCi) [18F]FES or 0.074 MBq (2 μCi) [18F]FFNP, respectively, for 1 h at 37°C. After the 1 h incubation, cells were washed twice with 0.5 mL PBS. Cells were then lysed in 1 mL 1N NaOH and collected into gamma counter tubes. The wells were then washed twice with 0.5 mL PBS and each wash was added to the same tube as the cell lysate (2 mL final total volume). Radioactivity was measured with a gamma counter (2480 Wizard2, Perkin Elmer) and data was background- and decay-corrected.
For saturation binding assays, MCF-7 or T47D cells (1 × 10⁵) were plated in two 24-well plates. The next day, cells were washed with PBS and placed in ss-media. Immediately prior to tracer addition, one plate was treated with ethanol (EtOH) control and the other treated with either 1 × 10⁻⁸ M 17β-estradiol (E2; Sigma) or 2 × 10⁻⁷ M promegestone (R5020; Perkin Elmer), a synthetic progestin. Increasing concentrations of tracer, 0.002-0.22 MBq (0.06-6 μCi) [18F]FES or 0.004-0.42 MBq (0.11-11.4 μCi) [18F]FFNP, were then administered to the plates. After incubation for 1 h at 37°C, cells were harvested and radioactivity measured as above. A standard curve was prepared using the same tracer concentrations diluted in 2 mL PBS and radioactivity counted with the cell lysates. The tracer concentration (x-axis) was calculated from the specific activity (mCi/μmol) and administered dose (µCi). The receptor amount (y-axis) was calculated from the standard curve and normalized to total protein per well (fmol receptor/mg protein). Total protein was measured using Bradford dye reagent (Bio-Rad). The equilibrium dissociation constant (Kd) and total receptor density (Bmax) were determined using nonlinear regression (binding one site-total and nonspecific binding) with GraphPad Prism 6.05 software.
For competitive binding assays, cells were plated at a density of 1 × 10⁵ per well in 24-well plates. The next day, cells were washed with PBS and placed in ss-media. Immediately prior to tracer addition, cells were treated with either EtOH or increasing amounts of cold hormone. For the [18F]FES competitive binding assay, MCF-7 cells were treated with 1 × 10⁻⁸ to 1 × 10-13 M E2. For the [18F]FFNP competitive binding assay, T47D cells were treated with 1 × 10⁻⁷ to 1 × 10-12 M R5020. MCF-7 cells were then incubated with 0.037 MBq (1 μCi) [18F]FES and T47D cells with 0.074 MBq (2 μCi) [18F]FFNP for 1 h at 37°C. Cells were harvested and radioactivity measured as above. Data is shown as percent maximum uptake values (samples containing tracer with no cold hormone added =100%). Half-maximal inhibitory concentration (IC50) was determined using nonlinear regression (dose response-inhibition) with GraphPad Prism.
Results
Using ER+ MCF-7 and PR+ T47D breast cancer cell lines, we found good linear correlation between increasing cell number and tracer uptake for both [18F]FES and [18F]FFNP (R2=0.99 and 0.91, respectively; Figure 3). The minimum number of cells used in the linearity assays (~4,700) showed detectable tracer uptake above background (mean ± standard error background-corrected CPM 4,438±392 for [18F]FES and 29,759±2,686 for [18F]FFNP).
Figure 3.
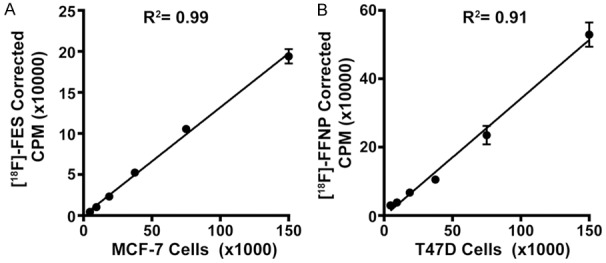
[18F]FES and [18F]FFNP uptake correlates with increasing cell number. Steroid hormone deprived ER+ MCF-7 (A) and PR+ T47D (B) cells were seeded with increasing cell numbers in 24-well plates and treated with 0.037 MBq (1 μCi) [18F]FES or 0.074 MBq (2 μCi) [18F]FFNP for 1 h, respectively. Counts per minute (CPM) were background- and decay-corrected. Data shown (mean±standard error) are representative from three independent experiments performed in triplicate.
The quantitative binding parameters of [18F]FES and [18F]FFNP (Kd, Bmax, and IC50) determined by saturation (Figure 4) and competitive binding curves (Figure 5) are summarized in Table 1. The Kd value determined using [18F]FES in MCF-7 cells was 0.13 nM, which is within the range of equilibrium dissociation constants reported using [3H]estradiol (0.06 to 0.226 nM) [20-22]. The Bmax value determined using [18F]FES was 1,901 fmol/mg protein, which also falls within the wide range of ER protein content in MCF-7 cells (100 to 10,000 fmol/mg protein) measured by [3H]estradiol or Western blot analysis [20,23-25]. Prior studies using [3H]R5020 have reported equilibrium dissociation constants for PR ranging from 0.40 to 3.57 nM [26-29], which is similar to the Kd of 0.41 nM using [18F]FFNP. The Bmax of PR in T47D cells was 1,984 fmol/mg protein using [18F]FFNP, which is slightly higher than published PR concentrations ranging from 254 to 1,221 fmol/mg protein using [3H]R5020 [28,30]. IC50 values determined by competing [18F]FES binding to ER with cold E2 corresponded closer to its equilibrium dissociation constant than the IC50 values determined by competing [18F]FFNP binding to PR with cold R5020.
Figure 4.
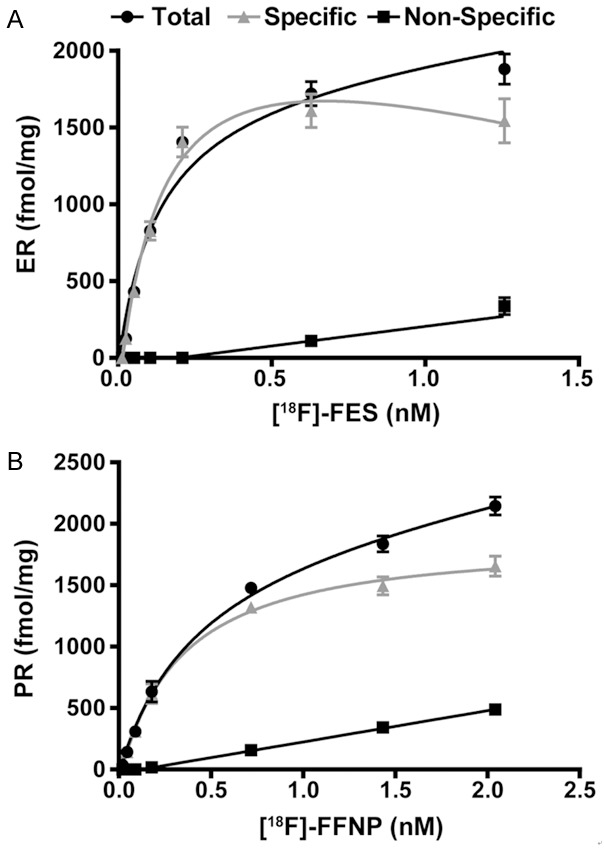
Saturation binding curves yield Kd and Bmax for [18F]FES and [18F]FFNP. Steroid hormone deprived ER+ MCF-7 (A) and PR+ T47D (B) cells were seeded in identical 24-well plates treated with 0.002-0.22 MBq (0.06-6 μCi) [18F]FES and 0.004-0.42 MBq (0.11-11.4 μCi) [18F]FFNP for 1 h, respectively. Total binding, non-specific, and specific binding (total binding minus non-specific binding) are shown. Values represent the mean ± standard error of three independent experiments performed in triplicate.
Figure 5.
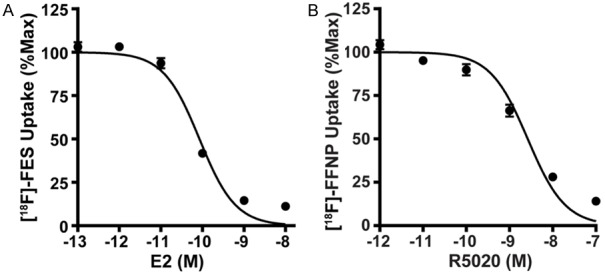
Competitive binding curves yield IC50 values. Steroid hormone deprived ER+ MCF-7 (A) and PR+ T47D (B) cells were treated with either cold E2 (10-8-10-13 M) or cold R5020 (10-7-10-12 M) just prior to the addition of 0.037 MBq (1 μCi) [18F]FES or 0.074 MBq (2 μCi) [18F]FFNP, respectively. Percent maximum uptake value was calculated by normalizing background- and decay-corrected counts per minute to wells containing [18F]FES or [18F]FFNP with no cold hormone. Values represent the mean±standard error of three independent experiments performed in triplicate.
Table 1.
Binding Parameters of [18F]FES and [18F]FFNP
| Cell Line/Tracer | Kd (nM) | 95% CI (nM) | Bmax (fmol/mg) | 95% CI (fmol/mg) | R2 | IC50 (nM) | 95% CI (nM) | R2 |
|---|---|---|---|---|---|---|---|---|
| MCF-7 [18F]FES | 0.13±0.02 | 0.09-0.17 | 1901±89.3 | 1723-2079 | 0.93 | 0.085 | 0.069-0.104 | 0.96 |
| T47D [18F]FFNP | 0.41±0.05 | 0.31-0.50 | 1984±75.6 | 1833-2134 | 0.98 | 2.645 | 2.037-3.436 | 0.92 |
Discussion
[18F]FES and [18F]FFNP are being investigated as predictive and pharmacodynamic biomarkers for response to endocrine therapy in breast cancer patients using PET imaging [7]. Standardized uptake values (SUV) obtained from attenuation-corrected PET images reflect both total receptor content (Bmax) and binding affinity (1/Kd) [18]. To study mechanistic factors that may alter binding of these radiopharmaceuticals and impact the quantitative accuracy of PET imaging, assays that can separate receptor amount from binding affinity are needed. The goal of this study was to establish cell-based assays using [18F]FES and [18F]FFNP for quantifying the ligand binding function of ER and PR. Using saturation and competitive binding assays, we measured Kd and Bmax as well as the IC50 values of representative ligand agonists (17β-estradiol and the synthetic progestin, R5020). The ligand binding functions of ER and PR quantified using [18F]FES and [18F]FFNP were generally comparable to historical studies using tritiated steroid hormones.
These results indicate that [18F]-labeled steroid hormone radioligands can be used in cell-based assays to quantify receptor-radioligand binding affinity, which cannot be obtained from a single PET imaging examination. As proof-of-principle, the investigation focused on the most widely used and well-characterized steroid hormone receptor positive human breast cancer cell lines, MCF-7 and T47D [31]. To the best of our knowledge, Kd values for [18F]FES and [18F]FFNP have not been previously reported. Prior investigations into the binding affinity of [18F]FES used ex vivo biochemical competitive radiometric binding assays with [3H]estradiol and purified receptor protein or homogenates of steroid hormone receptor rich tissue, such as rat uteri, to calculate relative binding affinity (RBA) [4,5]. Similarly for [18F]FFNP, previous reports used [3H]R5020 and purified PR protein or rat uterine homogenates to calculate RBA [27,32]. Our results advance the existing literature by providing specific measurements of binding affinity in the important context of intact, viable cells.
For comparison, the in vivo assessment of ER binding in MCF-7 xenograft tumors using [18F]FES PET imaging has been previously reported by our research group and others [6,33]. In the study by Salem et al, PET imaging performed 1 hour after injection of 9.25 MBq (250 µCi) [18F]FES demonstrated 3.0±0.41 percent mean injected dose per gram (%ID/g) and 7.2±0.60 tumor-to-muscle ratio in MCF-7 xenografts grown in female athymic nude mice [6]. Heidari et al performed PET imaging of MCF-7 tumor bearing nude mice approximately 1 hour after intravenous injection with 9.7 MBq (260 µCi) [18F]FES and found that the mean standardized uptake value (SUVmean) was 0.33±0.02 with a tumor-to-blood ratio of 4.17±0.41 [33]. To the best of our knowledge, no previous reports of the in vivo assessment of PR binding using [18F]FFNP in T47D xenograft tumors have been published.
There are several potential applications of this work. New radiopharmaceuticals continue to be developed for steroid hormone receptor imaging [27,34,35]. Comparison of the binding parameters of new radiotracers with [18F]FES and [18F]FFNP as reference standards may give insight into their potential for further clinical utility in patients. Also of interest is determining how recently identified somatic hot-spot mutations occurring in the ligand binding domain of ER in patients with endocrine-resistant metastatic breast cancer impact the binding affinity of [18F]FES [36]. Lastly, [18F]FES and [18F]FFNP binding assays can potentially be modified to a smaller scale to investigate receptor status and ligand binding function of ex vivo patient samples obtained from serial liquid biopsies such as pleural effusions, ascites, and circulating tumor cells when quantification via PET imaging may be challenging.
Acknowledgements
The authors thank the UW-Madison Cyclotron Laboratory for 18F production and the UWCCC Small Animal Imaging Facility for equipment and work space. We also thank the UW Translational Research Initiatives in Pathology laboratory, in part supported by the UW Department of Pathology and Laboratory Medicine and UWCCC grant P30 CA014520, for cell line authentication. This work was supported by the University of Wisconsin (UW) Paul P. Carbone Cancer Center Young Investigator Award and the UW Institute of Clinical and Translational Research KL2 Scholar Award (KL2TR000428) to A.M.F. Funding was also provided by the School of Medicine and Public Health and the Department of Radiology to A.M.F.
Disclosure of conflict of interest
None.
References
- 1.Jatoi I, Chen BE, Anderson WF, Rosenberg PS. Breast cancer mortality trends in the United States according to estrogen receptor status and age at diagnosis. J. Clin. Oncol. 2007;25:1683–1690. doi: 10.1200/JCO.2006.09.2106. [DOI] [PubMed] [Google Scholar]
- 2.Osborne CK, Schiff R. Mechanisms of endocrine resistance in breast cancer. Annu Rev Med. 2011;62:233–247. doi: 10.1146/annurev-med-070909-182917. [DOI] [PMC free article] [PubMed] [Google Scholar]
- 3.Mankoff DA, Pryma DA, Clark AS. Molecular imaging biomarkers for oncology clinical trials. J Nucl Med. 2014;55:525–528. doi: 10.2967/jnumed.113.126128. [DOI] [PubMed] [Google Scholar]
- 4.Kiesewetter DO, Kilbourn MR, Landvatter SW, Heiman DF, Katzenellenbogen JA, Welch MJ. Preparation of four fluorine- 18-labeled estrogens and their selective uptakes in target tissues of immature rats. J Nucl Med. 1984;25:1212–1221. [PubMed] [Google Scholar]
- 5.Yoo J, Dence CS, Sharp TL, Katzenellenbogen JA, Welch MJ. Synthesis of an estrogen receptor beta-selective radioligand: 5-[18F] fluoro-(2R,3S)-2,3-bis(4-hydroxyphenyl)pentanenitrile and comparison of in vivo distribution with 16alpha-[18F] fluoro-17beta-estradiol. J Med Chem. 2005;48:6366–6378. doi: 10.1021/jm050121f. [DOI] [PubMed] [Google Scholar]
- 6.Salem K, Kumar M, Powers GL, Jeffery JJ, Yan Y, Mahajan AM, Fowler AM. (18)F-16alpha-17beta-Fluoroestradiol binding specificity in estrogen receptor-positive breast cancer. Radiology. 2018;286:856–864. doi: 10.1148/radiol.2017162956. [DOI] [PMC free article] [PubMed] [Google Scholar]
- 7.Fowler AM, Clark AS, Katzenellenbogen JA, Linden HM, Dehdashti F. Imaging diagnostic and therapeutic targets: steroid receptors in breast cancer. J Nucl Med. 2016;57(Suppl 1):75s–80s. doi: 10.2967/jnumed.115.157933. [DOI] [PMC free article] [PubMed] [Google Scholar]
- 8.van Kruchten M, de Vries EG, Brown M, de Vries EF, Glaudemans AW, Dierckx RA, Schroder CP, Hospers GA. PET imaging of oestrogen receptors in patients with breast cancer. Lancet Oncol. 2013;14:e465–475. doi: 10.1016/S1470-2045(13)70292-4. [DOI] [PubMed] [Google Scholar]
- 9.Osborne CK, Yochmowitz MG, Knight WA 3rd, McGuire WL. The value of estrogen and progesterone receptors in the treatment of breast cancer. Cancer. 1980;46:2884–2888. doi: 10.1002/1097-0142(19801215)46:12+<2884::aid-cncr2820461429>3.0.co;2-u. [DOI] [PubMed] [Google Scholar]
- 10.Howell A, Harland RN, Barnes DM, Baildam AD, Wilkinson MJ, Hayward E, Swindell R, Sellwood RA. Endocrine therapy for advanced carcinoma of the breast: relationship between the effect of tamoxifen upon concentrations ofprogesterone receptor and subsequent response to treatment. Cancer Res. 1987;47:300–304. [PubMed] [Google Scholar]
- 11.Buckman BO, Bonasera TA, Kirschbaum KS, Welch MJ, Katzenellenbogen JA. Fluorine-18-labeled progestin 16 alpha, 17 alpha-dioxolanes: development of high-affinity ligands for the progesterone receptor with high in vivo target site selectivity. J Med Chem. 1995;38:328–337. doi: 10.1021/jm00002a014. [DOI] [PubMed] [Google Scholar]
- 12.Vijaykumar D, Mao W, Kirschbaum KS, Katzenellenbogen JA. An efficient route for the preparation of a 21-fluoro progestin-16 alpha,17 alpha-dioxolane, a high-affinity ligand for PET imaging of the progesterone receptor. J Org Chem. 2002;67:4904–4910. doi: 10.1021/jo020190r. [DOI] [PubMed] [Google Scholar]
- 13.Chan SR, Fowler AM, Allen JA, Zhou D, Dence CS, Sharp TL, Fettig NM, Dehdashti F, Katzenellenbogen JA. Longitudinal noninvasive imaging of progesterone receptor as a predictive biomarker of tumor responsiveness to estrogen deprivation therapy. Clin Cancer Res. 2015;21:1063–1070. doi: 10.1158/1078-0432.CCR-14-1715. [DOI] [PMC free article] [PubMed] [Google Scholar]
- 14.Fowler AM, Chan SR, Sharp TL, Fettig NM, Zhou D, Dence CS, Carlson KE, Jeyakumar M, Katzenellenbogen JA, Schreiber RD, Welch MJ. Small-animal PET of steroid hormone receptors predicts tumor response to endocrine therapy using a preclinical model of breast cancer. J Nucl Med. 2012;53:1119–1126. doi: 10.2967/jnumed.112.103465. [DOI] [PMC free article] [PubMed] [Google Scholar]
- 15.Dehdashti F, Laforest R, Gao F, Aft RL, Dence CS, Zhou D, Shoghi KI, Siegel BA, Katzenellenbogen JA, Welch MJ. Assessment of progesterone receptors in breast carcinoma by PET with 21-18F-fluoro-16alpha,17alpha-[(R)-(1’-alpha-furylmethylidene)dioxy] -19-norpregn- 4-ene-3,20-dione. J Nucl Med. 2012;53:363–370. doi: 10.2967/jnumed.111.098319. [DOI] [PMC free article] [PubMed] [Google Scholar]
- 16.van Kruchten M, Glaudemans AW, de Vries EF, Beets-Tan RG, Schroder CP, Dierckx RA, de Vries EG, Hospers GA. PET imaging of estrogen receptors as a diagnostic tool for breast cancer patients presenting with a clinical dilemma. J Nucl Med. 2012;53:182–190. doi: 10.2967/jnumed.111.092734. [DOI] [PubMed] [Google Scholar]
- 17.Venema CM, Apollonio G, Hospers GA, Schroder CP, Dierckx RA, de Vries EF, Glaudemans AW. Recommendations and technical aspects of 16alpha-[18F] fluoro-17beta-estradiol PET to image the estrogen receptor in vivo: the Groningen experience. Clin Nucl Med. 2016;41:844–851. doi: 10.1097/RLU.0000000000001347. [DOI] [PubMed] [Google Scholar]
- 18.Mintun MA, Raichle ME, Kilbourn MR, Wooten GF, Welch MJ. A quantitative model for the in vivo assessment of drug binding sites with positron emission tomography. Ann Neurol. 1984;15:217–227. doi: 10.1002/ana.410150302. [DOI] [PubMed] [Google Scholar]
- 19.Zhou D, Lin M, Yasui N, Al-Qahtani MH, Dence CS, Schwarz S, Katzenellenbogen JA. Optimization of the preparation of fluorine-18-labeled steroid receptor ligands 16alpha-[18F] fluoroestradiol (FES), [18F] fluoro furanyl norprogesterone (FFNP), and 16beta-[18F] fluoro-5alpha-dihydrotestosterone (FDHT) as radiopharmaceuticals. J Labelled Comp Radiopharm. 2014;57:371–377. doi: 10.1002/jlcr.3191. [DOI] [PMC free article] [PubMed] [Google Scholar]
- 20.Horwitz KB, Costlow ME, McGuire WL. MCF-7; a human breast cancer cell line with estrogen, androgen, progesterone, and glucocorticoid receptors. Steroids. 1975;26:785–795. doi: 10.1016/0039-128x(75)90110-5. [DOI] [PubMed] [Google Scholar]
- 21.Nawata H, Chong MT, Bronzert D, Lippman ME. Estradiol-independent growth of a subline of MCF-7 human breast cancer cells in culture. J Biol Chem. 1981;256:6895–6902. [PubMed] [Google Scholar]
- 22.Olea-Serrano N, Devleeschouwer N, Leclercq G, Heuson JC. Assay for estrogen and progesterone receptors of breast cancer cell lines in monolayer culture. Eur J Cancer Clin Oncol. 1985;21:965–973. doi: 10.1016/0277-5379(85)90116-6. [DOI] [PubMed] [Google Scholar]
- 23.Pais A, Degani H. Estrogen receptor-targeted contrast agents for molecular magnetic resonance imaging of breast cancer hormonal status. Front Oncol. 2016;6:100. doi: 10.3389/fonc.2016.00100. [DOI] [PMC free article] [PubMed] [Google Scholar]
- 24.Faye JC, Toulas C, Bayard F. Differential estrogenic responsiveness of MCF-7 cells. Relationship to the presence of two different estrogen receptors. J Recept Res. 1989;9:203–219. doi: 10.3109/10799898909066055. [DOI] [PubMed] [Google Scholar]
- 25.Martin MB, Reiter R, Pham T, Avellanet YR, Camara J, Lahm M, Pentecost E, Pratap K, Gilmore BA, Divekar S, Dagata RS, Bull JL, Stoica A. Estrogen-like activity of metals in MCF-7 breast cancer cells. Endocrinology. 2003;144:2425–2436. doi: 10.1210/en.2002-221054. [DOI] [PubMed] [Google Scholar]
- 26.Sarup JC, Rao KV, Fox CF. Decreased progesterone binding and attenuated progesterone action in cultured human breast carcinoma cells treated with epidermal growth factor. Cancer Res. 1988;48:5071–5078. [PubMed] [Google Scholar]
- 27.Lee JH, Zhou HB, Dence CS, Carlson KE, Welch MJ, Katzenellenbogen JA. Development of [F-18] fluorine-substituted Tanaproget as a progesterone receptor imaging agent for positron emission tomography. Bioconjug Chem. 2010;21:1096–1104. doi: 10.1021/bc1001054. [DOI] [PubMed] [Google Scholar]
- 28.Keydar I, Chen L, Karby S, Weiss FR, Delarea J, Radu M, Chaitcik S, Brenner HJ. Establishment and characterization of a cell line of human breast carcinoma origin. Eur J Cancer. 1979;15:659–670. doi: 10.1016/0014-2964(79)90139-7. [DOI] [PubMed] [Google Scholar]
- 29.Mockus MB, Lessey BA, Bower MA, Horwitz KB. Estrogen-insensitive progesterone receptors in a human breast cancer cell line: characterization of receptors and of a ligand exchange assay. Endocrinology. 1982;110:1564–1571. doi: 10.1210/endo-110-5-1564. [DOI] [PubMed] [Google Scholar]
- 30.Horwitz KB, Zava DT, Thilagar AK, Jensen EM, McGuire WL. Steroid receptor analyses of nine human breast cancer cell lines. Cancer Res. 1978;38:2434–2437. [PubMed] [Google Scholar]
- 31.Burdall SE, Hanby AM, Lansdown MR, Speirs V. Breast cancer cell lines: friend or foe? Breast Cancer Res. 2003;5:89–95. doi: 10.1186/bcr577. [DOI] [PMC free article] [PubMed] [Google Scholar]
- 32.Brandes SJ, Katzenellenbogen JA. Fluorinated androgens and progestins: molecular probes for androgen and progesterone receptors with potential use in positron emission tomography. Mol Pharmacol. 1987;32:391–403. [PubMed] [Google Scholar]
- 33.Heidari P, Deng F, Esfahani SA, Leece AK, Shoup TM, Vasdev N, Mahmood U. Pharmacodynamic imaging guides dosing of a selective estrogen receptor degrader. Clin Cancer Res. 2015;21:1340–1347. doi: 10.1158/1078-0432.CCR-14-1178. [DOI] [PMC free article] [PubMed] [Google Scholar]
- 34.Wu X, You L, Zhang D, Gao M, Li Z, Xu D, Zhang P, Huang L, Zhuang R, Wu H, Zhang X. Synthesis and preliminary evaluation of a (18) F-labeled ethisterone derivative [(18) F] EAEF for progesterone receptor targeting. Chem Biol Drug Des. 2017;89:559–565. doi: 10.1111/cbdd.12878. [DOI] [PubMed] [Google Scholar]
- 35.Paquette M, Lavallee E, Phoenix S, Ouellet R, Senta H, van Lier JE, Guerin B, Lecomte R, Turcotte EE. Improved estrogen receptor assessment by PET using the novel radiotracer 4FMFES in ER+ breast cancer patients: an ongoing phase II clinical trial. J Nucl Med. 2018;59:197–203. doi: 10.2967/jnumed.117.194654. [DOI] [PMC free article] [PubMed] [Google Scholar]
- 36.Salem K, Kumar M, Michel C, Yan Y, Fowler A. Impact of gain-of-function estrogen receptor alpha gene mutations on 18F-fluoroestradiol binding affinity. J Nucl Med. 2017;58:1029. [Google Scholar]


